Tlingit-Haida Disability Age 5 to 17

COMPARE

Tlingit-Haida
Race
Ancestry
AfghanAfricanAlaska NativeAlaskan AthabascanAlbanianAleutAlsatianAmericanApacheArabArapahoArgentineanArmenianAssyrian/Chaldean/SyriacAustralianAustrianBahamianBangladeshiBarbadianBasqueBelgianBelizeanBermudanBhutaneseBlackfeetBolivianBrazilianBritishBritish West IndianBulgarianBurmeseCajunCambodianCanadianCape VerdeanCarpatho RusynCelticCentral AmericanCentral American IndianCherokeeCheyenneChickasawChileanChineseChippewaChoctawColombianColvilleComancheCosta RicanCreeCreekCroatianCrowCubanCypriotCzechCzechoslovakianDanishDelawareDominicanDutchDutch West IndianEastern EuropeanEcuadorianEgyptianEnglishEstonianEthiopianEuropeanFijianFilipinoFinnishFrenchFrench American IndianFrench CanadianGermanGerman RussianGhanaianGreekGuamanian/ChamorroGuatemalanGuyaneseHaitianHmongHonduranHopiHoumaHungarianIcelanderIndian (Asian)IndonesianInupiatIranianIraqiIrishIroquoisIsraeliItalianJamaicanJapaneseJordanianKenyanKiowaKoreanLaotianLatvianLebaneseLiberianLithuanianLumbeeLuxembourgerMacedonianMalaysianMalteseMarshalleseMenomineeMexicanMexican American IndianMongolianMoroccanNative HawaiianNavajoNepaleseNew ZealanderNicaraguanNigerianNorthern EuropeanNorwegianOkinawanOsageOttawaPaiutePakistaniPalestinianPanamanianParaguayanPennsylvania GermanPeruvianPimaPolishPortuguesePotawatomiPuebloPuerto RicanPuget Sound SalishRomanianRussianSalvadoranSamoanScandinavianScotch-IrishScottishSeminoleSenegaleseSerbianShoshoneSierra LeoneanSiouxSlavicSlovakSloveneSomaliSouth AfricanSouth AmericanSouth American IndianSoviet UnionSpaniardSpanishSpanish AmericanSpanish American IndianSri LankanSubsaharan AfricanSudaneseSwedishSwissSyrianTaiwaneseThaiTlingit-HaidaTohono O'OdhamTonganTrinidadian and TobagonianTsimshianTurkishU.S. Virgin IslanderUgandanUkrainianUruguayanUteVenezuelanVietnameseWelshWest IndianYakamaYaquiYugoslavianYumanYup'ikZimbabwean
Immigration
NonimmigrantsImmigrantsAfghanistanAfricaAlbaniaArgentinaArmeniaAsiaAustraliaAustriaBahamasBangladeshBarbadosBelarusBelgiumBelizeBoliviaBosnia and HerzegovinaBrazilBulgariaBurma/MyanmarCabo VerdeCambodiaCameroonCanadaCaribbeanCentral AmericaChileChinaColombiaCongoCosta RicaCroatiaCubaCzechoslovakiaDenmarkDominicaDominican RepublicEastern AfricaEastern AsiaEastern EuropeEcuadorEgyptEl SalvadorEnglandEritreaEthiopiaEuropeFijiFranceGermanyGhanaGreeceGrenadaGuatemalaGuyanaHaitiHondurasHong KongHungaryIndiaIndonesiaIranIraqIrelandIsraelItalyJamaicaJapanJordanKazakhstanKenyaKoreaKuwaitLaosLatin AmericaLatviaLebanonLiberiaLithuaniaMalaysiaMexicoMicronesiaMiddle AfricaMoldovaMoroccoNepalNetherlandsNicaraguaNigeriaNorth AmericaNorth MacedoniaNorthern AfricaNorthern EuropeNorwayOceaniaPakistanPanamaPeruPhilippinesPolandPortugalRomaniaRussiaSaudi ArabiaScotlandSenegalSerbiaSierra LeoneSingaporeSomaliaSouth AfricaSouth AmericaSouth Central AsiaSouth Eastern AsiaSouthern EuropeSpainSri LankaSt. Vincent and the GrenadinesSudanSwedenSwitzerlandSyriaTaiwanThailandTrinidad and TobagoTurkeyUgandaUkraineUruguayUzbekistanVenezuelaVietnamWest IndiesWestern AfricaWestern AsiaWestern EuropeYemenZaireZimbabweAzores
Select to Compare
Race
Ancestry
AfghanAfricanAlaska NativeAlaskan AthabascanAlbanianAleutAlsatianAmericanApacheArabArapahoArgentineanArmenianAssyrian/Chaldean/SyriacAustralianAustrianBahamianBangladeshiBarbadianBasqueBelgianBelizeanBermudanBhutaneseBlackfeetBolivianBrazilianBritishBritish West IndianBulgarianBurmeseCajunCambodianCanadianCape VerdeanCarpatho RusynCelticCentral AmericanCentral American IndianCherokeeCheyenneChickasawChileanChineseChippewaChoctawColombianColvilleComancheCosta RicanCreeCreekCroatianCrowCubanCypriotCzechCzechoslovakianDanishDelawareDominicanDutchDutch West IndianEastern EuropeanEcuadorianEgyptianEnglishEstonianEthiopianEuropeanFijianFilipinoFinnishFrenchFrench American IndianFrench CanadianGermanGerman RussianGhanaianGreekGuamanian/ChamorroGuatemalanGuyaneseHaitianHmongHonduranHopiHoumaHungarianIcelanderIndian (Asian)IndonesianInupiatIranianIraqiIrishIroquoisIsraeliItalianJamaicanJapaneseJordanianKenyanKiowaKoreanLaotianLatvianLebaneseLiberianLithuanianLumbeeLuxembourgerMacedonianMalaysianMalteseMarshalleseMenomineeMexicanMexican American IndianMongolianMoroccanNative HawaiianNavajoNepaleseNew ZealanderNicaraguanNigerianNorthern EuropeanNorwegianOkinawanOsageOttawaPaiutePakistaniPalestinianPanamanianParaguayanPennsylvania GermanPeruvianPimaPolishPortuguesePotawatomiPuebloPuerto RicanPuget Sound SalishRomanianRussianSalvadoranSamoanScandinavianScotch-IrishScottishSeminoleSenegaleseSerbianShoshoneSierra LeoneanSiouxSlavicSlovakSloveneSomaliSouth AfricanSouth AmericanSouth American IndianSoviet UnionSpaniardSpanishSpanish AmericanSpanish American IndianSri LankanSubsaharan AfricanSudaneseSwedishSwissSyrianTaiwaneseThaiTohono O'OdhamTonganTrinidadian and TobagonianTsimshianTurkishU.S. Virgin IslanderUgandanUkrainianUruguayanUteVenezuelanVietnameseWelshWest IndianYakamaYaquiYugoslavianYumanYup'ikZimbabwean
Immigration
NonimmigrantsImmigrantsAfghanistanAfricaAlbaniaArgentinaArmeniaAsiaAustraliaAustriaBahamasBangladeshBarbadosBelarusBelgiumBelizeBoliviaBosnia and HerzegovinaBrazilBulgariaBurma/MyanmarCabo VerdeCambodiaCameroonCanadaCaribbeanCentral AmericaChileChinaColombiaCongoCosta RicaCroatiaCubaCzechoslovakiaDenmarkDominicaDominican RepublicEastern AfricaEastern AsiaEastern EuropeEcuadorEgyptEl SalvadorEnglandEritreaEthiopiaEuropeFijiFranceGermanyGhanaGreeceGrenadaGuatemalaGuyanaHaitiHondurasHong KongHungaryIndiaIndonesiaIranIraqIrelandIsraelItalyJamaicaJapanJordanKazakhstanKenyaKoreaKuwaitLaosLatin AmericaLatviaLebanonLiberiaLithuaniaMalaysiaMexicoMicronesiaMiddle AfricaMoldovaMoroccoNepalNetherlandsNicaraguaNigeriaNorth AmericaNorth MacedoniaNorthern AfricaNorthern EuropeNorwayOceaniaPakistanPanamaPeruPhilippinesPolandPortugalRomaniaRussiaSaudi ArabiaScotlandSenegalSerbiaSierra LeoneSingaporeSomaliaSouth AfricaSouth AmericaSouth Central AsiaSouth Eastern AsiaSouthern EuropeSpainSri LankaSt. Vincent and the GrenadinesSudanSwedenSwitzerlandSyriaTaiwanThailandTrinidad and TobagoTurkeyUgandaUkraineUruguayUzbekistanVenezuelaVietnamWest IndiesWestern AfricaWestern AsiaWestern EuropeYemenZaireZimbabweAzores
Disability Age 5 to 17
Income
Poverty
Unemployment
Labor Participation
Family Structure
Vehicle Availability
Education Level
Disability

Tlingit-Haida Disability Age 5 to 17
Tragic

5.9%
DISABILITY | AGE 5 TO 17
1.9/ 100
METRIC RATING
246th/ 347
METRIC RANK

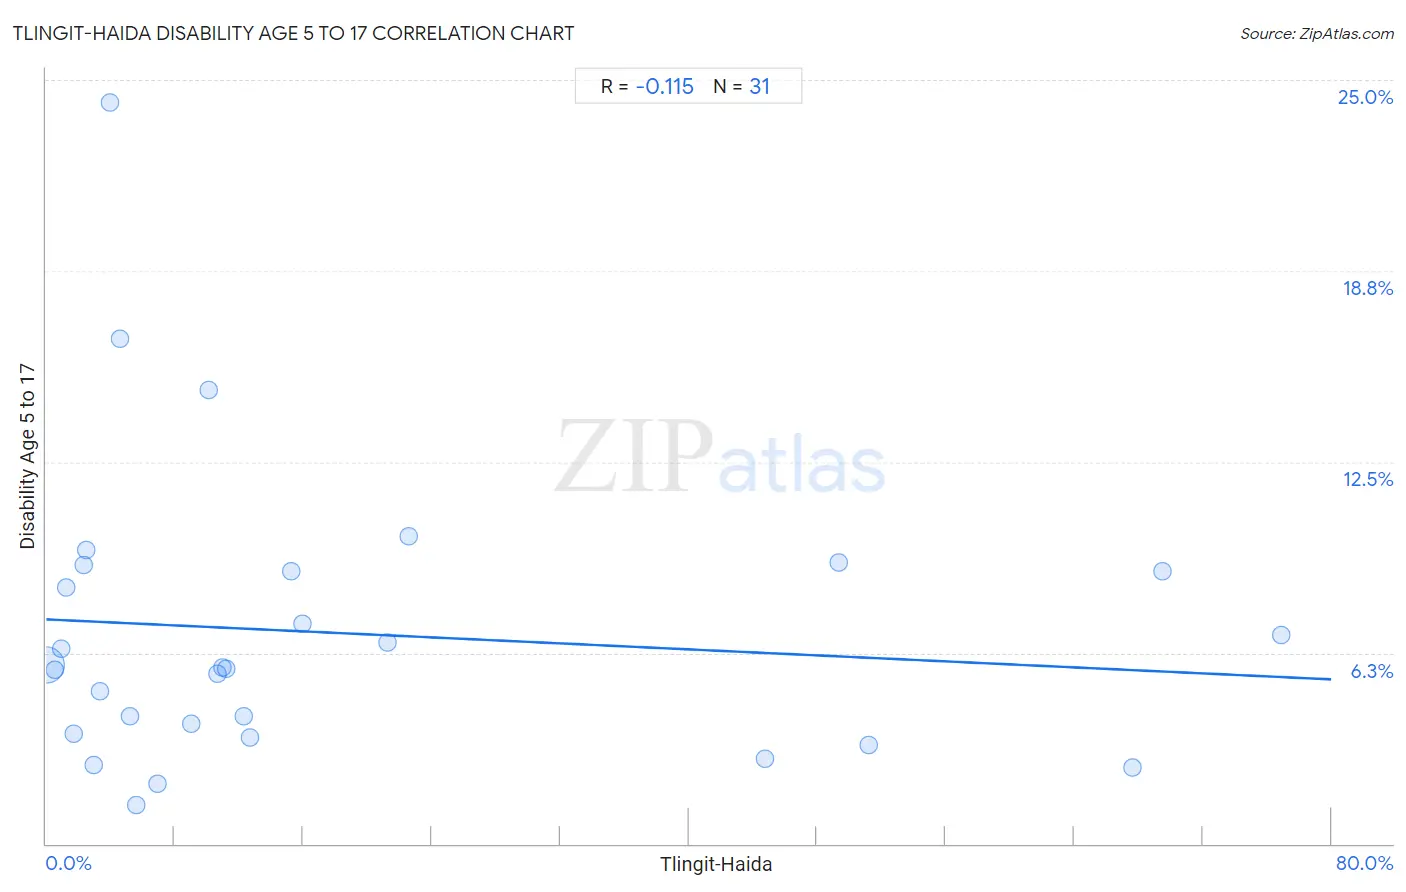
Tlingit-Haida Disability Age 5 to 17 Correlation Chart

The statistical analysis conducted on geographies consisting of 60,715,060 people shows a poor negative correlation between the proportion of Tlingit-Haida and percentage of population with a disability between the ages 5 and 17 in the United States with a correlation coefficient (R) of -0.115 and weighted average of 5.9%. On average, for every 1% (one percent) increase in Tlingit-Haida within a typical geography, there is a decrease of 0.025% in percentage of population with a disability between the ages 5 and 17.
Tlingit-Haida Disability Age 5 to 17
It is essential to understand that the correlation between the percentage of Tlingit-Haida and percentage of population with a disability between the ages 5 and 17 does not imply a direct cause-and-effect relationship. It remains uncertain whether the presence of Tlingit-Haida influences an upward or downward trend in the level of percentage of population with a disability between the ages 5 and 17 within an area, or if Tlingit-Haida simply ended up residing in those areas with higher or lower levels of percentage of population with a disability between the ages 5 and 17 due to other factors.

Demographics Similar to Tlingit-Haida by Disability Age 5 to 17

In terms of disability age 5 to 17, the demographic groups most similar to Tlingit-Haida are Immigrants from Germany (5.9%, a difference of 0.0%), Immigrants from Micronesia (5.9%, a difference of 0.0%), Immigrants from Honduras (5.9%, a difference of 0.030%), Indonesian (5.9%, a difference of 0.060%), and Spaniard (5.9%, a difference of 0.080%).
DemographicsRating | RankDisability Age 5 to 17
German Russians
2.4
/100
|
#239
Tragic
5.9%
West Indians
2.4
/100
|
#240
Tragic
5.9%
Immigrants from Caribbean
2.1
/100
|
#241
Tragic
5.9%
Spaniards
2.0
/100
|
#242
Tragic
5.9%
Indonesians
2.0
/100
|
#243
Tragic
5.9%
Immigrants from Germany
1.9
/100
|
#244
Tragic
5.9%
Immigrants from Micronesia
1.9
/100
|
#245
Tragic
5.9%
Tlingit-Haida
1.9
/100
|
#246
Tragic
5.9%
Immigrants from Honduras
1.8
/100
|
#247
Tragic
5.9%
British
1.7
/100
|
#248
Tragic
5.9%
Immigrants from Ghana
1.7
/100
|
#249
Tragic
5.9%
Poles
1.5
/100
|
#250
Tragic
5.9%
Immigrants from Cambodia
1.5
/100
|
#251
Tragic
5.9%
Hondurans
1.5
/100
|
#252
Tragic
5.9%
Scandinavians
1.4
/100
|
#253
Tragic
5.9%

Tlingit-Haida Disability Age 5 to 17 Correlation Summary

MeasurementTlingit-Haida DataDisability Age 5 to 17 Data
Minimum0.036%1.3%
Maximum76.8%24.2%
Range76.8%23.0%
Mean17.8%6.9%
Median10.1%5.8%
Interquartile 25% (IQ1)3.0%3.6%
Interquartile 75% (IQ3)21.2%8.9%
Interquartile Range (IQR)18.3%5.3%
Standard Deviation (Sample)22.3%4.8%
Standard Deviation (Population)22.0%4.7%

Correlation Details

Tlingit-Haida PercentileSample SizeDisability Age 5 to 17
[
0.0%
-
0.5%
]
0.036%
58,922,0815.8%
[
0.5%
-
1.0%
]
0.55%
1,298,0565.7%
[
0.5%
-
1.0%
]
0.91%
233,4896.4%
[
1.0%
-
1.5%
]
1.23%
79,3768.4%
[
1.5%
-
2.0%
]
1.72%
23,9533.6%
[
2.0%
-
2.5%
]
2.30%
7,3829.1%
[
2.0%
-
2.5%
]
2.46%
3,4119.6%
[
2.5%
-
3.0%
]
2.95%
3,6892.6%
[
3.0%
-
3.5%
]
3.33%
10,1465.0%
[
3.5%
-
4.0%
]
3.97%
1,96424.2%
[
4.5%
-
5.0%
]
4.62%
82216.5%
[
5.0%
-
5.5%
]
5.24%
4204.2%
[
5.5%
-
6.0%
]
5.62%
1,7621.3%
[
6.5%
-
7.0%
]
6.94%
2,1461.9%
[
8.5%
-
9.0%
]
9.00%
6,6913.9%
[
10.0%
-
10.5%
]
10.13%
2,90214.9%
[
10.5%
-
11.0%
]
10.70%
29,9335.6%
[
11.0%
-
11.5%
]
11.00%
32,1085.8%
[
11.0%
-
11.5%
]
11.18%
13,9135.7%
[
12.0%
-
12.5%
]
12.26%
18,0414.2%
[
12.5%
-
13.0%
]
12.67%
8,1683.5%
[
15.0%
-
15.5%
]
15.26%
2,1698.9%
[
15.5%
-
16.0%
]
15.92%
1,7277.2%
[
21.0%
-
21.5%
]
21.23%
4,2676.6%
[
22.5%
-
23.0%
]
22.55%
1,07310.1%
[
44.5%
-
45.0%
]
44.78%
9202.8%
[
49.0%
-
49.5%
]
49.33%
1,7929.2%
[
51.0%
-
51.5%
]
51.24%
8043.2%
[
67.5%
-
68.0%
]
67.59%
3612.5%
[
69.5%
-
70.0%
]
69.51%
6568.9%
[
76.5%
-
77.0%
]
76.85%
8386.8%