Ghanaian Disability Age 5 to 17
COMPARE
Ghanaian
Select to Compare
Disability Age 5 to 17
Ghanaian Disability Age 5 to 17
5.8%
DISABILITY | AGE 5 TO 17
4.7/ 100
METRIC RATING
230th/ 347
METRIC RANK
Ghanaian Disability Age 5 to 17 Correlation Chart
The statistical analysis conducted on geographies consisting of 189,962,788 people shows a mild positive correlation between the proportion of Ghanaians and percentage of population with a disability between the ages 5 and 17 in the United States with a correlation coefficient (R) of 0.308 and weighted average of 5.8%. On average, for every 1% (one percent) increase in Ghanaians within a typical geography, there is an increase of 0.74% in percentage of population with a disability between the ages 5 and 17.
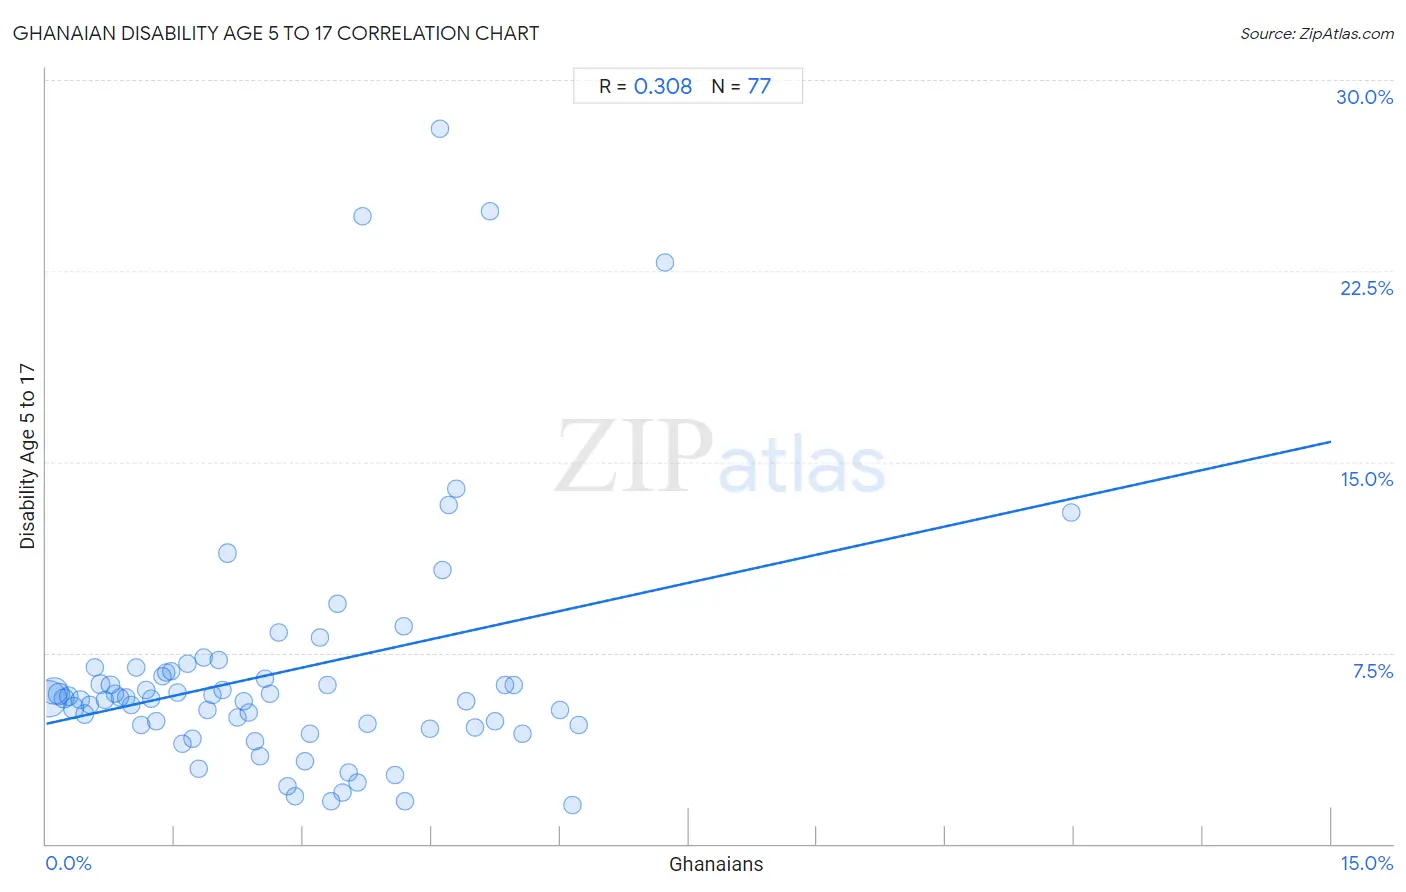
It is essential to understand that the correlation between the percentage of Ghanaians and percentage of population with a disability between the ages 5 and 17 does not imply a direct cause-and-effect relationship. It remains uncertain whether the presence of Ghanaians influences an upward or downward trend in the level of percentage of population with a disability between the ages 5 and 17 within an area, or if Ghanaians simply ended up residing in those areas with higher or lower levels of percentage of population with a disability between the ages 5 and 17 due to other factors.
Demographics Similar to Ghanaians by Disability Age 5 to 17
In terms of disability age 5 to 17, the demographic groups most similar to Ghanaians are Bangladeshi (5.8%, a difference of 0.010%), Haitian (5.8%, a difference of 0.020%), European (5.8%, a difference of 0.070%), Swiss (5.8%, a difference of 0.10%), and British West Indian (5.8%, a difference of 0.18%).
| Demographics | Rating | Rank | Disability Age 5 to 17 |
| Alsatians | 6.0 /100 | #223 | Tragic 5.8% |
| Mexicans | 5.7 /100 | #224 | Tragic 5.8% |
| Guamanians/Chamorros | 5.6 /100 | #225 | Tragic 5.8% |
| British West Indians | 5.4 /100 | #226 | Tragic 5.8% |
| Swiss | 5.1 /100 | #227 | Tragic 5.8% |
| Haitians | 4.8 /100 | #228 | Tragic 5.8% |
| Bangladeshis | 4.8 /100 | #229 | Tragic 5.8% |
| Ghanaians | 4.7 /100 | #230 | Tragic 5.8% |
| Europeans | 4.5 /100 | #231 | Tragic 5.8% |
| Immigrants from Laos | 3.8 /100 | #232 | Tragic 5.8% |
| Immigrants from West Indies | 3.5 /100 | #233 | Tragic 5.8% |
| Immigrants from Kenya | 3.4 /100 | #234 | Tragic 5.8% |
| Malaysians | 3.4 /100 | #235 | Tragic 5.8% |
| Immigrants from Brazil | 3.2 /100 | #236 | Tragic 5.8% |
| Sudanese | 2.9 /100 | #237 | Tragic 5.8% |
Ghanaian Disability Age 5 to 17 Correlation Summary
| Measurement | Ghanaian Data | Disability Age 5 to 17 Data |
| Minimum | 0.028% | 1.5% |
| Maximum | 12.0% | 28.1% |
| Range | 11.9% | 26.6% |
| Mean | 2.7% | 6.7% |
| Median | 2.4% | 5.7% |
| Interquartile 25% (IQ1) | 1.1% | 4.6% |
| Interquartile 75% (IQ3) | 4.1% | 6.8% |
| Interquartile Range (IQR) | 3.0% | 2.1% |
| Standard Deviation (Sample) | 2.1% | 5.0% |
| Standard Deviation (Population) | 2.1% | 4.9% |
Correlation Details
| Ghanaian Percentile | Sample Size | Disability Age 5 to 17 |
[ 0.0% - 0.5% ] 0.028% | 84,586,836 | 5.7% |
[ 0.0% - 0.5% ] 0.088% | 42,302,479 | 6.0% |
[ 0.0% - 0.5% ] 0.15% | 14,948,258 | 5.9% |
[ 0.0% - 0.5% ] 0.21% | 8,562,433 | 5.7% |
[ 0.0% - 0.5% ] 0.27% | 6,161,806 | 5.8% |
[ 0.0% - 0.5% ] 0.32% | 12,760,334 | 5.3% |
[ 0.0% - 0.5% ] 0.39% | 3,359,128 | 5.7% |
[ 0.0% - 0.5% ] 0.45% | 2,766,991 | 5.1% |
[ 0.5% - 1.0% ] 0.51% | 1,729,028 | 5.4% |
[ 0.5% - 1.0% ] 0.57% | 1,309,880 | 6.9% |
[ 0.5% - 1.0% ] 0.63% | 1,969,982 | 6.3% |
[ 0.5% - 1.0% ] 0.68% | 774,655 | 5.6% |
[ 0.5% - 1.0% ] 0.75% | 1,418,175 | 6.2% |
[ 0.5% - 1.0% ] 0.80% | 656,263 | 5.9% |
[ 0.5% - 1.0% ] 0.87% | 530,607 | 5.7% |
[ 0.5% - 1.0% ] 0.93% | 447,036 | 5.7% |
[ 0.5% - 1.0% ] 0.99% | 350,759 | 5.4% |
[ 1.0% - 1.5% ] 1.05% | 567,076 | 6.9% |
[ 1.0% - 1.5% ] 1.10% | 225,552 | 4.6% |
[ 1.0% - 1.5% ] 1.17% | 321,189 | 6.0% |
[ 1.0% - 1.5% ] 1.22% | 318,301 | 5.7% |
[ 1.0% - 1.5% ] 1.28% | 430,511 | 4.8% |
[ 1.0% - 1.5% ] 1.35% | 190,514 | 6.6% |
[ 1.0% - 1.5% ] 1.40% | 339,224 | 6.7% |
[ 1.0% - 1.5% ] 1.46% | 229,891 | 6.8% |
[ 1.5% - 2.0% ] 1.53% | 62,787 | 6.0% |
[ 1.5% - 2.0% ] 1.58% | 190,133 | 3.9% |
[ 1.5% - 2.0% ] 1.65% | 209,055 | 7.1% |
[ 1.5% - 2.0% ] 1.71% | 115,620 | 4.1% |
[ 1.5% - 2.0% ] 1.78% | 74,718 | 2.9% |
[ 1.5% - 2.0% ] 1.84% | 252,368 | 7.3% |
[ 1.5% - 2.0% ] 1.88% | 280,228 | 5.3% |
[ 1.5% - 2.0% ] 1.94% | 71,950 | 5.8% |
[ 2.0% - 2.5% ] 2.02% | 125,871 | 7.2% |
[ 2.0% - 2.5% ] 2.06% | 80,818 | 6.0% |
[ 2.0% - 2.5% ] 2.12% | 102,872 | 11.4% |
[ 2.0% - 2.5% ] 2.23% | 14,296 | 5.0% |
[ 2.0% - 2.5% ] 2.31% | 36,119 | 5.6% |
[ 2.0% - 2.5% ] 2.37% | 38,913 | 5.2% |
[ 2.0% - 2.5% ] 2.44% | 84,014 | 4.0% |
[ 2.0% - 2.5% ] 2.49% | 5,294 | 3.4% |
[ 2.5% - 3.0% ] 2.55% | 231,804 | 6.5% |
[ 2.5% - 3.0% ] 2.60% | 12,745 | 5.9% |
[ 2.5% - 3.0% ] 2.72% | 181,389 | 8.3% |
[ 2.5% - 3.0% ] 2.81% | 13,927 | 2.2% |
[ 2.5% - 3.0% ] 2.91% | 9,389 | 1.9% |
[ 3.0% - 3.5% ] 3.02% | 43,382 | 3.3% |
[ 3.0% - 3.5% ] 3.08% | 3,638 | 4.3% |
[ 3.0% - 3.5% ] 3.19% | 2,694 | 8.1% |
[ 3.0% - 3.5% ] 3.28% | 22,049 | 6.2% |
[ 3.0% - 3.5% ] 3.33% | 38,632 | 1.7% |
[ 3.0% - 3.5% ] 3.40% | 19,605 | 9.4% |
[ 3.0% - 3.5% ] 3.46% | 1,705 | 2.0% |
[ 3.5% - 4.0% ] 3.52% | 36,265 | 2.8% |
[ 3.5% - 4.0% ] 3.64% | 22,966 | 2.4% |
[ 3.5% - 4.0% ] 3.70% | 703 | 24.7% |
[ 3.5% - 4.0% ] 3.75% | 55,168 | 4.7% |
[ 4.0% - 4.5% ] 4.08% | 19,938 | 2.7% |
[ 4.0% - 4.5% ] 4.17% | 30,590 | 8.5% |
[ 4.0% - 4.5% ] 4.19% | 2,980 | 1.7% |
[ 4.0% - 4.5% ] 4.47% | 72,215 | 4.5% |
[ 4.5% - 5.0% ] 4.60% | 630 | 28.1% |
[ 4.5% - 5.0% ] 4.63% | 3,135 | 10.8% |
[ 4.5% - 5.0% ] 4.70% | 1,935 | 13.3% |
[ 4.5% - 5.0% ] 4.79% | 376 | 14.0% |
[ 4.5% - 5.0% ] 4.91% | 23,110 | 5.6% |
[ 5.0% - 5.5% ] 5.01% | 40,724 | 4.6% |
[ 5.0% - 5.5% ] 5.18% | 733 | 24.9% |
[ 5.0% - 5.5% ] 5.24% | 15,508 | 4.8% |
[ 5.0% - 5.5% ] 5.35% | 299 | 6.2% |
[ 5.0% - 5.5% ] 5.46% | 293 | 6.2% |
[ 5.5% - 6.0% ] 5.56% | 1,798 | 4.3% |
[ 6.0% - 6.5% ] 6.00% | 22,505 | 5.3% |
[ 6.0% - 6.5% ] 6.14% | 1,010 | 1.5% |
[ 6.0% - 6.5% ] 6.21% | 22,114 | 4.6% |
[ 7.0% - 7.5% ] 7.22% | 3,575 | 22.8% |
[ 11.5% - 12.0% ] 11.97% | 1,295 | 13.0% |