Iranian Disability Age 5 to 17
COMPARE
Iranian
Select to Compare
Disability Age 5 to 17
Iranian Disability Age 5 to 17
4.6%
DISABILITY | AGE 5 TO 17
100.0/ 100
METRIC RATING
12th/ 347
METRIC RANK
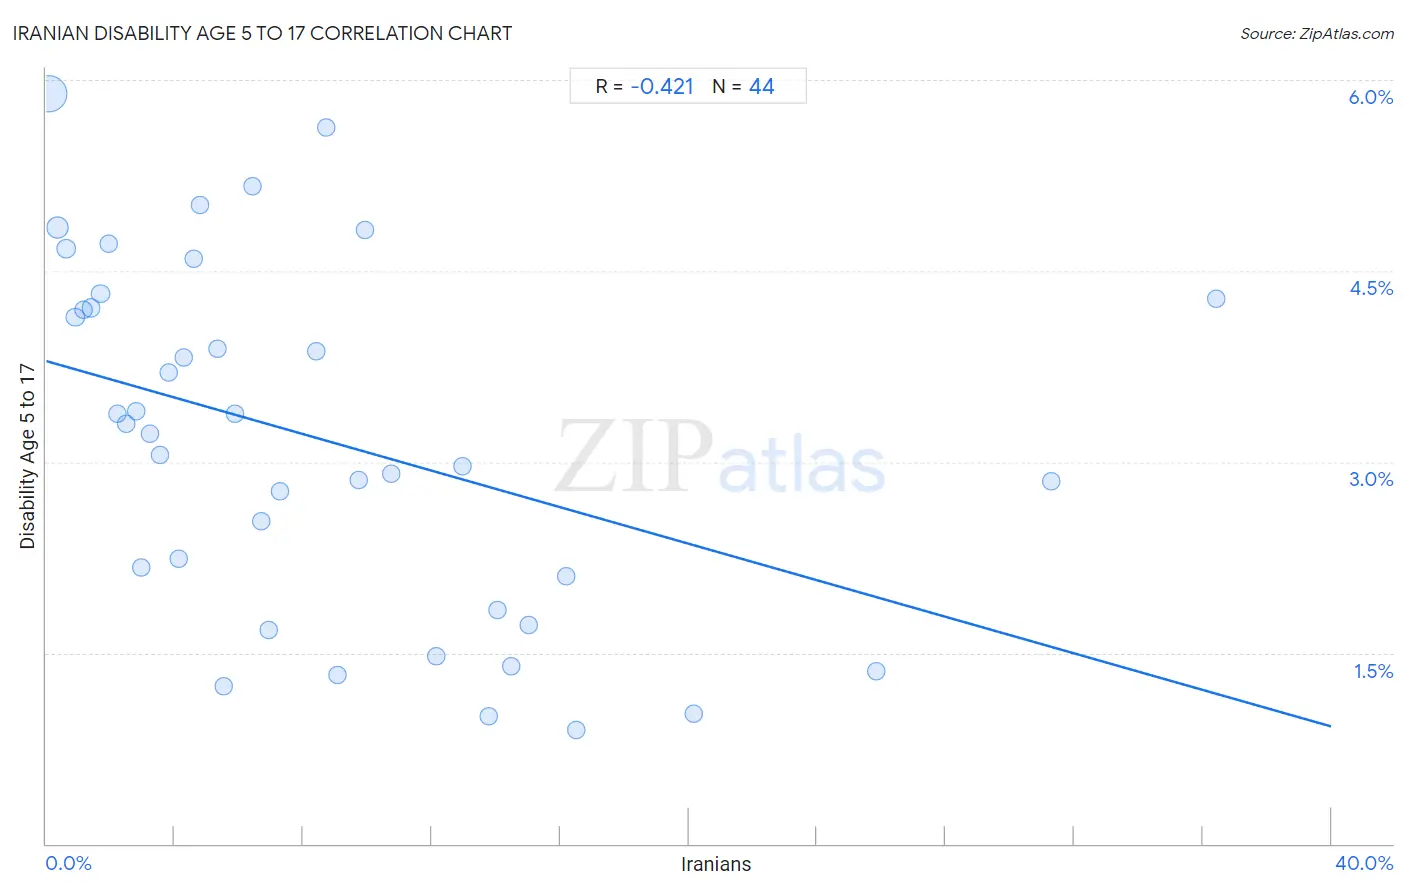
Iranian Disability Age 5 to 17 Correlation Chart
The statistical analysis conducted on geographies consisting of 314,727,969 people shows a moderate negative correlation between the proportion of Iranians and percentage of population with a disability between the ages 5 and 17 in the United States with a correlation coefficient (R) of -0.421 and weighted average of 4.6%. On average, for every 1% (one percent) increase in Iranians within a typical geography, there is a decrease of 0.072% in percentage of population with a disability between the ages 5 and 17.
It is essential to understand that the correlation between the percentage of Iranians and percentage of population with a disability between the ages 5 and 17 does not imply a direct cause-and-effect relationship. It remains uncertain whether the presence of Iranians influences an upward or downward trend in the level of percentage of population with a disability between the ages 5 and 17 within an area, or if Iranians simply ended up residing in those areas with higher or lower levels of percentage of population with a disability between the ages 5 and 17 due to other factors.
Demographics Similar to Iranians by Disability Age 5 to 17
In terms of disability age 5 to 17, the demographic groups most similar to Iranians are Armenian (4.6%, a difference of 0.24%), Immigrants from India (4.6%, a difference of 0.40%), Immigrants from Eastern Asia (4.6%, a difference of 0.47%), Indian (Asian) (4.6%, a difference of 0.80%), and Thai (4.7%, a difference of 1.1%).
| Demographics | Rating | Rank | Disability Age 5 to 17 |
| Immigrants from Iran | 100.0 /100 | #5 | Exceptional 4.4% |
| Immigrants from Israel | 100.0 /100 | #6 | Exceptional 4.5% |
| Immigrants from China | 100.0 /100 | #7 | Exceptional 4.5% |
| Indians (Asian) | 100.0 /100 | #8 | Exceptional 4.6% |
| Immigrants from Eastern Asia | 100.0 /100 | #9 | Exceptional 4.6% |
| Immigrants from India | 100.0 /100 | #10 | Exceptional 4.6% |
| Armenians | 100.0 /100 | #11 | Exceptional 4.6% |
| Iranians | 100.0 /100 | #12 | Exceptional 4.6% |
| Thais | 100.0 /100 | #13 | Exceptional 4.7% |
| Immigrants from Korea | 100.0 /100 | #14 | Exceptional 4.7% |
| Chinese | 100.0 /100 | #15 | Exceptional 4.7% |
| Immigrants from Singapore | 100.0 /100 | #16 | Exceptional 4.7% |
| Arapaho | 100.0 /100 | #17 | Exceptional 4.7% |
| Immigrants from South Central Asia | 100.0 /100 | #18 | Exceptional 4.7% |
| Immigrants from Uzbekistan | 100.0 /100 | #19 | Exceptional 4.8% |
Iranian Disability Age 5 to 17 Correlation Summary
| Measurement | Iranian Data | Disability Age 5 to 17 Data |
| Minimum | 0.097% | 0.90% |
| Maximum | 36.4% | 5.9% |
| Range | 36.3% | 5.0% |
| Mean | 8.6% | 3.2% |
| Median | 6.2% | 3.3% |
| Interquartile 25% (IQ1) | 2.9% | 2.0% |
| Interquartile 75% (IQ3) | 12.6% | 4.2% |
| Interquartile Range (IQR) | 9.7% | 2.3% |
| Standard Deviation (Sample) | 8.1% | 1.4% |
| Standard Deviation (Population) | 8.0% | 1.4% |
Correlation Details
| Iranian Percentile | Sample Size | Disability Age 5 to 17 |
[ 0.0% - 0.5% ] 0.097% | 228,092,818 | 5.9% |
[ 0.0% - 0.5% ] 0.36% | 45,255,472 | 4.8% |
[ 0.5% - 1.0% ] 0.63% | 16,708,971 | 4.7% |
[ 0.5% - 1.0% ] 0.91% | 7,227,069 | 4.1% |
[ 1.0% - 1.5% ] 1.17% | 4,404,749 | 4.2% |
[ 1.0% - 1.5% ] 1.39% | 6,171,904 | 4.2% |
[ 1.5% - 2.0% ] 1.69% | 1,758,203 | 4.3% |
[ 1.5% - 2.0% ] 1.93% | 892,210 | 4.7% |
[ 2.0% - 2.5% ] 2.20% | 710,958 | 3.4% |
[ 2.0% - 2.5% ] 2.47% | 550,650 | 3.3% |
[ 2.5% - 3.0% ] 2.79% | 544,425 | 3.4% |
[ 2.5% - 3.0% ] 2.95% | 233,263 | 2.2% |
[ 3.0% - 3.5% ] 3.21% | 256,572 | 3.2% |
[ 3.5% - 4.0% ] 3.53% | 597,877 | 3.0% |
[ 3.5% - 4.0% ] 3.82% | 245,993 | 3.7% |
[ 4.0% - 4.5% ] 4.13% | 70,323 | 2.2% |
[ 4.0% - 4.5% ] 4.29% | 91,202 | 3.8% |
[ 4.5% - 5.0% ] 4.59% | 79,175 | 4.6% |
[ 4.5% - 5.0% ] 4.77% | 173,030 | 5.0% |
[ 5.0% - 5.5% ] 5.34% | 13,175 | 3.9% |
[ 5.5% - 6.0% ] 5.54% | 12,096 | 1.2% |
[ 5.5% - 6.0% ] 5.89% | 82,117 | 3.4% |
[ 6.0% - 6.5% ] 6.44% | 69,697 | 5.2% |
[ 6.5% - 7.0% ] 6.68% | 69,278 | 2.5% |
[ 6.5% - 7.0% ] 6.94% | 35,333 | 1.7% |
[ 7.0% - 7.5% ] 7.27% | 26,318 | 2.8% |
[ 8.0% - 8.5% ] 8.41% | 51,872 | 3.9% |
[ 8.5% - 9.0% ] 8.72% | 64,485 | 5.6% |
[ 9.0% - 9.5% ] 9.06% | 50,392 | 1.3% |
[ 9.5% - 10.0% ] 9.74% | 28,497 | 2.9% |
[ 9.5% - 10.0% ] 9.92% | 23,106 | 4.8% |
[ 10.5% - 11.0% ] 10.72% | 9,169 | 2.9% |
[ 12.0% - 12.5% ] 12.16% | 2,936 | 1.5% |
[ 12.5% - 13.0% ] 12.98% | 7,868 | 3.0% |
[ 13.5% - 14.0% ] 13.77% | 1,445 | 1.0% |
[ 14.0% - 14.5% ] 14.05% | 10,881 | 1.8% |
[ 14.0% - 14.5% ] 14.47% | 9,699 | 1.4% |
[ 15.0% - 15.5% ] 15.02% | 11,060 | 1.7% |
[ 16.0% - 16.5% ] 16.20% | 16,190 | 2.1% |
[ 16.5% - 17.0% ] 16.51% | 32,406 | 0.90% |
[ 20.0% - 20.5% ] 20.15% | 19,180 | 1.0% |
[ 25.5% - 26.0% ] 25.85% | 1,207 | 1.4% |
[ 31.0% - 31.5% ] 31.30% | 9,105 | 2.9% |
[ 36.0% - 36.5% ] 36.42% | 5,593 | 4.3% |