Senegalese Disability Age 5 to 17

COMPARE

Senegalese
Race
Ancestry
AfghanAfricanAlaska NativeAlaskan AthabascanAlbanianAleutAlsatianAmericanApacheArabArapahoArgentineanArmenianAssyrian/Chaldean/SyriacAustralianAustrianBahamianBangladeshiBarbadianBasqueBelgianBelizeanBermudanBhutaneseBlackfeetBolivianBrazilianBritishBritish West IndianBulgarianBurmeseCajunCambodianCanadianCape VerdeanCarpatho RusynCelticCentral AmericanCentral American IndianCherokeeCheyenneChickasawChileanChineseChippewaChoctawColombianColvilleComancheCosta RicanCreeCreekCroatianCrowCubanCypriotCzechCzechoslovakianDanishDelawareDominicanDutchDutch West IndianEastern EuropeanEcuadorianEgyptianEnglishEstonianEthiopianEuropeanFijianFilipinoFinnishFrenchFrench American IndianFrench CanadianGermanGerman RussianGhanaianGreekGuamanian/ChamorroGuatemalanGuyaneseHaitianHmongHonduranHopiHoumaHungarianIcelanderIndian (Asian)IndonesianInupiatIranianIraqiIrishIroquoisIsraeliItalianJamaicanJapaneseJordanianKenyanKiowaKoreanLaotianLatvianLebaneseLiberianLithuanianLumbeeLuxembourgerMacedonianMalaysianMalteseMarshalleseMenomineeMexicanMexican American IndianMongolianMoroccanNative HawaiianNavajoNepaleseNew ZealanderNicaraguanNigerianNorthern EuropeanNorwegianOkinawanOsageOttawaPaiutePakistaniPalestinianPanamanianParaguayanPennsylvania GermanPeruvianPimaPolishPortuguesePotawatomiPuebloPuerto RicanPuget Sound SalishRomanianRussianSalvadoranSamoanScandinavianScotch-IrishScottishSeminoleSenegaleseSerbianShoshoneSierra LeoneanSiouxSlavicSlovakSloveneSomaliSouth AfricanSouth AmericanSouth American IndianSoviet UnionSpaniardSpanishSpanish AmericanSpanish American IndianSri LankanSubsaharan AfricanSudaneseSwedishSwissSyrianTaiwaneseThaiTlingit-HaidaTohono O'OdhamTonganTrinidadian and TobagonianTsimshianTurkishU.S. Virgin IslanderUgandanUkrainianUruguayanUteVenezuelanVietnameseWelshWest IndianYakamaYaquiYugoslavianYumanYup'ikZimbabwean
Immigration
NonimmigrantsImmigrantsAfghanistanAfricaAlbaniaArgentinaArmeniaAsiaAustraliaAustriaBahamasBangladeshBarbadosBelarusBelgiumBelizeBoliviaBosnia and HerzegovinaBrazilBulgariaBurma/MyanmarCabo VerdeCambodiaCameroonCanadaCaribbeanCentral AmericaChileChinaColombiaCongoCosta RicaCroatiaCubaCzechoslovakiaDenmarkDominicaDominican RepublicEastern AfricaEastern AsiaEastern EuropeEcuadorEgyptEl SalvadorEnglandEritreaEthiopiaEuropeFijiFranceGermanyGhanaGreeceGrenadaGuatemalaGuyanaHaitiHondurasHong KongHungaryIndiaIndonesiaIranIraqIrelandIsraelItalyJamaicaJapanJordanKazakhstanKenyaKoreaKuwaitLaosLatin AmericaLatviaLebanonLiberiaLithuaniaMalaysiaMexicoMicronesiaMiddle AfricaMoldovaMoroccoNepalNetherlandsNicaraguaNigeriaNorth AmericaNorth MacedoniaNorthern AfricaNorthern EuropeNorwayOceaniaPakistanPanamaPeruPhilippinesPolandPortugalRomaniaRussiaSaudi ArabiaScotlandSenegalSerbiaSierra LeoneSingaporeSomaliaSouth AfricaSouth AmericaSouth Central AsiaSouth Eastern AsiaSouthern EuropeSpainSri LankaSt. Vincent and the GrenadinesSudanSwedenSwitzerlandSyriaTaiwanThailandTrinidad and TobagoTurkeyUgandaUkraineUruguayUzbekistanVenezuelaVietnamWest IndiesWestern AfricaWestern AsiaWestern EuropeYemenZaireZimbabweAzores
Select to Compare
Race
Ancestry
AfghanAfricanAlaska NativeAlaskan AthabascanAlbanianAleutAlsatianAmericanApacheArabArapahoArgentineanArmenianAssyrian/Chaldean/SyriacAustralianAustrianBahamianBangladeshiBarbadianBasqueBelgianBelizeanBermudanBhutaneseBlackfeetBolivianBrazilianBritishBritish West IndianBulgarianBurmeseCajunCambodianCanadianCape VerdeanCarpatho RusynCelticCentral AmericanCentral American IndianCherokeeCheyenneChickasawChileanChineseChippewaChoctawColombianColvilleComancheCosta RicanCreeCreekCroatianCrowCubanCypriotCzechCzechoslovakianDanishDelawareDominicanDutchDutch West IndianEastern EuropeanEcuadorianEgyptianEnglishEstonianEthiopianEuropeanFijianFilipinoFinnishFrenchFrench American IndianFrench CanadianGermanGerman RussianGhanaianGreekGuamanian/ChamorroGuatemalanGuyaneseHaitianHmongHonduranHopiHoumaHungarianIcelanderIndian (Asian)IndonesianInupiatIranianIraqiIrishIroquoisIsraeliItalianJamaicanJapaneseJordanianKenyanKiowaKoreanLaotianLatvianLebaneseLiberianLithuanianLumbeeLuxembourgerMacedonianMalaysianMalteseMarshalleseMenomineeMexicanMexican American IndianMongolianMoroccanNative HawaiianNavajoNepaleseNew ZealanderNicaraguanNigerianNorthern EuropeanNorwegianOkinawanOsageOttawaPaiutePakistaniPalestinianPanamanianParaguayanPennsylvania GermanPeruvianPimaPolishPortuguesePotawatomiPuebloPuerto RicanPuget Sound SalishRomanianRussianSalvadoranSamoanScandinavianScotch-IrishScottishSeminoleSerbianShoshoneSierra LeoneanSiouxSlavicSlovakSloveneSomaliSouth AfricanSouth AmericanSouth American IndianSoviet UnionSpaniardSpanishSpanish AmericanSpanish American IndianSri LankanSubsaharan AfricanSudaneseSwedishSwissSyrianTaiwaneseThaiTlingit-HaidaTohono O'OdhamTonganTrinidadian and TobagonianTsimshianTurkishU.S. Virgin IslanderUgandanUkrainianUruguayanUteVenezuelanVietnameseWelshWest IndianYakamaYaquiYugoslavianYumanYup'ikZimbabwean
Immigration
NonimmigrantsImmigrantsAfghanistanAfricaAlbaniaArgentinaArmeniaAsiaAustraliaAustriaBahamasBangladeshBarbadosBelarusBelgiumBelizeBoliviaBosnia and HerzegovinaBrazilBulgariaBurma/MyanmarCabo VerdeCambodiaCameroonCanadaCaribbeanCentral AmericaChileChinaColombiaCongoCosta RicaCroatiaCubaCzechoslovakiaDenmarkDominicaDominican RepublicEastern AfricaEastern AsiaEastern EuropeEcuadorEgyptEl SalvadorEnglandEritreaEthiopiaEuropeFijiFranceGermanyGhanaGreeceGrenadaGuatemalaGuyanaHaitiHondurasHong KongHungaryIndiaIndonesiaIranIraqIrelandIsraelItalyJamaicaJapanJordanKazakhstanKenyaKoreaKuwaitLaosLatin AmericaLatviaLebanonLiberiaLithuaniaMalaysiaMexicoMicronesiaMiddle AfricaMoldovaMoroccoNepalNetherlandsNicaraguaNigeriaNorth AmericaNorth MacedoniaNorthern AfricaNorthern EuropeNorwayOceaniaPakistanPanamaPeruPhilippinesPolandPortugalRomaniaRussiaSaudi ArabiaScotlandSenegalSerbiaSierra LeoneSingaporeSomaliaSouth AfricaSouth AmericaSouth Central AsiaSouth Eastern AsiaSouthern EuropeSpainSri LankaSt. Vincent and the GrenadinesSudanSwedenSwitzerlandSyriaTaiwanThailandTrinidad and TobagoTurkeyUgandaUkraineUruguayUzbekistanVenezuelaVietnamWest IndiesWestern AfricaWestern AsiaWestern EuropeYemenZaireZimbabweAzores
Disability Age 5 to 17
Income
Poverty
Unemployment
Labor Participation
Family Structure
Vehicle Availability
Education Level
Disability

Senegalese Disability Age 5 to 17
Tragic

6.3%
DISABILITY | AGE 5 TO 17
0.0/ 100
METRIC RATING
304th/ 347
METRIC RANK

Senegalese Disability Age 5 to 17 Correlation Chart

The statistical analysis conducted on geographies consisting of 78,060,240 people shows no correlation between the proportion of Senegalese and percentage of population with a disability between the ages 5 and 17 in the United States with a correlation coefficient (R) of 0.042 and weighted average of 6.3%. On average, for every 1% (one percent) increase in Senegalese within a typical geography, there is an increase of 0.18% in percentage of population with a disability between the ages 5 and 17.
Senegalese Disability Age 5 to 17
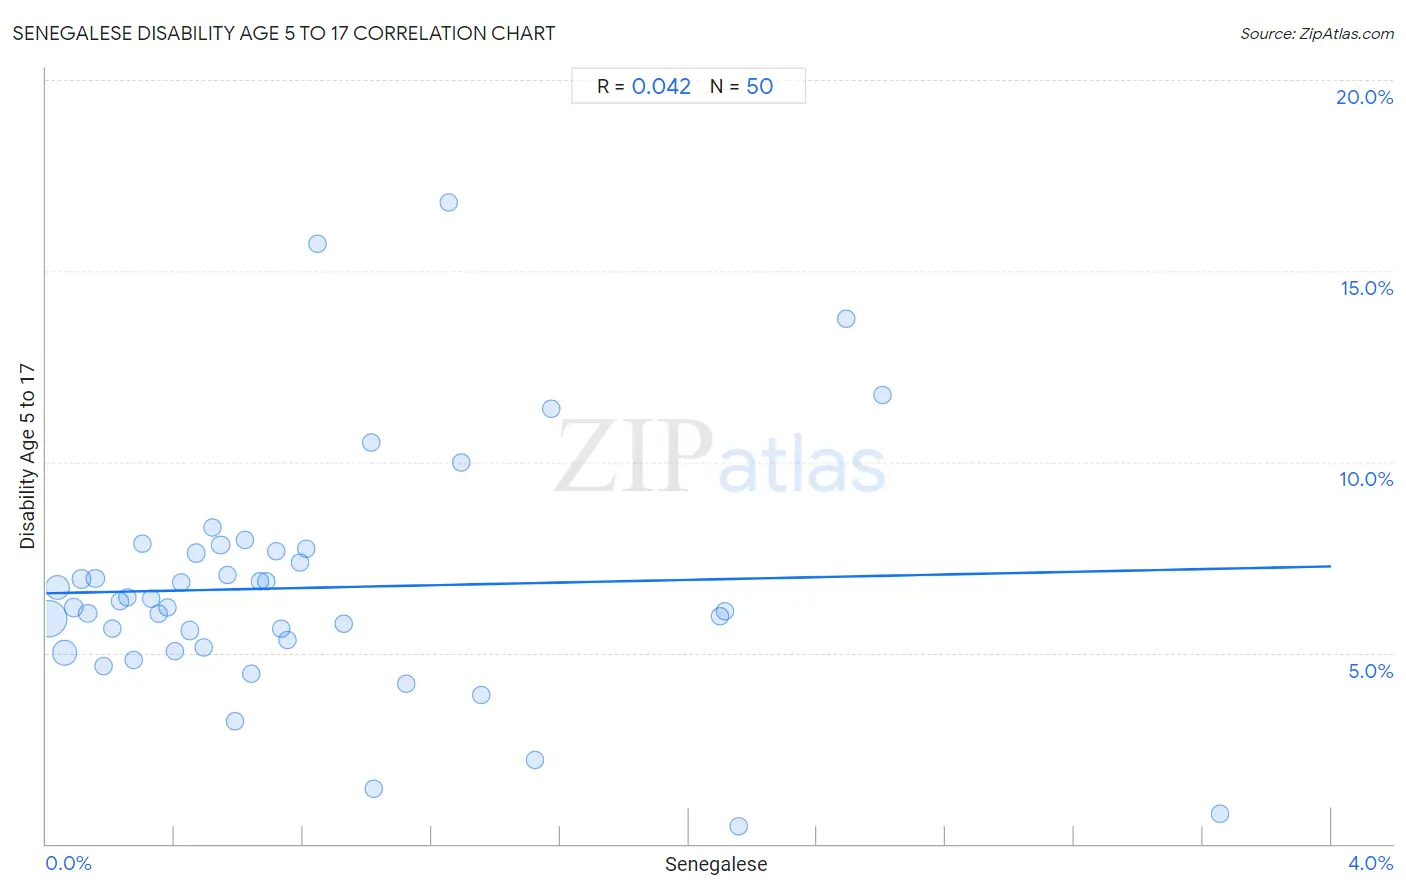
It is essential to understand that the correlation between the percentage of Senegalese and percentage of population with a disability between the ages 5 and 17 does not imply a direct cause-and-effect relationship. It remains uncertain whether the presence of Senegalese influences an upward or downward trend in the level of percentage of population with a disability between the ages 5 and 17 within an area, or if Senegalese simply ended up residing in those areas with higher or lower levels of percentage of population with a disability between the ages 5 and 17 due to other factors.

Demographics Similar to Senegalese by Disability Age 5 to 17

In terms of disability age 5 to 17, the demographic groups most similar to Senegalese are Yakama (6.3%, a difference of 0.080%), Native/Alaskan (6.3%, a difference of 0.14%), Celtic (6.3%, a difference of 0.18%), Nonimmigrants (6.3%, a difference of 0.24%), and Bahamian (6.3%, a difference of 0.38%).
DemographicsRating | RankDisability Age 5 to 17
Immigrants from Bahamas
0.0
/100
|
#297
Tragic
6.2%
Lumbee
0.0
/100
|
#298
Tragic
6.2%
Welsh
0.0
/100
|
#299
Tragic
6.3%
Carpatho Rusyns
0.0
/100
|
#300
Tragic
6.3%
U.S. Virgin Islanders
0.0
/100
|
#301
Tragic
6.3%
Celtics
0.0
/100
|
#302
Tragic
6.3%
Yakama
0.0
/100
|
#303
Tragic
6.3%
Senegalese
0.0
/100
|
#304
Tragic
6.3%
Natives/Alaskans
0.0
/100
|
#305
Tragic
6.3%
Nonimmigrants
0.0
/100
|
#306
Tragic
6.3%
Bahamians
0.0
/100
|
#307
Tragic
6.3%
Scotch-Irish
0.0
/100
|
#308
Tragic
6.3%
Hmong
0.0
/100
|
#309
Tragic
6.3%
Alaskan Athabascans
0.0
/100
|
#310
Tragic
6.3%
Immigrants from Dominica
0.0
/100
|
#311
Tragic
6.3%

Senegalese Disability Age 5 to 17 Correlation Summary

MeasurementSenegalese DataDisability Age 5 to 17 Data
Minimum0.0093%0.46%
Maximum3.7%16.8%
Range3.6%16.3%
Mean0.82%6.7%
Median0.60%6.3%
Interquartile 25% (IQ1)0.30%5.2%
Interquartile 75% (IQ3)1.0%7.7%
Interquartile Range (IQR)0.72%2.5%
Standard Deviation (Sample)0.76%3.2%
Standard Deviation (Population)0.76%3.1%

Correlation Details

Senegalese PercentileSample SizeDisability Age 5 to 17
[
0.0%
-
0.5%
]
0.0093%
37,948,7125.9%
[
0.0%
-
0.5%
]
0.036%
12,844,5436.7%
[
0.0%
-
0.5%
]
0.057%
14,084,6615.0%
[
0.0%
-
0.5%
]
0.085%
2,410,3556.2%
[
0.0%
-
0.5%
]
0.11%
1,649,4276.9%
[
0.0%
-
0.5%
]
0.13%
1,643,7746.0%
[
0.0%
-
0.5%
]
0.15%
1,153,9626.9%
[
0.0%
-
0.5%
]
0.18%
603,8494.6%
[
0.0%
-
0.5%
]
0.21%
746,9435.6%
[
0.0%
-
0.5%
]
0.23%
261,6816.4%
[
0.0%
-
0.5%
]
0.25%
544,6816.5%
[
0.0%
-
0.5%
]
0.27%
111,1014.8%
[
0.0%
-
0.5%
]
0.30%
340,8347.9%
[
0.0%
-
0.5%
]
0.33%
411,7656.4%
[
0.0%
-
0.5%
]
0.35%
296,8996.0%
[
0.0%
-
0.5%
]
0.38%
198,3886.2%
[
0.0%
-
0.5%
]
0.40%
353,1135.1%
[
0.0%
-
0.5%
]
0.42%
286,6196.8%
[
0.0%
-
0.5%
]
0.45%
363,3595.6%
[
0.0%
-
0.5%
]
0.47%
124,3247.6%
[
0.0%
-
0.5%
]
0.49%
81,2335.2%
[
0.5%
-
1.0%
]
0.52%
216,8548.3%
[
0.5%
-
1.0%
]
0.54%
137,4597.8%
[
0.5%
-
1.0%
]
0.56%
51,2827.0%
[
0.5%
-
1.0%
]
0.59%
27,1283.2%
[
0.5%
-
1.0%
]
0.62%
307,7408.0%
[
0.5%
-
1.0%
]
0.64%
96,7064.4%
[
0.5%
-
1.0%
]
0.67%
21,2916.9%
[
0.5%
-
1.0%
]
0.69%
116,3866.9%
[
0.5%
-
1.0%
]
0.71%
67,4447.7%
[
0.5%
-
1.0%
]
0.73%
56,5565.6%
[
0.5%
-
1.0%
]
0.75%
106,8475.3%
[
0.5%
-
1.0%
]
0.79%
18,0677.3%
[
0.5%
-
1.0%
]
0.81%
53,0487.7%
[
0.5%
-
1.0%
]
0.84%
31,99915.7%
[
0.5%
-
1.0%
]
0.93%
38,0535.8%
[
1.0%
-
1.5%
]
1.01%
64,38610.5%
[
1.0%
-
1.5%
]
1.02%
33,2521.4%
[
1.0%
-
1.5%
]
1.12%
30,9174.2%
[
1.0%
-
1.5%
]
1.25%
10,52716.8%
[
1.0%
-
1.5%
]
1.29%
31,26810.0%
[
1.0%
-
1.5%
]
1.35%
18,6133.9%
[
1.5%
-
2.0%
]
1.52%
13,8732.2%
[
1.5%
-
2.0%
]
1.57%
19,06911.4%
[
2.0%
-
2.5%
]
2.10%
1,5256.0%
[
2.0%
-
2.5%
]
2.11%
9,4156.1%
[
2.0%
-
2.5%
]
2.15%
5,7080.46%
[
2.0%
-
2.5%
]
2.49%
1,36613.7%
[
2.5%
-
3.0%
]
2.60%
9,87311.7%
[
3.5%
-
4.0%
]
3.66%
3,3650.80%