Immigrants from Grenada Disability Age 5 to 17

COMPARE

Immigrants from Grenada
Race
Ancestry
AfghanAfricanAlaska NativeAlaskan AthabascanAlbanianAleutAlsatianAmericanApacheArabArapahoArgentineanArmenianAssyrian/Chaldean/SyriacAustralianAustrianBahamianBangladeshiBarbadianBasqueBelgianBelizeanBermudanBhutaneseBlackfeetBolivianBrazilianBritishBritish West IndianBulgarianBurmeseCajunCambodianCanadianCape VerdeanCarpatho RusynCelticCentral AmericanCentral American IndianCherokeeCheyenneChickasawChileanChineseChippewaChoctawColombianColvilleComancheCosta RicanCreeCreekCroatianCrowCubanCypriotCzechCzechoslovakianDanishDelawareDominicanDutchDutch West IndianEastern EuropeanEcuadorianEgyptianEnglishEstonianEthiopianEuropeanFijianFilipinoFinnishFrenchFrench American IndianFrench CanadianGermanGerman RussianGhanaianGreekGuamanian/ChamorroGuatemalanGuyaneseHaitianHmongHonduranHopiHoumaHungarianIcelanderIndian (Asian)IndonesianInupiatIranianIraqiIrishIroquoisIsraeliItalianJamaicanJapaneseJordanianKenyanKiowaKoreanLaotianLatvianLebaneseLiberianLithuanianLumbeeLuxembourgerMacedonianMalaysianMalteseMarshalleseMenomineeMexicanMexican American IndianMongolianMoroccanNative HawaiianNavajoNepaleseNew ZealanderNicaraguanNigerianNorthern EuropeanNorwegianOkinawanOsageOttawaPaiutePakistaniPalestinianPanamanianParaguayanPennsylvania GermanPeruvianPimaPolishPortuguesePotawatomiPuebloPuerto RicanPuget Sound SalishRomanianRussianSalvadoranSamoanScandinavianScotch-IrishScottishSeminoleSenegaleseSerbianShoshoneSierra LeoneanSiouxSlavicSlovakSloveneSomaliSouth AfricanSouth AmericanSouth American IndianSoviet UnionSpaniardSpanishSpanish AmericanSpanish American IndianSri LankanSubsaharan AfricanSudaneseSwedishSwissSyrianTaiwaneseThaiTlingit-HaidaTohono O'OdhamTonganTrinidadian and TobagonianTsimshianTurkishU.S. Virgin IslanderUgandanUkrainianUruguayanUteVenezuelanVietnameseWelshWest IndianYakamaYaquiYugoslavianYumanYup'ikZimbabwean
Immigration
NonimmigrantsImmigrantsAfghanistanAfricaAlbaniaArgentinaArmeniaAsiaAustraliaAustriaBahamasBangladeshBarbadosBelarusBelgiumBelizeBoliviaBosnia and HerzegovinaBrazilBulgariaBurma/MyanmarCabo VerdeCambodiaCameroonCanadaCaribbeanCentral AmericaChileChinaColombiaCongoCosta RicaCroatiaCubaCzechoslovakiaDenmarkDominicaDominican RepublicEastern AfricaEastern AsiaEastern EuropeEcuadorEgyptEl SalvadorEnglandEritreaEthiopiaEuropeFijiFranceGermanyGhanaGreeceGrenadaGuatemalaGuyanaHaitiHondurasHong KongHungaryIndiaIndonesiaIranIraqIrelandIsraelItalyJamaicaJapanJordanKazakhstanKenyaKoreaKuwaitLaosLatin AmericaLatviaLebanonLiberiaLithuaniaMalaysiaMexicoMicronesiaMiddle AfricaMoldovaMoroccoNepalNetherlandsNicaraguaNigeriaNorth AmericaNorth MacedoniaNorthern AfricaNorthern EuropeNorwayOceaniaPakistanPanamaPeruPhilippinesPolandPortugalRomaniaRussiaSaudi ArabiaScotlandSenegalSerbiaSierra LeoneSingaporeSomaliaSouth AfricaSouth AmericaSouth Central AsiaSouth Eastern AsiaSouthern EuropeSpainSri LankaSt. Vincent and the GrenadinesSudanSwedenSwitzerlandSyriaTaiwanThailandTrinidad and TobagoTurkeyUgandaUkraineUruguayUzbekistanVenezuelaVietnamWest IndiesWestern AfricaWestern AsiaWestern EuropeYemenZaireZimbabweAzores
Select to Compare
Race
Ancestry
AfghanAfricanAlaska NativeAlaskan AthabascanAlbanianAleutAlsatianAmericanApacheArabArapahoArgentineanArmenianAssyrian/Chaldean/SyriacAustralianAustrianBahamianBangladeshiBarbadianBasqueBelgianBelizeanBermudanBhutaneseBlackfeetBolivianBrazilianBritishBritish West IndianBulgarianBurmeseCajunCambodianCanadianCape VerdeanCarpatho RusynCelticCentral AmericanCentral American IndianCherokeeCheyenneChickasawChileanChineseChippewaChoctawColombianColvilleComancheCosta RicanCreeCreekCroatianCrowCubanCypriotCzechCzechoslovakianDanishDelawareDominicanDutchDutch West IndianEastern EuropeanEcuadorianEgyptianEnglishEstonianEthiopianEuropeanFijianFilipinoFinnishFrenchFrench American IndianFrench CanadianGermanGerman RussianGhanaianGreekGuamanian/ChamorroGuatemalanGuyaneseHaitianHmongHonduranHopiHoumaHungarianIcelanderIndian (Asian)IndonesianInupiatIranianIraqiIrishIroquoisIsraeliItalianJamaicanJapaneseJordanianKenyanKiowaKoreanLaotianLatvianLebaneseLiberianLithuanianLumbeeLuxembourgerMacedonianMalaysianMalteseMarshalleseMenomineeMexicanMexican American IndianMongolianMoroccanNative HawaiianNavajoNepaleseNew ZealanderNicaraguanNigerianNorthern EuropeanNorwegianOkinawanOsageOttawaPaiutePakistaniPalestinianPanamanianParaguayanPennsylvania GermanPeruvianPimaPolishPortuguesePotawatomiPuebloPuerto RicanPuget Sound SalishRomanianRussianSalvadoranSamoanScandinavianScotch-IrishScottishSeminoleSenegaleseSerbianShoshoneSierra LeoneanSiouxSlavicSlovakSloveneSomaliSouth AfricanSouth AmericanSouth American IndianSoviet UnionSpaniardSpanishSpanish AmericanSpanish American IndianSri LankanSubsaharan AfricanSudaneseSwedishSwissSyrianTaiwaneseThaiTlingit-HaidaTohono O'OdhamTonganTrinidadian and TobagonianTsimshianTurkishU.S. Virgin IslanderUgandanUkrainianUruguayanUteVenezuelanVietnameseWelshWest IndianYakamaYaquiYugoslavianYumanYup'ikZimbabwean
Immigration
NonimmigrantsImmigrantsAfghanistanAfricaAlbaniaArgentinaArmeniaAsiaAustraliaAustriaBahamasBangladeshBarbadosBelarusBelgiumBelizeBoliviaBosnia and HerzegovinaBrazilBulgariaBurma/MyanmarCabo VerdeCambodiaCameroonCanadaCaribbeanCentral AmericaChileChinaColombiaCongoCosta RicaCroatiaCubaCzechoslovakiaDenmarkDominicaDominican RepublicEastern AfricaEastern AsiaEastern EuropeEcuadorEgyptEl SalvadorEnglandEritreaEthiopiaEuropeFijiFranceGermanyGhanaGreeceGuatemalaGuyanaHaitiHondurasHong KongHungaryIndiaIndonesiaIranIraqIrelandIsraelItalyJamaicaJapanJordanKazakhstanKenyaKoreaKuwaitLaosLatin AmericaLatviaLebanonLiberiaLithuaniaMalaysiaMexicoMicronesiaMiddle AfricaMoldovaMoroccoNepalNetherlandsNicaraguaNigeriaNorth AmericaNorth MacedoniaNorthern AfricaNorthern EuropeNorwayOceaniaPakistanPanamaPeruPhilippinesPolandPortugalRomaniaRussiaSaudi ArabiaScotlandSenegalSerbiaSierra LeoneSingaporeSomaliaSouth AfricaSouth AmericaSouth Central AsiaSouth Eastern AsiaSouthern EuropeSpainSri LankaSt. Vincent and the GrenadinesSudanSwedenSwitzerlandSyriaTaiwanThailandTrinidad and TobagoTurkeyUgandaUkraineUruguayUzbekistanVenezuelaVietnamWest IndiesWestern AfricaWestern AsiaWestern EuropeYemenZaireZimbabweAzores
Disability Age 5 to 17
Income
Poverty
Unemployment
Labor Participation
Family Structure
Vehicle Availability
Education Level
Disability

Immigrants from Grenada Disability Age 5 to 17
Exceptional

5.3%
DISABILITY | AGE 5 TO 17
99.1/ 100
METRIC RATING
95th/ 347
METRIC RANK

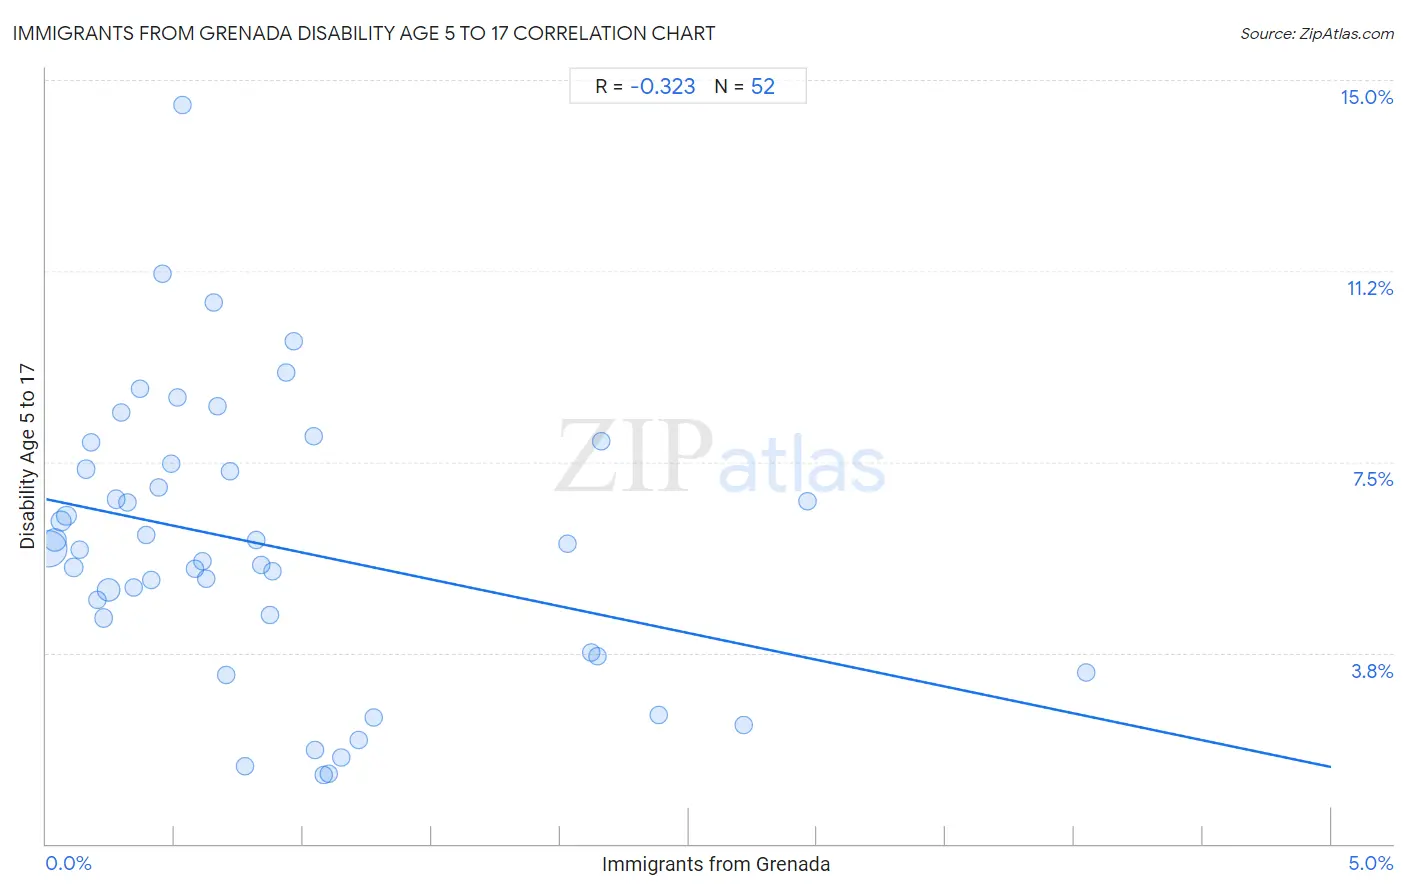
Immigrants from Grenada Disability Age 5 to 17 Correlation Chart

The statistical analysis conducted on geographies consisting of 67,127,267 people shows a mild negative correlation between the proportion of Immigrants from Grenada and percentage of population with a disability between the ages 5 and 17 in the United States with a correlation coefficient (R) of -0.323 and weighted average of 5.3%. On average, for every 1% (one percent) increase in Immigrants from Grenada within a typical geography, there is a decrease of 1.1% in percentage of population with a disability between the ages 5 and 17.
Immigrants from Grenada Disability Age 5 to 17
It is essential to understand that the correlation between the percentage of Immigrants from Grenada and percentage of population with a disability between the ages 5 and 17 does not imply a direct cause-and-effect relationship. It remains uncertain whether the presence of Immigrants from Grenada influences an upward or downward trend in the level of percentage of population with a disability between the ages 5 and 17 within an area, or if Immigrants from Grenada simply ended up residing in those areas with higher or lower levels of percentage of population with a disability between the ages 5 and 17 due to other factors.

Demographics Similar to Immigrants from Grenada by Disability Age 5 to 17

In terms of disability age 5 to 17, the demographic groups most similar to Immigrants from Grenada are Immigrants from Jordan (5.3%, a difference of 0.020%), Immigrants from Peru (5.3%, a difference of 0.090%), Luxembourger (5.3%, a difference of 0.16%), Immigrants from El Salvador (5.3%, a difference of 0.16%), and Immigrants from Europe (5.3%, a difference of 0.16%).
DemographicsRating | RankDisability Age 5 to 17
Immigrants from Croatia
99.4
/100
|
#88
Exceptional
5.2%
Immigrants from Spain
99.4
/100
|
#89
Exceptional
5.2%
Immigrants from Kuwait
99.4
/100
|
#90
Exceptional
5.3%
Mongolians
99.2
/100
|
#91
Exceptional
5.3%
Luxembourgers
99.2
/100
|
#92
Exceptional
5.3%
Immigrants from Peru
99.1
/100
|
#93
Exceptional
5.3%
Immigrants from Jordan
99.1
/100
|
#94
Exceptional
5.3%
Immigrants from Grenada
99.1
/100
|
#95
Exceptional
5.3%
Immigrants from El Salvador
99.0
/100
|
#96
Exceptional
5.3%
Immigrants from Europe
99.0
/100
|
#97
Exceptional
5.3%
Immigrants from Austria
98.9
/100
|
#98
Exceptional
5.3%
Cambodians
98.8
/100
|
#99
Exceptional
5.3%
Nepalese
98.7
/100
|
#100
Exceptional
5.3%
Menominee
98.7
/100
|
#101
Exceptional
5.3%
Nicaraguans
98.6
/100
|
#102
Exceptional
5.3%

Immigrants from Grenada Disability Age 5 to 17 Correlation Summary

MeasurementImmigrants from Grenada DataDisability Age 5 to 17 Data
Minimum0.0078%1.4%
Maximum4.0%14.5%
Range4.0%13.2%
Mean0.87%5.9%
Median0.64%5.8%
Interquartile 25% (IQ1)0.30%4.1%
Interquartile 75% (IQ3)1.1%7.4%
Interquartile Range (IQR)0.76%3.3%
Standard Deviation (Sample)0.84%2.7%
Standard Deviation (Population)0.83%2.7%

Correlation Details

Immigrants from Grenada PercentileSample SizeDisability Age 5 to 17
[
0.0%
-
0.5%
]
0.0078%
32,465,1865.8%
[
0.0%
-
0.5%
]
0.035%
8,810,5286.0%
[
0.0%
-
0.5%
]
0.056%
4,892,9716.3%
[
0.0%
-
0.5%
]
0.079%
3,622,2186.4%
[
0.0%
-
0.5%
]
0.11%
2,383,9335.4%
[
0.0%
-
0.5%
]
0.13%
1,088,3505.8%
[
0.0%
-
0.5%
]
0.15%
711,6877.4%
[
0.0%
-
0.5%
]
0.17%
537,1647.9%
[
0.0%
-
0.5%
]
0.20%
441,5474.8%
[
0.0%
-
0.5%
]
0.22%
291,4414.4%
[
0.0%
-
0.5%
]
0.24%
8,948,9285.0%
[
0.0%
-
0.5%
]
0.27%
504,1176.8%
[
0.0%
-
0.5%
]
0.29%
99,9418.5%
[
0.0%
-
0.5%
]
0.32%
186,7336.7%
[
0.0%
-
0.5%
]
0.34%
157,0515.0%
[
0.0%
-
0.5%
]
0.36%
29,8858.9%
[
0.0%
-
0.5%
]
0.39%
35,3586.1%
[
0.0%
-
0.5%
]
0.41%
67,0845.2%
[
0.0%
-
0.5%
]
0.44%
194,4487.0%
[
0.0%
-
0.5%
]
0.45%
7,51511.2%
[
0.0%
-
0.5%
]
0.49%
108,3027.5%
[
0.5%
-
1.0%
]
0.51%
116,1008.8%
[
0.5%
-
1.0%
]
0.53%
14,75314.5%
[
0.5%
-
1.0%
]
0.58%
15,4055.4%
[
0.5%
-
1.0%
]
0.61%
19,0865.6%
[
0.5%
-
1.0%
]
0.62%
56,5725.2%
[
0.5%
-
1.0%
]
0.65%
61,89710.6%
[
0.5%
-
1.0%
]
0.67%
55,5398.6%
[
0.5%
-
1.0%
]
0.70%
110,9413.3%
[
0.5%
-
1.0%
]
0.71%
8,2627.3%
[
0.5%
-
1.0%
]
0.77%
44,8321.5%
[
0.5%
-
1.0%
]
0.82%
89,3686.0%
[
0.5%
-
1.0%
]
0.84%
135,7335.5%
[
0.5%
-
1.0%
]
0.87%
92,3484.5%
[
0.5%
-
1.0%
]
0.88%
23,2445.4%
[
0.5%
-
1.0%
]
0.93%
2,2469.3%
[
0.5%
-
1.0%
]
0.96%
4,6669.9%
[
1.0%
-
1.5%
]
1.04%
2,1188.0%
[
1.0%
-
1.5%
]
1.04%
7661.9%
[
1.0%
-
1.5%
]
1.08%
1,0201.4%
[
1.0%
-
1.5%
]
1.10%
5,4491.4%
[
1.0%
-
1.5%
]
1.15%
5,8311.7%
[
1.0%
-
1.5%
]
1.22%
83,1252.0%
[
1.0%
-
1.5%
]
1.27%
89,9762.5%
[
2.0%
-
2.5%
]
2.03%
69,1315.9%
[
2.0%
-
2.5%
]
2.12%
101,0533.8%
[
2.0%
-
2.5%
]
2.15%
63,1653.7%
[
2.0%
-
2.5%
]
2.16%
84,0067.9%
[
2.0%
-
2.5%
]
2.38%
100,0822.5%
[
2.5%
-
3.0%
]
2.71%
1,2162.3%
[
2.5%
-
3.0%
]
2.96%
6,4446.7%
[
4.0%
-
4.5%
]
4.05%
78,5063.4%