Tlingit-Haida 2 or more Vehicles in Household

COMPARE

Tlingit-Haida
Race
Ancestry
AfghanAfricanAlaska NativeAlaskan AthabascanAlbanianAleutAlsatianAmericanApacheArabArapahoArgentineanArmenianAssyrian/Chaldean/SyriacAustralianAustrianBahamianBangladeshiBarbadianBasqueBelgianBelizeanBermudanBhutaneseBlackfeetBolivianBrazilianBritishBritish West IndianBulgarianBurmeseCajunCambodianCanadianCape VerdeanCarpatho RusynCelticCentral AmericanCentral American IndianCherokeeCheyenneChickasawChileanChineseChippewaChoctawColombianColvilleComancheCosta RicanCreeCreekCroatianCrowCubanCypriotCzechCzechoslovakianDanishDelawareDominicanDutchDutch West IndianEastern EuropeanEcuadorianEgyptianEnglishEstonianEthiopianEuropeanFijianFilipinoFinnishFrenchFrench American IndianFrench CanadianGermanGerman RussianGhanaianGreekGuamanian/ChamorroGuatemalanGuyaneseHaitianHmongHonduranHopiHoumaHungarianIcelanderIndian (Asian)IndonesianInupiatIranianIraqiIrishIroquoisIsraeliItalianJamaicanJapaneseJordanianKenyanKiowaKoreanLaotianLatvianLebaneseLiberianLithuanianLumbeeLuxembourgerMacedonianMalaysianMalteseMarshalleseMenomineeMexicanMexican American IndianMongolianMoroccanNative HawaiianNavajoNepaleseNew ZealanderNicaraguanNigerianNorthern EuropeanNorwegianOkinawanOsageOttawaPaiutePakistaniPalestinianPanamanianParaguayanPennsylvania GermanPeruvianPimaPolishPortuguesePotawatomiPuebloPuerto RicanPuget Sound SalishRomanianRussianSalvadoranSamoanScandinavianScotch-IrishScottishSeminoleSenegaleseSerbianShoshoneSierra LeoneanSiouxSlavicSlovakSloveneSomaliSouth AfricanSouth AmericanSouth American IndianSoviet UnionSpaniardSpanishSpanish AmericanSpanish American IndianSri LankanSubsaharan AfricanSudaneseSwedishSwissSyrianTaiwaneseThaiTlingit-HaidaTohono O'OdhamTonganTrinidadian and TobagonianTsimshianTurkishU.S. Virgin IslanderUgandanUkrainianUruguayanUteVenezuelanVietnameseWelshWest IndianYakamaYaquiYugoslavianYumanYup'ikZimbabwean
Immigration
NonimmigrantsImmigrantsAfghanistanAfricaAlbaniaArgentinaArmeniaAsiaAustraliaAustriaBahamasBangladeshBarbadosBelarusBelgiumBelizeBoliviaBosnia and HerzegovinaBrazilBulgariaBurma/MyanmarCabo VerdeCambodiaCameroonCanadaCaribbeanCentral AmericaChileChinaColombiaCongoCosta RicaCroatiaCubaCzechoslovakiaDenmarkDominicaDominican RepublicEastern AfricaEastern AsiaEastern EuropeEcuadorEgyptEl SalvadorEnglandEritreaEthiopiaEuropeFijiFranceGermanyGhanaGreeceGrenadaGuatemalaGuyanaHaitiHondurasHong KongHungaryIndiaIndonesiaIranIraqIrelandIsraelItalyJamaicaJapanJordanKazakhstanKenyaKoreaKuwaitLaosLatin AmericaLatviaLebanonLiberiaLithuaniaMalaysiaMexicoMicronesiaMiddle AfricaMoldovaMoroccoNepalNetherlandsNicaraguaNigeriaNorth AmericaNorth MacedoniaNorthern AfricaNorthern EuropeNorwayOceaniaPakistanPanamaPeruPhilippinesPolandPortugalRomaniaRussiaSaudi ArabiaScotlandSenegalSerbiaSierra LeoneSingaporeSomaliaSouth AfricaSouth AmericaSouth Central AsiaSouth Eastern AsiaSouthern EuropeSpainSri LankaSt. Vincent and the GrenadinesSudanSwedenSwitzerlandSyriaTaiwanThailandTrinidad and TobagoTurkeyUgandaUkraineUruguayUzbekistanVenezuelaVietnamWest IndiesWestern AfricaWestern AsiaWestern EuropeYemenZaireZimbabweAzores
Select to Compare
Race
Ancestry
AfghanAfricanAlaska NativeAlaskan AthabascanAlbanianAleutAlsatianAmericanApacheArabArapahoArgentineanArmenianAssyrian/Chaldean/SyriacAustralianAustrianBahamianBangladeshiBarbadianBasqueBelgianBelizeanBermudanBhutaneseBlackfeetBolivianBrazilianBritishBritish West IndianBulgarianBurmeseCajunCambodianCanadianCape VerdeanCarpatho RusynCelticCentral AmericanCentral American IndianCherokeeCheyenneChickasawChileanChineseChippewaChoctawColombianColvilleComancheCosta RicanCreeCreekCroatianCrowCubanCypriotCzechCzechoslovakianDanishDelawareDominicanDutchDutch West IndianEastern EuropeanEcuadorianEgyptianEnglishEstonianEthiopianEuropeanFijianFilipinoFinnishFrenchFrench American IndianFrench CanadianGermanGerman RussianGhanaianGreekGuamanian/ChamorroGuatemalanGuyaneseHaitianHmongHonduranHopiHoumaHungarianIcelanderIndian (Asian)IndonesianInupiatIranianIraqiIrishIroquoisIsraeliItalianJamaicanJapaneseJordanianKenyanKiowaKoreanLaotianLatvianLebaneseLiberianLithuanianLumbeeLuxembourgerMacedonianMalaysianMalteseMarshalleseMenomineeMexicanMexican American IndianMongolianMoroccanNative HawaiianNavajoNepaleseNew ZealanderNicaraguanNigerianNorthern EuropeanNorwegianOkinawanOsageOttawaPaiutePakistaniPalestinianPanamanianParaguayanPennsylvania GermanPeruvianPimaPolishPortuguesePotawatomiPuebloPuerto RicanPuget Sound SalishRomanianRussianSalvadoranSamoanScandinavianScotch-IrishScottishSeminoleSenegaleseSerbianShoshoneSierra LeoneanSiouxSlavicSlovakSloveneSomaliSouth AfricanSouth AmericanSouth American IndianSoviet UnionSpaniardSpanishSpanish AmericanSpanish American IndianSri LankanSubsaharan AfricanSudaneseSwedishSwissSyrianTaiwaneseThaiTohono O'OdhamTonganTrinidadian and TobagonianTsimshianTurkishU.S. Virgin IslanderUgandanUkrainianUruguayanUteVenezuelanVietnameseWelshWest IndianYakamaYaquiYugoslavianYumanYup'ikZimbabwean
Immigration
NonimmigrantsImmigrantsAfghanistanAfricaAlbaniaArgentinaArmeniaAsiaAustraliaAustriaBahamasBangladeshBarbadosBelarusBelgiumBelizeBoliviaBosnia and HerzegovinaBrazilBulgariaBurma/MyanmarCabo VerdeCambodiaCameroonCanadaCaribbeanCentral AmericaChileChinaColombiaCongoCosta RicaCroatiaCubaCzechoslovakiaDenmarkDominicaDominican RepublicEastern AfricaEastern AsiaEastern EuropeEcuadorEgyptEl SalvadorEnglandEritreaEthiopiaEuropeFijiFranceGermanyGhanaGreeceGrenadaGuatemalaGuyanaHaitiHondurasHong KongHungaryIndiaIndonesiaIranIraqIrelandIsraelItalyJamaicaJapanJordanKazakhstanKenyaKoreaKuwaitLaosLatin AmericaLatviaLebanonLiberiaLithuaniaMalaysiaMexicoMicronesiaMiddle AfricaMoldovaMoroccoNepalNetherlandsNicaraguaNigeriaNorth AmericaNorth MacedoniaNorthern AfricaNorthern EuropeNorwayOceaniaPakistanPanamaPeruPhilippinesPolandPortugalRomaniaRussiaSaudi ArabiaScotlandSenegalSerbiaSierra LeoneSingaporeSomaliaSouth AfricaSouth AmericaSouth Central AsiaSouth Eastern AsiaSouthern EuropeSpainSri LankaSt. Vincent and the GrenadinesSudanSwedenSwitzerlandSyriaTaiwanThailandTrinidad and TobagoTurkeyUgandaUkraineUruguayUzbekistanVenezuelaVietnamWest IndiesWestern AfricaWestern AsiaWestern EuropeYemenZaireZimbabweAzores
2 or more Vehicles in Household
Income
Poverty
Unemployment
Labor Participation
Family Structure
Vehicle Availability
Education Level
Disability

Tlingit-Haida 2 or more Vehicles in Household
Good

55.8%
2+ VEHICLES AVAILABLE
68.5/ 100
METRIC RATING
158th/ 347
METRIC RANK

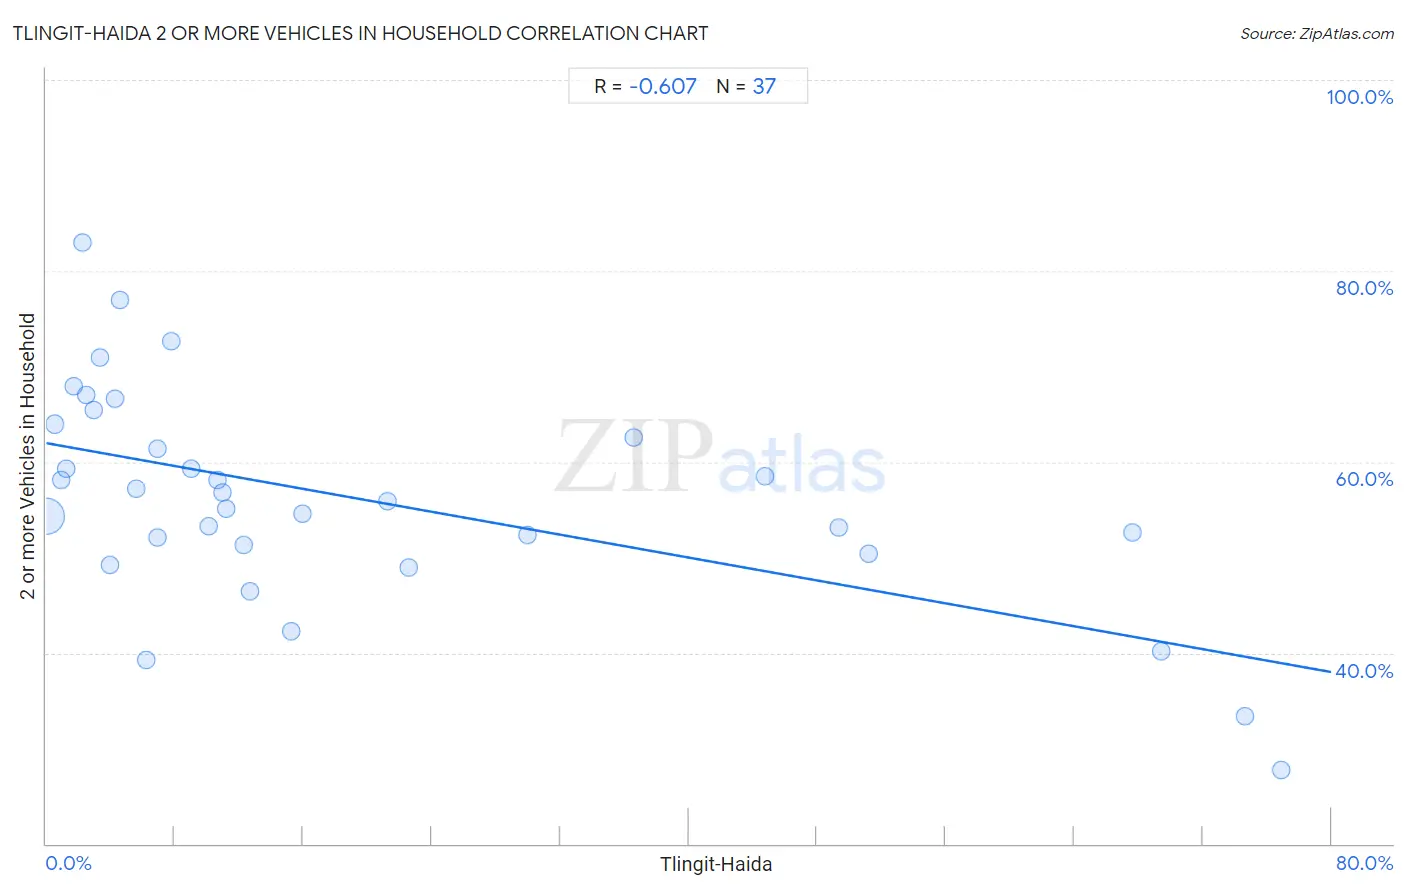
Tlingit-Haida 2 or more Vehicles in Household Correlation Chart

The statistical analysis conducted on geographies consisting of 60,853,675 people shows a significant negative correlation between the proportion of Tlingit-Haida and percentage of households with 2 or more vehicles available in the United States with a correlation coefficient (R) of -0.607 and weighted average of 55.8%. On average, for every 1% (one percent) increase in Tlingit-Haida within a typical geography, there is a decrease of 0.30% in percentage of households with 2 or more vehicles available.
Tlingit-Haida 2 or more Vehicles in Household
It is essential to understand that the correlation between the percentage of Tlingit-Haida and percentage of households with 2 or more vehicles available does not imply a direct cause-and-effect relationship. It remains uncertain whether the presence of Tlingit-Haida influences an upward or downward trend in the level of percentage of households with 2 or more vehicles available within an area, or if Tlingit-Haida simply ended up residing in those areas with higher or lower levels of percentage of households with 2 or more vehicles available due to other factors.

Demographics Similar to Tlingit-Haida by 2 or more Vehicles in Household

In terms of 2 or more vehicles in household, the demographic groups most similar to Tlingit-Haida are Paiute (55.8%, a difference of 0.020%), Crow (55.7%, a difference of 0.070%), Immigrants from Kuwait (55.8%, a difference of 0.080%), Immigrants from Lithuania (55.8%, a difference of 0.090%), and Ukrainian (55.8%, a difference of 0.10%).
DemographicsRating | Rank2 or more Vehicles in Household
Immigrants from Northern Europe
78.7
/100
|
#151
Good
56.1%
Immigrants from Pakistan
78.1
/100
|
#152
Good
56.1%
Lumbee
71.9
/100
|
#153
Good
55.9%
Ukrainians
70.8
/100
|
#154
Good
55.8%
Immigrants from Venezuela
70.7
/100
|
#155
Good
55.8%
Immigrants from Lithuania
70.4
/100
|
#156
Good
55.8%
Immigrants from Kuwait
70.2
/100
|
#157
Good
55.8%
Tlingit-Haida
68.5
/100
|
#158
Good
55.8%
Paiute
68.0
/100
|
#159
Good
55.8%
Crow
67.0
/100
|
#160
Good
55.7%
Colville
61.1
/100
|
#161
Good
55.6%
German Russians
60.9
/100
|
#162
Good
55.6%
Immigrants from Zimbabwe
60.2
/100
|
#163
Good
55.6%
Dutch West Indians
59.8
/100
|
#164
Average
55.6%
Immigrants from El Salvador
59.4
/100
|
#165
Average
55.6%

Tlingit-Haida 2 or more Vehicles in Household Correlation Summary

MeasurementTlingit-Haida Data2 or more Vehicles in Household Data
Minimum0.036%27.8%
Maximum76.8%83.0%
Range76.8%55.2%
Mean19.3%56.2%
Median10.1%55.8%
Interquartile 25% (IQ1)3.7%50.8%
Interquartile 75% (IQ3)26.3%63.2%
Interquartile Range (IQR)22.6%12.4%
Standard Deviation (Sample)23.0%11.4%
Standard Deviation (Population)22.7%11.2%

Correlation Details

Tlingit-Haida PercentileSample Size2 or more Vehicles in Household
[
0.0%
-
0.5%
]
0.036%
59,016,73554.3%
[
0.5%
-
1.0%
]
0.54%
1,312,33964.0%
[
0.5%
-
1.0%
]
0.91%
247,81858.2%
[
1.0%
-
1.5%
]
1.24%
85,68759.3%
[
1.5%
-
2.0%
]
1.72%
24,57167.9%
[
2.0%
-
2.5%
]
2.28%
8,44783.0%
[
2.0%
-
2.5%
]
2.46%
3,65567.1%
[
2.5%
-
3.0%
]
2.92%
6,23165.4%
[
3.0%
-
3.5%
]
3.33%
10,38871.0%
[
3.5%
-
4.0%
]
3.97%
1,96449.2%
[
4.0%
-
4.5%
]
4.26%
4766.7%
[
4.5%
-
5.0%
]
4.62%
82277.0%
[
5.5%
-
6.0%
]
5.62%
1,76257.2%
[
6.0%
-
6.5%
]
6.21%
17739.3%
[
6.5%
-
7.0%
]
6.91%
56461.4%
[
6.5%
-
7.0%
]
6.94%
2,14652.1%
[
7.5%
-
8.0%
]
7.80%
1,25772.6%
[
8.5%
-
9.0%
]
9.00%
6,69159.3%
[
10.0%
-
10.5%
]
10.13%
2,90253.3%
[
10.5%
-
11.0%
]
10.70%
29,93358.1%
[
11.0%
-
11.5%
]
11.00%
32,10856.8%
[
11.0%
-
11.5%
]
11.18%
13,91355.1%
[
12.0%
-
12.5%
]
12.26%
18,04151.3%
[
12.5%
-
13.0%
]
12.66%
8,64746.5%
[
15.0%
-
15.5%
]
15.26%
2,16942.3%
[
15.5%
-
16.0%
]
15.92%
1,72754.6%
[
21.0%
-
21.5%
]
21.23%
4,26755.8%
[
22.5%
-
23.0%
]
22.55%
1,07348.9%
[
29.5%
-
30.0%
]
29.96%
1,12852.4%
[
36.5%
-
37.0%
]
36.59%
8262.5%
[
44.5%
-
45.0%
]
44.78%
92058.6%
[
49.0%
-
49.5%
]
49.33%
1,79253.2%
[
51.0%
-
51.5%
]
51.24%
80450.3%
[
67.5%
-
68.0%
]
67.59%
36152.5%
[
69.0%
-
69.5%
]
69.41%
1,60240.2%
[
74.5%
-
75.0%
]
74.63%
6733.3%
[
76.5%
-
77.0%
]
76.85%
83827.8%