Alaska Native Disability Age 5 to 17
COMPARE
Alaska Native
Select to Compare
Disability Age 5 to 17
Alaska Native Disability Age 5 to 17
6.0%
DISABILITY | AGE 5 TO 17
0.2/ 100
METRIC RATING
273rd/ 347
METRIC RANK
Alaska Native Disability Age 5 to 17 Correlation Chart
The statistical analysis conducted on geographies consisting of 76,612,507 people shows a slight negative correlation between the proportion of Alaska Natives and percentage of population with a disability between the ages 5 and 17 in the United States with a correlation coefficient (R) of -0.064 and weighted average of 6.0%. On average, for every 1% (one percent) increase in Alaska Natives within a typical geography, there is a decrease of 0.024% in percentage of population with a disability between the ages 5 and 17.
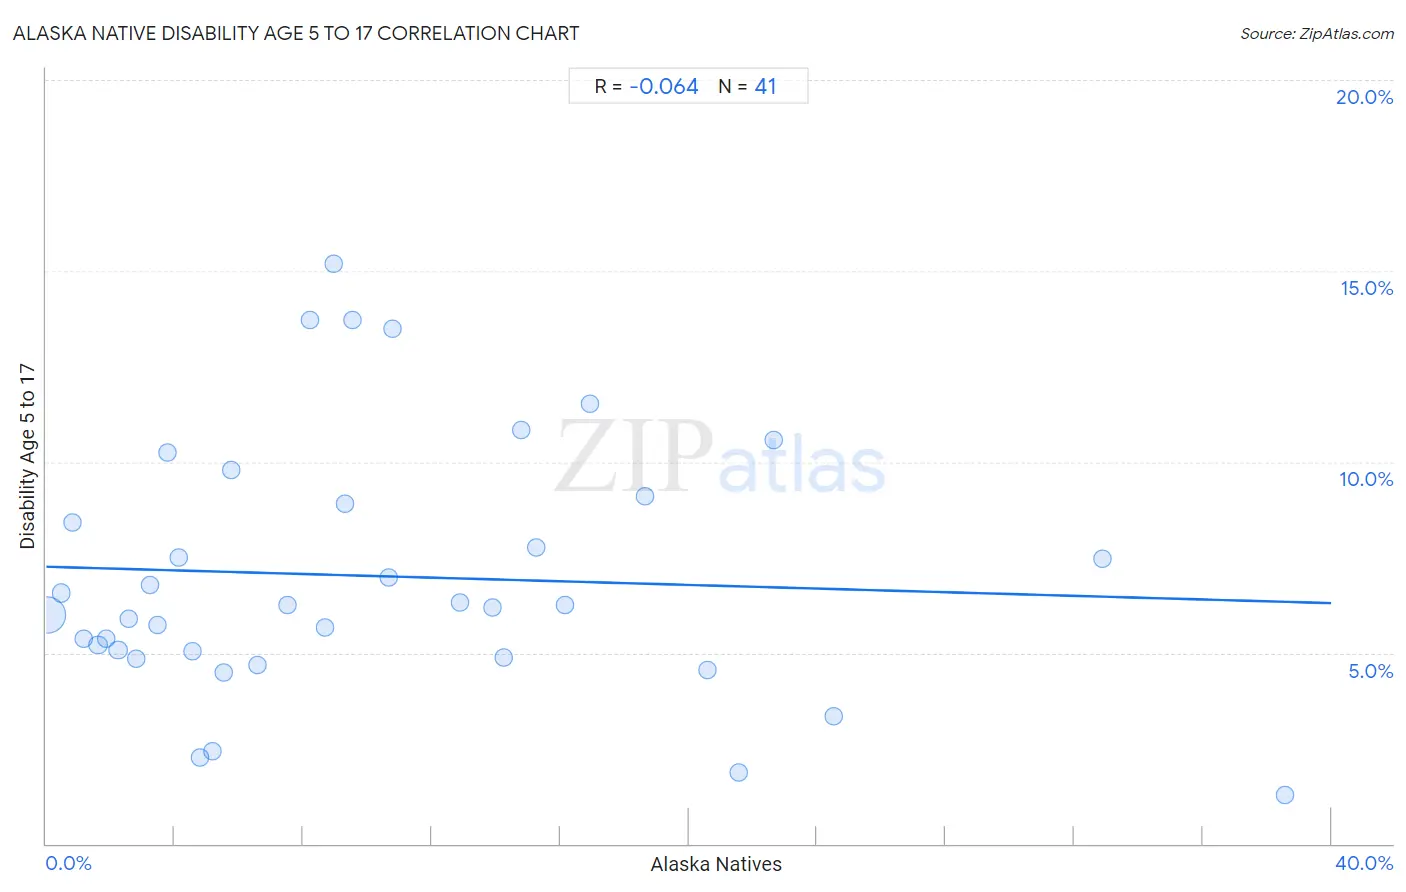
It is essential to understand that the correlation between the percentage of Alaska Natives and percentage of population with a disability between the ages 5 and 17 does not imply a direct cause-and-effect relationship. It remains uncertain whether the presence of Alaska Natives influences an upward or downward trend in the level of percentage of population with a disability between the ages 5 and 17 within an area, or if Alaska Natives simply ended up residing in those areas with higher or lower levels of percentage of population with a disability between the ages 5 and 17 due to other factors.
Demographics Similar to Alaska Natives by Disability Age 5 to 17
In terms of disability age 5 to 17, the demographic groups most similar to Alaska Natives are Finnish (6.0%, a difference of 0.050%), Immigrants from Zaire (6.0%, a difference of 0.080%), Cheyenne (6.0%, a difference of 0.11%), Dutch (6.0%, a difference of 0.22%), and Japanese (6.1%, a difference of 0.33%).
| Demographics | Rating | Rank | Disability Age 5 to 17 |
| Slovenes | 0.6 /100 | #266 | Tragic 6.0% |
| Spanish | 0.5 /100 | #267 | Tragic 6.0% |
| Sioux | 0.4 /100 | #268 | Tragic 6.0% |
| Liberians | 0.4 /100 | #269 | Tragic 6.0% |
| Immigrants from Somalia | 0.4 /100 | #270 | Tragic 6.0% |
| Immigrants from Zaire | 0.2 /100 | #271 | Tragic 6.0% |
| Finns | 0.2 /100 | #272 | Tragic 6.0% |
| Alaska Natives | 0.2 /100 | #273 | Tragic 6.0% |
| Cheyenne | 0.2 /100 | #274 | Tragic 6.0% |
| Dutch | 0.2 /100 | #275 | Tragic 6.0% |
| Japanese | 0.1 /100 | #276 | Tragic 6.1% |
| Puget Sound Salish | 0.1 /100 | #277 | Tragic 6.1% |
| Immigrants from Liberia | 0.1 /100 | #278 | Tragic 6.1% |
| Immigrants from Jamaica | 0.1 /100 | #279 | Tragic 6.1% |
| Portuguese | 0.1 /100 | #280 | Tragic 6.1% |
Alaska Native Disability Age 5 to 17 Correlation Summary
| Measurement | Alaska Native Data | Disability Age 5 to 17 Data |
| Minimum | 0.020% | 1.3% |
| Maximum | 38.6% | 15.2% |
| Range | 38.6% | 13.9% |
| Mean | 10.2% | 7.0% |
| Median | 8.2% | 6.2% |
| Interquartile 25% (IQ1) | 3.3% | 5.0% |
| Interquartile 75% (IQ3) | 15.0% | 9.0% |
| Interquartile Range (IQR) | 11.7% | 4.0% |
| Standard Deviation (Sample) | 8.9% | 3.3% |
| Standard Deviation (Population) | 8.8% | 3.3% |
Correlation Details
| Alaska Native Percentile | Sample Size | Disability Age 5 to 17 |
[ 0.0% - 0.5% ] 0.020% | 74,666,805 | 6.0% |
[ 0.0% - 0.5% ] 0.47% | 552,838 | 6.6% |
[ 0.5% - 1.0% ] 0.81% | 100,202 | 8.4% |
[ 1.0% - 1.5% ] 1.17% | 144,716 | 5.4% |
[ 1.5% - 2.0% ] 1.61% | 434,560 | 5.2% |
[ 1.5% - 2.0% ] 1.85% | 108,188 | 5.4% |
[ 2.0% - 2.5% ] 2.24% | 134,275 | 5.1% |
[ 2.5% - 3.0% ] 2.55% | 92,332 | 5.9% |
[ 2.5% - 3.0% ] 2.81% | 102,747 | 4.9% |
[ 3.0% - 3.5% ] 3.22% | 58,363 | 6.8% |
[ 3.0% - 3.5% ] 3.48% | 108,171 | 5.7% |
[ 3.5% - 4.0% ] 3.77% | 26,339 | 10.3% |
[ 4.0% - 4.5% ] 4.14% | 35,061 | 7.5% |
[ 4.5% - 5.0% ] 4.56% | 10,932 | 5.0% |
[ 4.5% - 5.0% ] 4.78% | 1,298 | 2.2% |
[ 5.0% - 5.5% ] 5.18% | 5,230 | 2.4% |
[ 5.5% - 6.0% ] 5.53% | 398 | 4.5% |
[ 5.5% - 6.0% ] 5.78% | 329 | 9.8% |
[ 6.5% - 7.0% ] 6.58% | 471 | 4.7% |
[ 7.5% - 8.0% ] 7.52% | 439 | 6.2% |
[ 8.0% - 8.5% ] 8.20% | 256 | 13.7% |
[ 8.5% - 9.0% ] 8.69% | 1,128 | 5.7% |
[ 8.5% - 9.0% ] 8.96% | 2,969 | 15.2% |
[ 9.0% - 9.5% ] 9.29% | 452 | 8.9% |
[ 9.5% - 10.0% ] 9.55% | 220 | 13.7% |
[ 10.5% - 11.0% ] 10.66% | 544 | 7.0% |
[ 10.5% - 11.0% ] 10.77% | 1,189 | 13.5% |
[ 12.5% - 13.0% ] 12.89% | 582 | 6.3% |
[ 13.5% - 14.0% ] 13.89% | 864 | 6.2% |
[ 14.0% - 14.5% ] 14.23% | 843 | 4.9% |
[ 14.5% - 15.0% ] 14.78% | 9,755 | 10.8% |
[ 15.0% - 15.5% ] 15.25% | 2,544 | 7.8% |
[ 16.0% - 16.5% ] 16.13% | 155 | 6.2% |
[ 16.5% - 17.0% ] 16.91% | 272 | 11.5% |
[ 18.5% - 19.0% ] 18.64% | 236 | 9.1% |
[ 20.5% - 21.0% ] 20.59% | 952 | 4.5% |
[ 21.5% - 22.0% ] 21.55% | 1,828 | 1.9% |
[ 22.5% - 23.0% ] 22.63% | 760 | 10.6% |
[ 24.0% - 24.5% ] 24.50% | 596 | 3.3% |
[ 32.5% - 33.0% ] 32.89% | 900 | 7.5% |
[ 38.5% - 39.0% ] 38.57% | 1,768 | 1.3% |