Potawatomi Disability Age 5 to 17
COMPARE
Potawatomi
Select to Compare
Disability Age 5 to 17
Potawatomi Disability Age 5 to 17
6.5%
DISABILITY | AGE 5 TO 17
0.0/ 100
METRIC RATING
326th/ 347
METRIC RANK
Potawatomi Disability Age 5 to 17 Correlation Chart
The statistical analysis conducted on geographies consisting of 117,332,661 people shows a slight negative correlation between the proportion of Potawatomi and percentage of population with a disability between the ages 5 and 17 in the United States with a correlation coefficient (R) of -0.096 and weighted average of 6.5%. On average, for every 1% (one percent) increase in Potawatomi within a typical geography, there is a decrease of 0.083% in percentage of population with a disability between the ages 5 and 17.
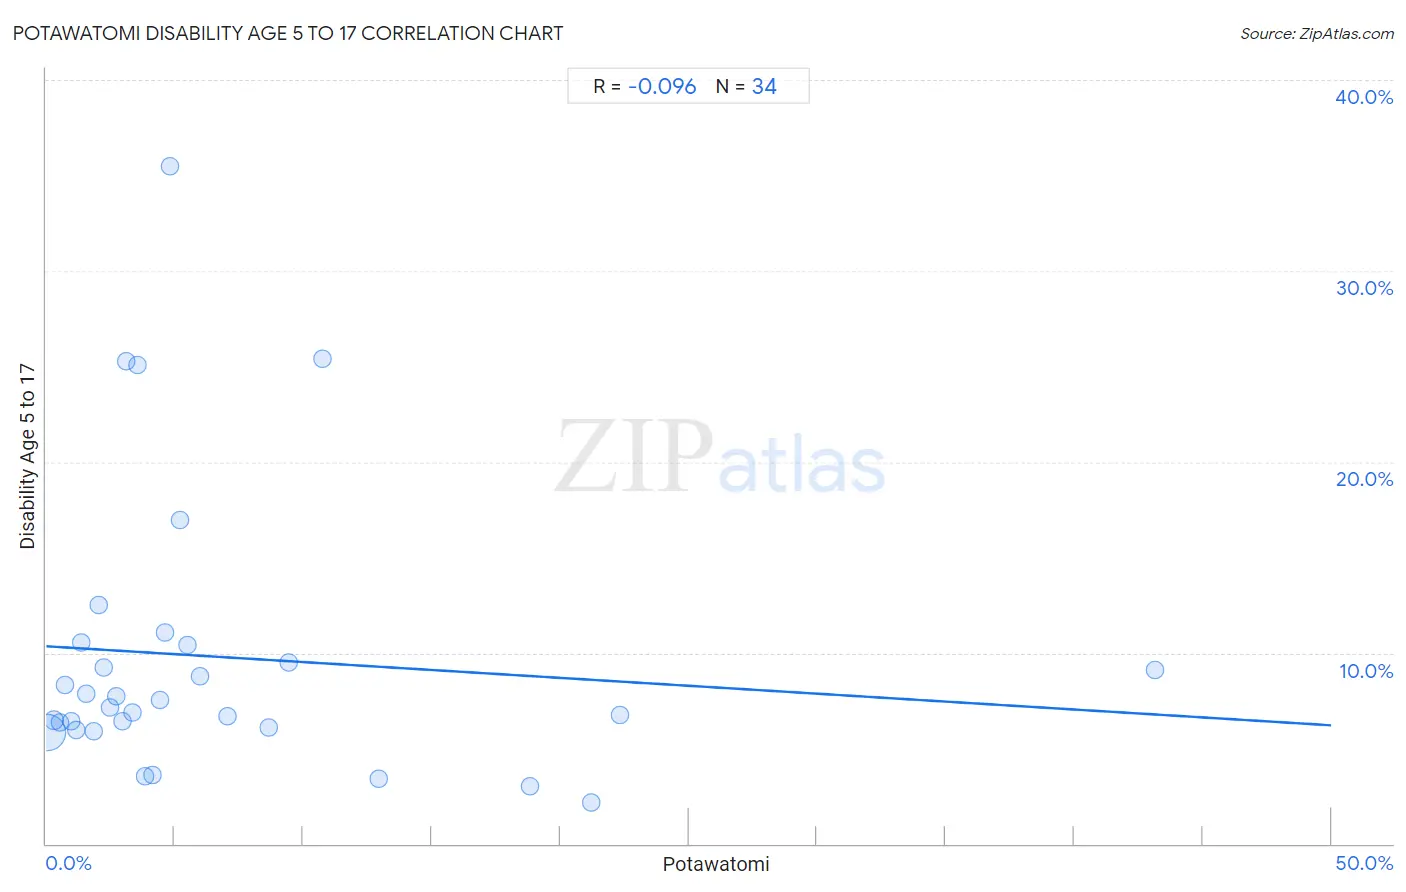
It is essential to understand that the correlation between the percentage of Potawatomi and percentage of population with a disability between the ages 5 and 17 does not imply a direct cause-and-effect relationship. It remains uncertain whether the presence of Potawatomi influences an upward or downward trend in the level of percentage of population with a disability between the ages 5 and 17 within an area, or if Potawatomi simply ended up residing in those areas with higher or lower levels of percentage of population with a disability between the ages 5 and 17 due to other factors.
Demographics Similar to Potawatomi by Disability Age 5 to 17
In terms of disability age 5 to 17, the demographic groups most similar to Potawatomi are American (6.5%, a difference of 0.13%), Dominican (6.5%, a difference of 0.19%), Osage (6.5%, a difference of 0.27%), Slovak (6.5%, a difference of 0.31%), and Tohono O'odham (6.5%, a difference of 0.32%).
| Demographics | Rating | Rank | Disability Age 5 to 17 |
| Delaware | 0.0 /100 | #319 | Tragic 6.5% |
| Africans | 0.0 /100 | #320 | Tragic 6.5% |
| Tohono O'odham | 0.0 /100 | #321 | Tragic 6.5% |
| Slovaks | 0.0 /100 | #322 | Tragic 6.5% |
| Osage | 0.0 /100 | #323 | Tragic 6.5% |
| Dominicans | 0.0 /100 | #324 | Tragic 6.5% |
| Americans | 0.0 /100 | #325 | Tragic 6.5% |
| Potawatomi | 0.0 /100 | #326 | Tragic 6.5% |
| French American Indians | 0.0 /100 | #327 | Tragic 6.6% |
| Pennsylvania Germans | 0.0 /100 | #328 | Tragic 6.6% |
| Blackfeet | 0.0 /100 | #329 | Tragic 6.6% |
| Dutch West Indians | 0.0 /100 | #330 | Tragic 6.7% |
| French Canadians | 0.0 /100 | #331 | Tragic 6.7% |
| Immigrants from the Azores | 0.0 /100 | #332 | Tragic 6.7% |
| Blacks/African Americans | 0.0 /100 | #333 | Tragic 6.8% |
Potawatomi Disability Age 5 to 17 Correlation Summary
| Measurement | Potawatomi Data | Disability Age 5 to 17 Data |
| Minimum | 0.027% | 2.2% |
| Maximum | 43.2% | 35.5% |
| Range | 43.1% | 33.3% |
| Mean | 6.6% | 9.8% |
| Median | 3.7% | 7.3% |
| Interquartile 25% (IQ1) | 1.9% | 6.1% |
| Interquartile 75% (IQ3) | 7.1% | 10.4% |
| Interquartile Range (IQR) | 5.2% | 4.3% |
| Standard Deviation (Sample) | 8.6% | 7.4% |
| Standard Deviation (Population) | 8.5% | 7.3% |
Correlation Details
| Potawatomi Percentile | Sample Size | Disability Age 5 to 17 |
[ 0.0% - 0.5% ] 0.027% | 109,999,145 | 5.8% |
[ 0.0% - 0.5% ] 0.29% | 5,265,030 | 6.5% |
[ 0.5% - 1.0% ] 0.53% | 984,814 | 6.4% |
[ 0.5% - 1.0% ] 0.73% | 376,080 | 8.3% |
[ 0.5% - 1.0% ] 0.95% | 309,131 | 6.4% |
[ 1.0% - 1.5% ] 1.16% | 83,110 | 5.9% |
[ 1.0% - 1.5% ] 1.37% | 62,670 | 10.5% |
[ 1.5% - 2.0% ] 1.57% | 59,311 | 7.8% |
[ 1.5% - 2.0% ] 1.87% | 23,898 | 5.9% |
[ 2.0% - 2.5% ] 2.06% | 37,797 | 12.5% |
[ 2.0% - 2.5% ] 2.26% | 23,481 | 9.2% |
[ 2.0% - 2.5% ] 2.47% | 47,216 | 7.1% |
[ 2.5% - 3.0% ] 2.71% | 8,483 | 7.7% |
[ 2.5% - 3.0% ] 2.94% | 6,762 | 6.4% |
[ 3.0% - 3.5% ] 3.13% | 4,434 | 25.3% |
[ 3.0% - 3.5% ] 3.37% | 4,248 | 6.9% |
[ 3.5% - 4.0% ] 3.57% | 2,327 | 25.0% |
[ 3.5% - 4.0% ] 3.84% | 1,223 | 3.5% |
[ 4.0% - 4.5% ] 4.14% | 2,512 | 3.6% |
[ 4.0% - 4.5% ] 4.41% | 1,610 | 7.5% |
[ 4.5% - 5.0% ] 4.61% | 7,420 | 11.1% |
[ 4.5% - 5.0% ] 4.82% | 2,054 | 35.5% |
[ 5.0% - 5.5% ] 5.21% | 1,324 | 17.0% |
[ 5.0% - 5.5% ] 5.50% | 4,528 | 10.4% |
[ 5.5% - 6.0% ] 5.97% | 3,889 | 8.8% |
[ 7.0% - 7.5% ] 7.06% | 2,607 | 6.7% |
[ 8.5% - 9.0% ] 8.67% | 773 | 6.1% |
[ 9.0% - 9.5% ] 9.43% | 244 | 9.5% |
[ 10.5% - 11.0% ] 10.73% | 382 | 25.4% |
[ 12.5% - 13.0% ] 12.93% | 495 | 3.4% |
[ 18.5% - 19.0% ] 18.85% | 2,462 | 3.0% |
[ 21.0% - 21.5% ] 21.23% | 1,404 | 2.2% |
[ 22.0% - 22.5% ] 22.33% | 1,702 | 6.7% |
[ 43.0% - 43.5% ] 43.16% | 95 | 9.1% |