Immigrants from South America Disability Age 5 to 17
COMPARE
Immigrants from South America
Select to Compare
Disability Age 5 to 17
Immigrants from South America Disability Age 5 to 17
5.4%
DISABILITY | AGE 5 TO 17
97.1/ 100
METRIC RATING
119th/ 347
METRIC RANK
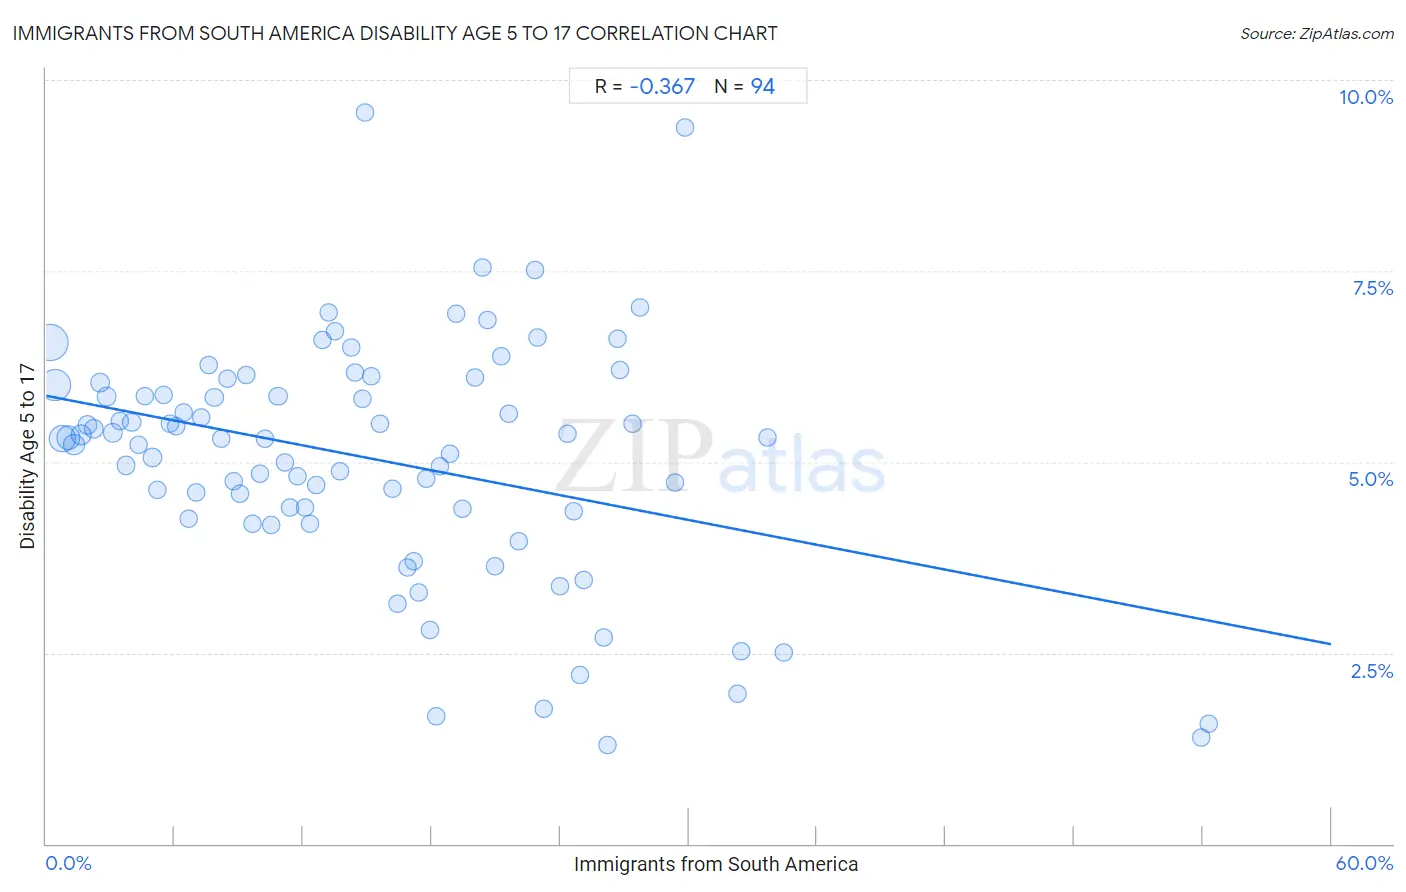
Immigrants from South America Disability Age 5 to 17 Correlation Chart
The statistical analysis conducted on geographies consisting of 479,990,297 people shows a mild negative correlation between the proportion of Immigrants from South America and percentage of population with a disability between the ages 5 and 17 in the United States with a correlation coefficient (R) of -0.367 and weighted average of 5.4%. On average, for every 1% (one percent) increase in Immigrants from South America within a typical geography, there is a decrease of 0.054% in percentage of population with a disability between the ages 5 and 17.
It is essential to understand that the correlation between the percentage of Immigrants from South America and percentage of population with a disability between the ages 5 and 17 does not imply a direct cause-and-effect relationship. It remains uncertain whether the presence of Immigrants from South America influences an upward or downward trend in the level of percentage of population with a disability between the ages 5 and 17 within an area, or if Immigrants from South America simply ended up residing in those areas with higher or lower levels of percentage of population with a disability between the ages 5 and 17 due to other factors.
Demographics Similar to Immigrants from South America by Disability Age 5 to 17
In terms of disability age 5 to 17, the demographic groups most similar to Immigrants from South America are South American (5.4%, a difference of 0.010%), Immigrants (5.4%, a difference of 0.050%), Immigrants from Afghanistan (5.3%, a difference of 0.11%), Cypriot (5.3%, a difference of 0.28%), and Cuban (5.3%, a difference of 0.34%).
| Demographics | Rating | Rank | Disability Age 5 to 17 |
| Immigrants from Latvia | 97.9 /100 | #112 | Exceptional 5.3% |
| Aleuts | 97.8 /100 | #113 | Exceptional 5.3% |
| Immigrants from Northern Europe | 97.8 /100 | #114 | Exceptional 5.3% |
| Cubans | 97.8 /100 | #115 | Exceptional 5.3% |
| Cypriots | 97.7 /100 | #116 | Exceptional 5.3% |
| Immigrants from Afghanistan | 97.4 /100 | #117 | Exceptional 5.3% |
| South Americans | 97.1 /100 | #118 | Exceptional 5.4% |
| Immigrants from South America | 97.1 /100 | #119 | Exceptional 5.4% |
| Immigrants | 97.0 /100 | #120 | Exceptional 5.4% |
| Maltese | 96.0 /100 | #121 | Exceptional 5.4% |
| Chileans | 95.8 /100 | #122 | Exceptional 5.4% |
| Immigrants from Ethiopia | 95.5 /100 | #123 | Exceptional 5.4% |
| Crow | 95.0 /100 | #124 | Exceptional 5.4% |
| Immigrants from Chile | 95.0 /100 | #125 | Exceptional 5.4% |
| New Zealanders | 95.0 /100 | #126 | Exceptional 5.4% |
Immigrants from South America Disability Age 5 to 17 Correlation Summary
| Measurement | Immigrants from South America Data | Disability Age 5 to 17 Data |
| Minimum | 0.15% | 1.3% |
| Maximum | 54.3% | 9.6% |
| Range | 54.1% | 8.3% |
| Mean | 15.2% | 5.0% |
| Median | 14.0% | 5.3% |
| Interquartile 25% (IQ1) | 7.0% | 4.4% |
| Interquartile 75% (IQ3) | 21.6% | 6.0% |
| Interquartile Range (IQR) | 14.6% | 1.6% |
| Standard Deviation (Sample) | 10.6% | 1.6% |
| Standard Deviation (Population) | 10.5% | 1.6% |
Correlation Details
| Immigrants from South America Percentile | Sample Size | Disability Age 5 to 17 |
[ 0.0% - 0.5% ] 0.15% | 140,411,995 | 6.6% |
[ 0.0% - 0.5% ] 0.43% | 102,593,769 | 6.0% |
[ 0.5% - 1.0% ] 0.74% | 67,201,467 | 5.3% |
[ 1.0% - 1.5% ] 1.04% | 43,055,152 | 5.3% |
[ 1.0% - 1.5% ] 1.31% | 23,410,368 | 5.2% |
[ 1.5% - 2.0% ] 1.63% | 20,103,517 | 5.4% |
[ 1.5% - 2.0% ] 1.93% | 10,289,733 | 5.5% |
[ 2.0% - 2.5% ] 2.23% | 8,705,785 | 5.4% |
[ 2.5% - 3.0% ] 2.51% | 7,195,727 | 6.0% |
[ 2.5% - 3.0% ] 2.81% | 4,442,506 | 5.9% |
[ 3.0% - 3.5% ] 3.11% | 5,235,466 | 5.4% |
[ 3.0% - 3.5% ] 3.42% | 3,369,876 | 5.5% |
[ 3.5% - 4.0% ] 3.72% | 3,759,116 | 5.0% |
[ 3.5% - 4.0% ] 4.00% | 2,578,506 | 5.5% |
[ 4.0% - 4.5% ] 4.32% | 2,513,384 | 5.2% |
[ 4.5% - 5.0% ] 4.61% | 1,914,798 | 5.9% |
[ 4.5% - 5.0% ] 4.98% | 9,684,356 | 5.1% |
[ 5.0% - 5.5% ] 5.19% | 2,119,094 | 4.6% |
[ 5.0% - 5.5% ] 5.49% | 1,351,562 | 5.9% |
[ 5.5% - 6.0% ] 5.77% | 1,247,459 | 5.5% |
[ 6.0% - 6.5% ] 6.08% | 951,704 | 5.5% |
[ 6.0% - 6.5% ] 6.40% | 597,971 | 5.7% |
[ 6.5% - 7.0% ] 6.65% | 1,063,907 | 4.3% |
[ 6.5% - 7.0% ] 6.98% | 788,616 | 4.6% |
[ 7.0% - 7.5% ] 7.24% | 644,189 | 5.6% |
[ 7.5% - 8.0% ] 7.56% | 750,569 | 6.3% |
[ 7.5% - 8.0% ] 7.85% | 489,661 | 5.8% |
[ 8.0% - 8.5% ] 8.16% | 677,003 | 5.3% |
[ 8.0% - 8.5% ] 8.45% | 682,354 | 6.1% |
[ 8.5% - 9.0% ] 8.75% | 614,790 | 4.7% |
[ 9.0% - 9.5% ] 9.02% | 475,937 | 4.6% |
[ 9.0% - 9.5% ] 9.36% | 697,739 | 6.1% |
[ 9.5% - 10.0% ] 9.64% | 307,352 | 4.2% |
[ 9.5% - 10.0% ] 9.95% | 575,395 | 4.8% |
[ 10.0% - 10.5% ] 10.24% | 460,392 | 5.3% |
[ 10.5% - 11.0% ] 10.53% | 628,459 | 4.2% |
[ 10.5% - 11.0% ] 10.83% | 598,827 | 5.9% |
[ 11.0% - 11.5% ] 11.13% | 756,179 | 5.0% |
[ 11.0% - 11.5% ] 11.38% | 264,247 | 4.4% |
[ 11.5% - 12.0% ] 11.73% | 171,929 | 4.8% |
[ 12.0% - 12.5% ] 12.07% | 124,757 | 4.4% |
[ 12.0% - 12.5% ] 12.33% | 352,655 | 4.2% |
[ 12.5% - 13.0% ] 12.60% | 75,163 | 4.7% |
[ 12.5% - 13.0% ] 12.88% | 617,922 | 6.6% |
[ 13.0% - 13.5% ] 13.17% | 595,712 | 7.0% |
[ 13.0% - 13.5% ] 13.50% | 406,770 | 6.7% |
[ 13.5% - 14.0% ] 13.74% | 97,519 | 4.9% |
[ 14.0% - 14.5% ] 14.22% | 13,154 | 6.5% |
[ 14.0% - 14.5% ] 14.43% | 178,189 | 6.2% |
[ 14.5% - 15.0% ] 14.74% | 365,719 | 5.8% |
[ 14.5% - 15.0% ] 14.90% | 198,857 | 9.6% |
[ 15.0% - 15.5% ] 15.20% | 55,059 | 6.1% |
[ 15.5% - 16.0% ] 15.59% | 161,299 | 5.5% |
[ 16.0% - 16.5% ] 16.15% | 397,885 | 4.6% |
[ 16.0% - 16.5% ] 16.39% | 197,799 | 3.1% |
[ 16.5% - 17.0% ] 16.86% | 125,326 | 3.6% |
[ 17.0% - 17.5% ] 17.15% | 173,635 | 3.7% |
[ 17.0% - 17.5% ] 17.39% | 143,461 | 3.3% |
[ 17.5% - 18.0% ] 17.72% | 34,922 | 4.8% |
[ 17.5% - 18.0% ] 17.93% | 116,285 | 2.8% |
[ 18.0% - 18.5% ] 18.22% | 13,503 | 1.7% |
[ 18.0% - 18.5% ] 18.41% | 79,484 | 4.9% |
[ 18.5% - 19.0% ] 18.84% | 141,348 | 5.1% |
[ 19.0% - 19.5% ] 19.16% | 199,419 | 6.9% |
[ 19.0% - 19.5% ] 19.42% | 288,403 | 4.4% |
[ 19.5% - 20.0% ] 19.99% | 65,589 | 6.1% |
[ 20.0% - 20.5% ] 20.36% | 33,160 | 7.5% |
[ 20.5% - 21.0% ] 20.62% | 93,099 | 6.9% |
[ 20.5% - 21.0% ] 20.93% | 117,896 | 3.6% |
[ 21.0% - 21.5% ] 21.26% | 69,714 | 6.4% |
[ 21.5% - 22.0% ] 21.59% | 117,157 | 5.6% |
[ 22.0% - 22.5% ] 22.04% | 99,633 | 4.0% |
[ 22.5% - 23.0% ] 22.80% | 89,531 | 7.5% |
[ 22.5% - 23.0% ] 22.94% | 9,176 | 6.6% |
[ 23.0% - 23.5% ] 23.23% | 57,066 | 1.8% |
[ 24.0% - 24.5% ] 24.01% | 17,136 | 3.4% |
[ 24.0% - 24.5% ] 24.32% | 21,935 | 5.4% |
[ 24.5% - 25.0% ] 24.63% | 35,967 | 4.4% |
[ 24.5% - 25.0% ] 24.91% | 15,184 | 2.2% |
[ 25.0% - 25.5% ] 25.12% | 45,457 | 3.5% |
[ 26.0% - 26.5% ] 26.05% | 11,809 | 2.7% |
[ 26.0% - 26.5% ] 26.23% | 42,058 | 1.3% |
[ 26.5% - 27.0% ] 26.68% | 39,621 | 6.6% |
[ 26.5% - 27.0% ] 26.79% | 22,540 | 6.2% |
[ 27.0% - 27.5% ] 27.39% | 16,450 | 5.5% |
[ 27.5% - 28.0% ] 27.70% | 39,067 | 7.0% |
[ 29.0% - 29.5% ] 29.39% | 51,153 | 4.7% |
[ 29.5% - 30.0% ] 29.82% | 23,734 | 9.4% |
[ 32.0% - 32.5% ] 32.25% | 17,450 | 2.0% |
[ 32.0% - 32.5% ] 32.43% | 16,333 | 2.5% |
[ 33.5% - 34.0% ] 33.70% | 99,543 | 5.3% |
[ 34.0% - 34.5% ] 34.45% | 48,096 | 2.5% |
[ 53.5% - 54.0% ] 53.91% | 64,751 | 1.4% |
[ 54.0% - 54.5% ] 54.26% | 74,891 | 1.6% |