Immigrants from Senegal Disability Age 5 to 17

COMPARE

Immigrants from Senegal
Race
Ancestry
AfghanAfricanAlaska NativeAlaskan AthabascanAlbanianAleutAlsatianAmericanApacheArabArapahoArgentineanArmenianAssyrian/Chaldean/SyriacAustralianAustrianBahamianBangladeshiBarbadianBasqueBelgianBelizeanBermudanBhutaneseBlackfeetBolivianBrazilianBritishBritish West IndianBulgarianBurmeseCajunCambodianCanadianCape VerdeanCarpatho RusynCelticCentral AmericanCentral American IndianCherokeeCheyenneChickasawChileanChineseChippewaChoctawColombianColvilleComancheCosta RicanCreeCreekCroatianCrowCubanCypriotCzechCzechoslovakianDanishDelawareDominicanDutchDutch West IndianEastern EuropeanEcuadorianEgyptianEnglishEstonianEthiopianEuropeanFijianFilipinoFinnishFrenchFrench American IndianFrench CanadianGermanGerman RussianGhanaianGreekGuamanian/ChamorroGuatemalanGuyaneseHaitianHmongHonduranHopiHoumaHungarianIcelanderIndian (Asian)IndonesianInupiatIranianIraqiIrishIroquoisIsraeliItalianJamaicanJapaneseJordanianKenyanKiowaKoreanLaotianLatvianLebaneseLiberianLithuanianLumbeeLuxembourgerMacedonianMalaysianMalteseMarshalleseMenomineeMexicanMexican American IndianMongolianMoroccanNative HawaiianNavajoNepaleseNew ZealanderNicaraguanNigerianNorthern EuropeanNorwegianOkinawanOsageOttawaPaiutePakistaniPalestinianPanamanianParaguayanPennsylvania GermanPeruvianPimaPolishPortuguesePotawatomiPuebloPuerto RicanPuget Sound SalishRomanianRussianSalvadoranSamoanScandinavianScotch-IrishScottishSeminoleSenegaleseSerbianShoshoneSierra LeoneanSiouxSlavicSlovakSloveneSomaliSouth AfricanSouth AmericanSouth American IndianSoviet UnionSpaniardSpanishSpanish AmericanSpanish American IndianSri LankanSubsaharan AfricanSudaneseSwedishSwissSyrianTaiwaneseThaiTlingit-HaidaTohono O'OdhamTonganTrinidadian and TobagonianTsimshianTurkishU.S. Virgin IslanderUgandanUkrainianUruguayanUteVenezuelanVietnameseWelshWest IndianYakamaYaquiYugoslavianYumanYup'ikZimbabwean
Immigration
NonimmigrantsImmigrantsAfghanistanAfricaAlbaniaArgentinaArmeniaAsiaAustraliaAustriaBahamasBangladeshBarbadosBelarusBelgiumBelizeBoliviaBosnia and HerzegovinaBrazilBulgariaBurma/MyanmarCabo VerdeCambodiaCameroonCanadaCaribbeanCentral AmericaChileChinaColombiaCongoCosta RicaCroatiaCubaCzechoslovakiaDenmarkDominicaDominican RepublicEastern AfricaEastern AsiaEastern EuropeEcuadorEgyptEl SalvadorEnglandEritreaEthiopiaEuropeFijiFranceGermanyGhanaGreeceGrenadaGuatemalaGuyanaHaitiHondurasHong KongHungaryIndiaIndonesiaIranIraqIrelandIsraelItalyJamaicaJapanJordanKazakhstanKenyaKoreaKuwaitLaosLatin AmericaLatviaLebanonLiberiaLithuaniaMalaysiaMexicoMicronesiaMiddle AfricaMoldovaMoroccoNepalNetherlandsNicaraguaNigeriaNorth AmericaNorth MacedoniaNorthern AfricaNorthern EuropeNorwayOceaniaPakistanPanamaPeruPhilippinesPolandPortugalRomaniaRussiaSaudi ArabiaScotlandSenegalSerbiaSierra LeoneSingaporeSomaliaSouth AfricaSouth AmericaSouth Central AsiaSouth Eastern AsiaSouthern EuropeSpainSri LankaSt. Vincent and the GrenadinesSudanSwedenSwitzerlandSyriaTaiwanThailandTrinidad and TobagoTurkeyUgandaUkraineUruguayUzbekistanVenezuelaVietnamWest IndiesWestern AfricaWestern AsiaWestern EuropeYemenZaireZimbabweAzores
Select to Compare
Race
Ancestry
AfghanAfricanAlaska NativeAlaskan AthabascanAlbanianAleutAlsatianAmericanApacheArabArapahoArgentineanArmenianAssyrian/Chaldean/SyriacAustralianAustrianBahamianBangladeshiBarbadianBasqueBelgianBelizeanBermudanBhutaneseBlackfeetBolivianBrazilianBritishBritish West IndianBulgarianBurmeseCajunCambodianCanadianCape VerdeanCarpatho RusynCelticCentral AmericanCentral American IndianCherokeeCheyenneChickasawChileanChineseChippewaChoctawColombianColvilleComancheCosta RicanCreeCreekCroatianCrowCubanCypriotCzechCzechoslovakianDanishDelawareDominicanDutchDutch West IndianEastern EuropeanEcuadorianEgyptianEnglishEstonianEthiopianEuropeanFijianFilipinoFinnishFrenchFrench American IndianFrench CanadianGermanGerman RussianGhanaianGreekGuamanian/ChamorroGuatemalanGuyaneseHaitianHmongHonduranHopiHoumaHungarianIcelanderIndian (Asian)IndonesianInupiatIranianIraqiIrishIroquoisIsraeliItalianJamaicanJapaneseJordanianKenyanKiowaKoreanLaotianLatvianLebaneseLiberianLithuanianLumbeeLuxembourgerMacedonianMalaysianMalteseMarshalleseMenomineeMexicanMexican American IndianMongolianMoroccanNative HawaiianNavajoNepaleseNew ZealanderNicaraguanNigerianNorthern EuropeanNorwegianOkinawanOsageOttawaPaiutePakistaniPalestinianPanamanianParaguayanPennsylvania GermanPeruvianPimaPolishPortuguesePotawatomiPuebloPuerto RicanPuget Sound SalishRomanianRussianSalvadoranSamoanScandinavianScotch-IrishScottishSeminoleSenegaleseSerbianShoshoneSierra LeoneanSiouxSlavicSlovakSloveneSomaliSouth AfricanSouth AmericanSouth American IndianSoviet UnionSpaniardSpanishSpanish AmericanSpanish American IndianSri LankanSubsaharan AfricanSudaneseSwedishSwissSyrianTaiwaneseThaiTlingit-HaidaTohono O'OdhamTonganTrinidadian and TobagonianTsimshianTurkishU.S. Virgin IslanderUgandanUkrainianUruguayanUteVenezuelanVietnameseWelshWest IndianYakamaYaquiYugoslavianYumanYup'ikZimbabwean
Immigration
NonimmigrantsImmigrantsAfghanistanAfricaAlbaniaArgentinaArmeniaAsiaAustraliaAustriaBahamasBangladeshBarbadosBelarusBelgiumBelizeBoliviaBosnia and HerzegovinaBrazilBulgariaBurma/MyanmarCabo VerdeCambodiaCameroonCanadaCaribbeanCentral AmericaChileChinaColombiaCongoCosta RicaCroatiaCubaCzechoslovakiaDenmarkDominicaDominican RepublicEastern AfricaEastern AsiaEastern EuropeEcuadorEgyptEl SalvadorEnglandEritreaEthiopiaEuropeFijiFranceGermanyGhanaGreeceGrenadaGuatemalaGuyanaHaitiHondurasHong KongHungaryIndiaIndonesiaIranIraqIrelandIsraelItalyJamaicaJapanJordanKazakhstanKenyaKoreaKuwaitLaosLatin AmericaLatviaLebanonLiberiaLithuaniaMalaysiaMexicoMicronesiaMiddle AfricaMoldovaMoroccoNepalNetherlandsNicaraguaNigeriaNorth AmericaNorth MacedoniaNorthern AfricaNorthern EuropeNorwayOceaniaPakistanPanamaPeruPhilippinesPolandPortugalRomaniaRussiaSaudi ArabiaScotlandSerbiaSierra LeoneSingaporeSomaliaSouth AfricaSouth AmericaSouth Central AsiaSouth Eastern AsiaSouthern EuropeSpainSri LankaSt. Vincent and the GrenadinesSudanSwedenSwitzerlandSyriaTaiwanThailandTrinidad and TobagoTurkeyUgandaUkraineUruguayUzbekistanVenezuelaVietnamWest IndiesWestern AfricaWestern AsiaWestern EuropeYemenZaireZimbabweAzores
Disability Age 5 to 17
Income
Poverty
Unemployment
Labor Participation
Family Structure
Vehicle Availability
Education Level
Disability

Immigrants from Senegal Disability Age 5 to 17
Tragic

6.2%
DISABILITY | AGE 5 TO 17
0.0/ 100
METRIC RATING
292nd/ 347
METRIC RANK

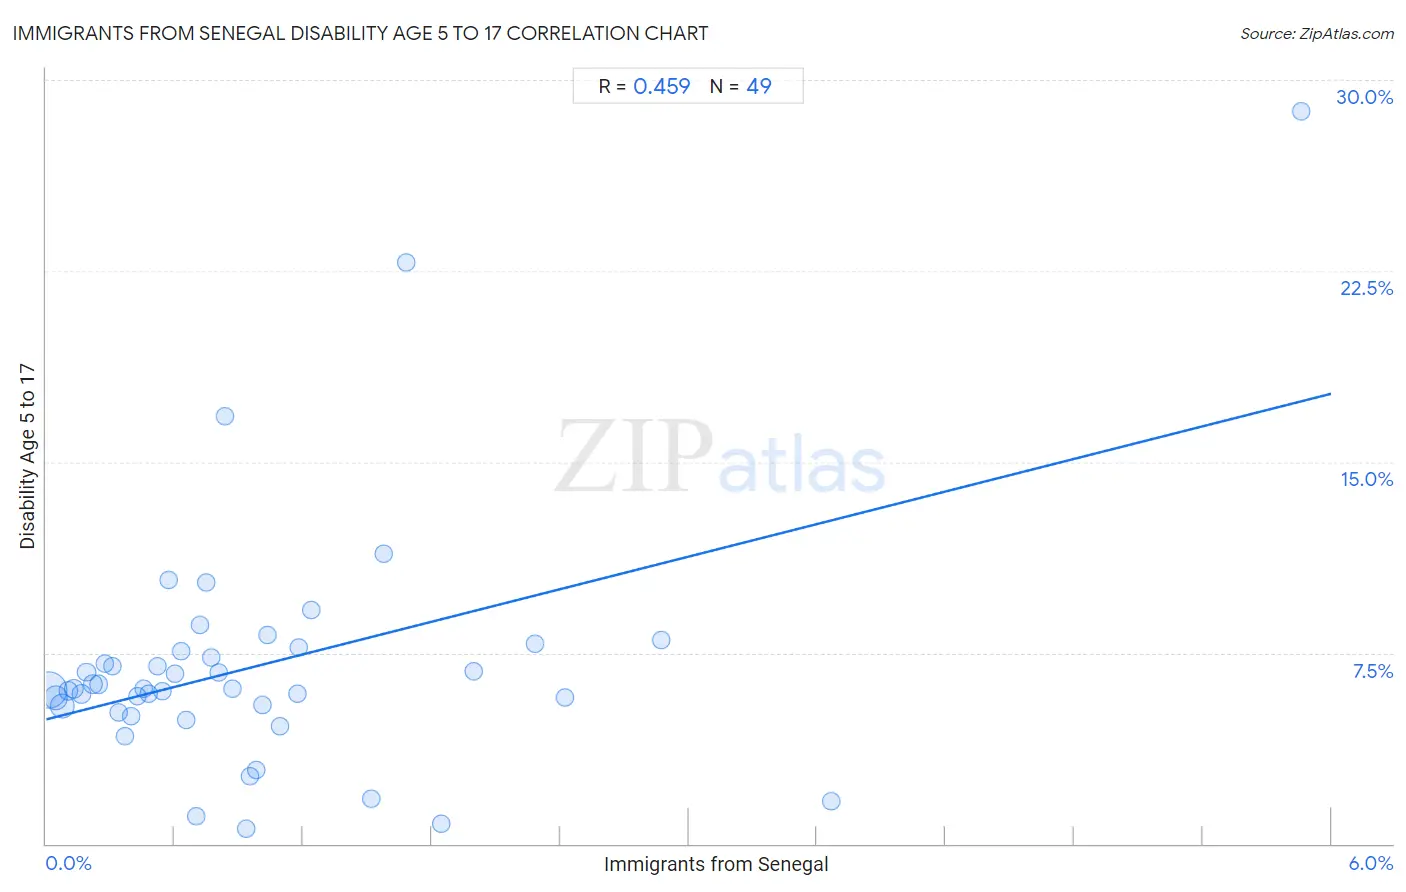
Immigrants from Senegal Disability Age 5 to 17 Correlation Chart

The statistical analysis conducted on geographies consisting of 90,044,083 people shows a moderate positive correlation between the proportion of Immigrants from Senegal and percentage of population with a disability between the ages 5 and 17 in the United States with a correlation coefficient (R) of 0.459 and weighted average of 6.2%. On average, for every 1% (one percent) increase in Immigrants from Senegal within a typical geography, there is an increase of 2.1% in percentage of population with a disability between the ages 5 and 17.
Immigrants from Senegal Disability Age 5 to 17
It is essential to understand that the correlation between the percentage of Immigrants from Senegal and percentage of population with a disability between the ages 5 and 17 does not imply a direct cause-and-effect relationship. It remains uncertain whether the presence of Immigrants from Senegal influences an upward or downward trend in the level of percentage of population with a disability between the ages 5 and 17 within an area, or if Immigrants from Senegal simply ended up residing in those areas with higher or lower levels of percentage of population with a disability between the ages 5 and 17 due to other factors.

Demographics Similar to Immigrants from Senegal by Disability Age 5 to 17

In terms of disability age 5 to 17, the demographic groups most similar to Immigrants from Senegal are Central American Indian (6.2%, a difference of 0.020%), Irish (6.2%, a difference of 0.020%), White/Caucasian (6.2%, a difference of 0.24%), Cree (6.2%, a difference of 0.29%), and Spanish American (6.2%, a difference of 0.32%).
DemographicsRating | RankDisability Age 5 to 17
English
0.0
/100
|
#285
Tragic
6.2%
Colville
0.0
/100
|
#286
Tragic
6.2%
Pima
0.0
/100
|
#287
Tragic
6.2%
Jamaicans
0.0
/100
|
#288
Tragic
6.2%
Yaqui
0.0
/100
|
#289
Tragic
6.2%
Immigrants from Congo
0.0
/100
|
#290
Tragic
6.2%
Whites/Caucasians
0.0
/100
|
#291
Tragic
6.2%
Immigrants from Senegal
0.0
/100
|
#292
Tragic
6.2%
Central American Indians
0.0
/100
|
#293
Tragic
6.2%
Irish
0.0
/100
|
#294
Tragic
6.2%
Cree
0.0
/100
|
#295
Tragic
6.2%
Spanish Americans
0.0
/100
|
#296
Tragic
6.2%
Immigrants from Bahamas
0.0
/100
|
#297
Tragic
6.2%
Lumbee
0.0
/100
|
#298
Tragic
6.2%
Welsh
0.0
/100
|
#299
Tragic
6.3%

Immigrants from Senegal Disability Age 5 to 17 Correlation Summary

MeasurementImmigrants from Senegal DataDisability Age 5 to 17 Data
Minimum0.0099%0.58%
Maximum5.9%28.8%
Range5.9%28.2%
Mean0.99%7.0%
Median0.72%6.1%
Interquartile 25% (IQ1)0.35%5.3%
Interquartile 75% (IQ3)1.2%7.6%
Interquartile Range (IQR)0.83%2.3%
Standard Deviation (Sample)1.0%4.8%
Standard Deviation (Population)1.0%4.8%

Correlation Details

Immigrants from Senegal PercentileSample SizeDisability Age 5 to 17
[
0.0%
-
0.5%
]
0.0099%
44,150,9636.0%
[
0.0%
-
0.5%
]
0.045%
13,485,8895.7%
[
0.0%
-
0.5%
]
0.076%
15,779,5255.4%
[
0.0%
-
0.5%
]
0.10%
4,728,6966.0%
[
0.0%
-
0.5%
]
0.13%
2,630,3396.1%
[
0.0%
-
0.5%
]
0.16%
1,918,6035.9%
[
0.0%
-
0.5%
]
0.19%
1,441,7066.7%
[
0.0%
-
0.5%
]
0.22%
983,1296.3%
[
0.0%
-
0.5%
]
0.25%
354,0976.3%
[
0.0%
-
0.5%
]
0.27%
761,5217.1%
[
0.0%
-
0.5%
]
0.31%
246,5137.0%
[
0.0%
-
0.5%
]
0.34%
385,8145.1%
[
0.0%
-
0.5%
]
0.37%
277,0644.2%
[
0.0%
-
0.5%
]
0.40%
379,7015.0%
[
0.0%
-
0.5%
]
0.43%
189,9885.8%
[
0.0%
-
0.5%
]
0.45%
174,0416.1%
[
0.0%
-
0.5%
]
0.48%
143,4435.9%
[
0.5%
-
1.0%
]
0.52%
154,4247.0%
[
0.5%
-
1.0%
]
0.54%
262,2776.0%
[
0.5%
-
1.0%
]
0.57%
198,69510.4%
[
0.5%
-
1.0%
]
0.60%
123,9486.7%
[
0.5%
-
1.0%
]
0.63%
261,3567.5%
[
0.5%
-
1.0%
]
0.65%
118,3974.9%
[
0.5%
-
1.0%
]
0.70%
32,5041.1%
[
0.5%
-
1.0%
]
0.72%
154,2378.6%
[
0.5%
-
1.0%
]
0.74%
90,62310.2%
[
0.5%
-
1.0%
]
0.77%
36,4487.3%
[
0.5%
-
1.0%
]
0.80%
124,5046.7%
[
0.5%
-
1.0%
]
0.84%
10,52716.8%
[
0.5%
-
1.0%
]
0.87%
80,1596.1%
[
0.5%
-
1.0%
]
0.93%
5,8840.58%
[
0.5%
-
1.0%
]
0.95%
63,1042.6%
[
0.5%
-
1.0%
]
0.98%
15,8662.9%
[
1.0%
-
1.5%
]
1.01%
63,9385.5%
[
1.0%
-
1.5%
]
1.03%
16,0718.2%
[
1.0%
-
1.5%
]
1.09%
21,9374.6%
[
1.0%
-
1.5%
]
1.17%
53,0125.9%
[
1.0%
-
1.5%
]
1.18%
20,9037.7%
[
1.0%
-
1.5%
]
1.24%
38,2359.2%
[
1.5%
-
2.0%
]
1.52%
4,0241.8%
[
1.5%
-
2.0%
]
1.57%
19,06911.4%
[
1.5%
-
2.0%
]
1.68%
3,57522.8%
[
1.5%
-
2.0%
]
1.84%
3,3650.80%
[
1.5%
-
2.0%
]
2.00%
13,3236.8%
[
2.0%
-
2.5%
]
2.28%
8767.9%
[
2.0%
-
2.5%
]
2.42%
10,9915.7%
[
2.5%
-
3.0%
]
2.87%
4,4938.0%
[
3.5%
-
4.0%
]
3.67%
1,9361.7%
[
5.5%
-
6.0%
]
5.86%
4,35028.8%