Iroquois Disability Age 5 to 17

COMPARE

Iroquois
Race
Ancestry
AfghanAfricanAlaska NativeAlaskan AthabascanAlbanianAleutAlsatianAmericanApacheArabArapahoArgentineanArmenianAssyrian/Chaldean/SyriacAustralianAustrianBahamianBangladeshiBarbadianBasqueBelgianBelizeanBermudanBhutaneseBlackfeetBolivianBrazilianBritishBritish West IndianBulgarianBurmeseCajunCambodianCanadianCape VerdeanCarpatho RusynCelticCentral AmericanCentral American IndianCherokeeCheyenneChickasawChileanChineseChippewaChoctawColombianColvilleComancheCosta RicanCreeCreekCroatianCrowCubanCypriotCzechCzechoslovakianDanishDelawareDominicanDutchDutch West IndianEastern EuropeanEcuadorianEgyptianEnglishEstonianEthiopianEuropeanFijianFilipinoFinnishFrenchFrench American IndianFrench CanadianGermanGerman RussianGhanaianGreekGuamanian/ChamorroGuatemalanGuyaneseHaitianHmongHonduranHopiHoumaHungarianIcelanderIndian (Asian)IndonesianInupiatIranianIraqiIrishIroquoisIsraeliItalianJamaicanJapaneseJordanianKenyanKiowaKoreanLaotianLatvianLebaneseLiberianLithuanianLumbeeLuxembourgerMacedonianMalaysianMalteseMarshalleseMenomineeMexicanMexican American IndianMongolianMoroccanNative HawaiianNavajoNepaleseNew ZealanderNicaraguanNigerianNorthern EuropeanNorwegianOkinawanOsageOttawaPaiutePakistaniPalestinianPanamanianParaguayanPennsylvania GermanPeruvianPimaPolishPortuguesePotawatomiPuebloPuerto RicanPuget Sound SalishRomanianRussianSalvadoranSamoanScandinavianScotch-IrishScottishSeminoleSenegaleseSerbianShoshoneSierra LeoneanSiouxSlavicSlovakSloveneSomaliSouth AfricanSouth AmericanSouth American IndianSoviet UnionSpaniardSpanishSpanish AmericanSpanish American IndianSri LankanSubsaharan AfricanSudaneseSwedishSwissSyrianTaiwaneseThaiTlingit-HaidaTohono O'OdhamTonganTrinidadian and TobagonianTsimshianTurkishU.S. Virgin IslanderUgandanUkrainianUruguayanUteVenezuelanVietnameseWelshWest IndianYakamaYaquiYugoslavianYumanYup'ikZimbabwean
Immigration
NonimmigrantsImmigrantsAfghanistanAfricaAlbaniaArgentinaArmeniaAsiaAustraliaAustriaBahamasBangladeshBarbadosBelarusBelgiumBelizeBoliviaBosnia and HerzegovinaBrazilBulgariaBurma/MyanmarCabo VerdeCambodiaCameroonCanadaCaribbeanCentral AmericaChileChinaColombiaCongoCosta RicaCroatiaCubaCzechoslovakiaDenmarkDominicaDominican RepublicEastern AfricaEastern AsiaEastern EuropeEcuadorEgyptEl SalvadorEnglandEritreaEthiopiaEuropeFijiFranceGermanyGhanaGreeceGrenadaGuatemalaGuyanaHaitiHondurasHong KongHungaryIndiaIndonesiaIranIraqIrelandIsraelItalyJamaicaJapanJordanKazakhstanKenyaKoreaKuwaitLaosLatin AmericaLatviaLebanonLiberiaLithuaniaMalaysiaMexicoMicronesiaMiddle AfricaMoldovaMoroccoNepalNetherlandsNicaraguaNigeriaNorth AmericaNorth MacedoniaNorthern AfricaNorthern EuropeNorwayOceaniaPakistanPanamaPeruPhilippinesPolandPortugalRomaniaRussiaSaudi ArabiaScotlandSenegalSerbiaSierra LeoneSingaporeSomaliaSouth AfricaSouth AmericaSouth Central AsiaSouth Eastern AsiaSouthern EuropeSpainSri LankaSt. Vincent and the GrenadinesSudanSwedenSwitzerlandSyriaTaiwanThailandTrinidad and TobagoTurkeyUgandaUkraineUruguayUzbekistanVenezuelaVietnamWest IndiesWestern AfricaWestern AsiaWestern EuropeYemenZaireZimbabweAzores
Select to Compare
Race
Ancestry
AfghanAfricanAlaska NativeAlaskan AthabascanAlbanianAleutAlsatianAmericanApacheArabArapahoArgentineanArmenianAssyrian/Chaldean/SyriacAustralianAustrianBahamianBangladeshiBarbadianBasqueBelgianBelizeanBermudanBhutaneseBlackfeetBolivianBrazilianBritishBritish West IndianBulgarianBurmeseCajunCambodianCanadianCape VerdeanCarpatho RusynCelticCentral AmericanCentral American IndianCherokeeCheyenneChickasawChileanChineseChippewaChoctawColombianColvilleComancheCosta RicanCreeCreekCroatianCrowCubanCypriotCzechCzechoslovakianDanishDelawareDominicanDutchDutch West IndianEastern EuropeanEcuadorianEgyptianEnglishEstonianEthiopianEuropeanFijianFilipinoFinnishFrenchFrench American IndianFrench CanadianGermanGerman RussianGhanaianGreekGuamanian/ChamorroGuatemalanGuyaneseHaitianHmongHonduranHopiHoumaHungarianIcelanderIndian (Asian)IndonesianInupiatIranianIraqiIrishIsraeliItalianJamaicanJapaneseJordanianKenyanKiowaKoreanLaotianLatvianLebaneseLiberianLithuanianLumbeeLuxembourgerMacedonianMalaysianMalteseMarshalleseMenomineeMexicanMexican American IndianMongolianMoroccanNative HawaiianNavajoNepaleseNew ZealanderNicaraguanNigerianNorthern EuropeanNorwegianOkinawanOsageOttawaPaiutePakistaniPalestinianPanamanianParaguayanPennsylvania GermanPeruvianPimaPolishPortuguesePotawatomiPuebloPuerto RicanPuget Sound SalishRomanianRussianSalvadoranSamoanScandinavianScotch-IrishScottishSeminoleSenegaleseSerbianShoshoneSierra LeoneanSiouxSlavicSlovakSloveneSomaliSouth AfricanSouth AmericanSouth American IndianSoviet UnionSpaniardSpanishSpanish AmericanSpanish American IndianSri LankanSubsaharan AfricanSudaneseSwedishSwissSyrianTaiwaneseThaiTlingit-HaidaTohono O'OdhamTonganTrinidadian and TobagonianTsimshianTurkishU.S. Virgin IslanderUgandanUkrainianUruguayanUteVenezuelanVietnameseWelshWest IndianYakamaYaquiYugoslavianYumanYup'ikZimbabwean
Immigration
NonimmigrantsImmigrantsAfghanistanAfricaAlbaniaArgentinaArmeniaAsiaAustraliaAustriaBahamasBangladeshBarbadosBelarusBelgiumBelizeBoliviaBosnia and HerzegovinaBrazilBulgariaBurma/MyanmarCabo VerdeCambodiaCameroonCanadaCaribbeanCentral AmericaChileChinaColombiaCongoCosta RicaCroatiaCubaCzechoslovakiaDenmarkDominicaDominican RepublicEastern AfricaEastern AsiaEastern EuropeEcuadorEgyptEl SalvadorEnglandEritreaEthiopiaEuropeFijiFranceGermanyGhanaGreeceGrenadaGuatemalaGuyanaHaitiHondurasHong KongHungaryIndiaIndonesiaIranIraqIrelandIsraelItalyJamaicaJapanJordanKazakhstanKenyaKoreaKuwaitLaosLatin AmericaLatviaLebanonLiberiaLithuaniaMalaysiaMexicoMicronesiaMiddle AfricaMoldovaMoroccoNepalNetherlandsNicaraguaNigeriaNorth AmericaNorth MacedoniaNorthern AfricaNorthern EuropeNorwayOceaniaPakistanPanamaPeruPhilippinesPolandPortugalRomaniaRussiaSaudi ArabiaScotlandSenegalSerbiaSierra LeoneSingaporeSomaliaSouth AfricaSouth AmericaSouth Central AsiaSouth Eastern AsiaSouthern EuropeSpainSri LankaSt. Vincent and the GrenadinesSudanSwedenSwitzerlandSyriaTaiwanThailandTrinidad and TobagoTurkeyUgandaUkraineUruguayUzbekistanVenezuelaVietnamWest IndiesWestern AfricaWestern AsiaWestern EuropeYemenZaireZimbabweAzores
Disability Age 5 to 17
Income
Poverty
Unemployment
Labor Participation
Family Structure
Vehicle Availability
Education Level
Disability

Iroquois Disability Age 5 to 17
Tragic

6.9%
DISABILITY | AGE 5 TO 17
0.0/ 100
METRIC RATING
338th/ 347
METRIC RANK

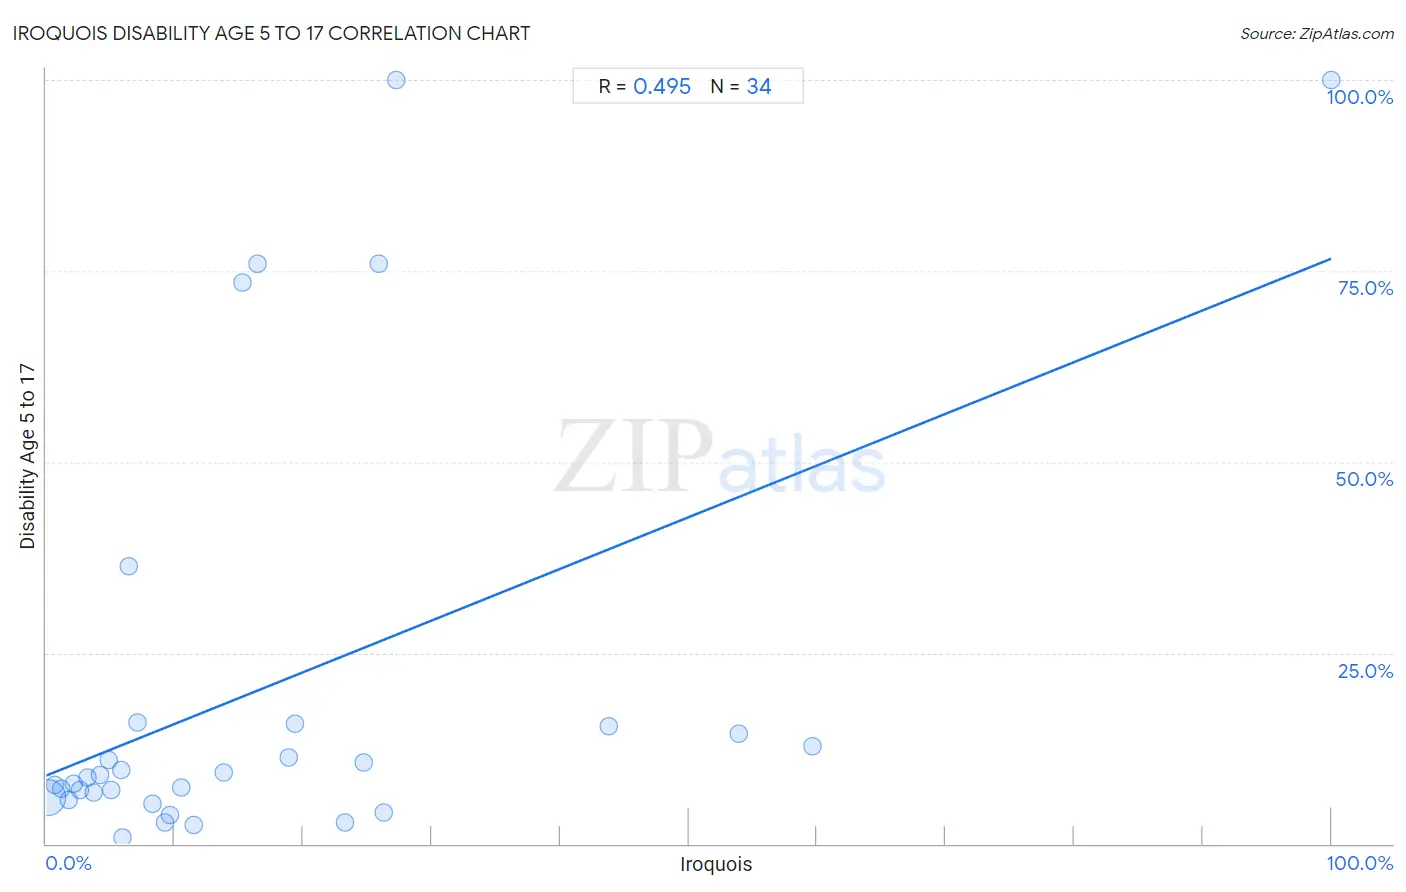
Iroquois Disability Age 5 to 17 Correlation Chart

The statistical analysis conducted on geographies consisting of 206,302,830 people shows a moderate positive correlation between the proportion of Iroquois and percentage of population with a disability between the ages 5 and 17 in the United States with a correlation coefficient (R) of 0.495 and weighted average of 6.9%. On average, for every 1% (one percent) increase in Iroquois within a typical geography, there is an increase of 0.68% in percentage of population with a disability between the ages 5 and 17.
Iroquois Disability Age 5 to 17
It is essential to understand that the correlation between the percentage of Iroquois and percentage of population with a disability between the ages 5 and 17 does not imply a direct cause-and-effect relationship. It remains uncertain whether the presence of Iroquois influences an upward or downward trend in the level of percentage of population with a disability between the ages 5 and 17 within an area, or if Iroquois simply ended up residing in those areas with higher or lower levels of percentage of population with a disability between the ages 5 and 17 due to other factors.

Demographics Similar to Iroquois by Disability Age 5 to 17

In terms of disability age 5 to 17, the demographic groups most similar to Iroquois are Creek (6.9%, a difference of 0.24%), Choctaw (6.9%, a difference of 0.33%), Cherokee (6.9%, a difference of 0.59%), Chickasaw (6.8%, a difference of 0.68%), and Cape Verdean (7.0%, a difference of 1.1%).
DemographicsRating | RankDisability Age 5 to 17
French Canadians
0.0
/100
|
#331
Tragic
6.7%
Immigrants from the Azores
0.0
/100
|
#332
Tragic
6.7%
Blacks/African Americans
0.0
/100
|
#333
Tragic
6.8%
Seminole
0.0
/100
|
#334
Tragic
6.8%
Ottawa
0.0
/100
|
#335
Tragic
6.8%
Chickasaw
0.0
/100
|
#336
Tragic
6.8%
Creek
0.0
/100
|
#337
Tragic
6.9%
Iroquois
0.0
/100
|
#338
Tragic
6.9%
Choctaw
0.0
/100
|
#339
Tragic
6.9%
Cherokee
0.0
/100
|
#340
Tragic
6.9%
Cape Verdeans
0.0
/100
|
#341
Tragic
7.0%
Chippewa
0.0
/100
|
#342
Tragic
7.1%
Immigrants from Cabo Verde
0.0
/100
|
#343
Tragic
7.1%
Cajuns
0.0
/100
|
#344
Tragic
7.2%
Tsimshian
0.0
/100
|
#345
Tragic
7.9%

Iroquois Disability Age 5 to 17 Correlation Summary

MeasurementIroquois DataDisability Age 5 to 17 Data
Minimum0.053%0.85%
Maximum100.0%100.0%
Range99.9%99.1%
Mean16.8%20.3%
Median9.5%8.9%
Interquartile 25% (IQ1)4.1%6.0%
Interquartile 75% (IQ3)23.3%15.4%
Interquartile Range (IQR)19.1%9.3%
Standard Deviation (Sample)20.7%28.4%
Standard Deviation (Population)20.4%28.0%

Correlation Details

Iroquois PercentileSample SizeDisability Age 5 to 17
[
0.0%
-
0.5%
]
0.053%
202,364,3116.0%
[
0.5%
-
1.0%
]
0.65%
2,732,0107.7%
[
1.0%
-
1.5%
]
1.21%
527,5637.2%
[
1.5%
-
2.0%
]
1.72%
191,7455.7%
[
2.0%
-
2.5%
]
2.13%
286,3627.8%
[
2.5%
-
3.0%
]
2.59%
29,5607.1%
[
3.0%
-
3.5%
]
3.19%
49,1028.7%
[
3.5%
-
4.0%
]
3.66%
35,8926.8%
[
4.0%
-
4.5%
]
4.14%
8,8669.0%
[
4.5%
-
5.0%
]
4.84%
5,10411.0%
[
5.0%
-
5.5%
]
5.03%
1,7117.1%
[
5.5%
-
6.0%
]
5.80%
1,9139.6%
[
5.5%
-
6.0%
]
5.94%
10,1300.85%
[
6.0%
-
6.5%
]
6.45%
9336.4%
[
7.0%
-
7.5%
]
7.08%
1,56815.8%
[
8.0%
-
8.5%
]
8.25%
1,3455.2%
[
9.0%
-
9.5%
]
9.28%
6,1862.9%
[
9.5%
-
10.0%
]
9.67%
12,3633.8%
[
10.0%
-
10.5%
]
10.46%
4,3677.4%
[
11.0%
-
11.5%
]
11.49%
5052.5%
[
13.5%
-
14.0%
]
13.82%
1,9769.3%
[
15.0%
-
15.5%
]
15.32%
23573.5%
[
16.0%
-
16.5%
]
16.39%
1,03776.0%
[
18.5%
-
19.0%
]
18.85%
12,80511.2%
[
19.0%
-
19.5%
]
19.37%
50615.8%
[
23.0%
-
23.5%
]
23.26%
2,2182.8%
[
24.5%
-
25.0%
]
24.74%
2,91010.7%
[
25.5%
-
26.0%
]
25.91%
65676.0%
[
26.0%
-
26.5%
]
26.31%
1,6004.1%
[
27.0%
-
27.5%
]
27.27%
132100.0%
[
43.5%
-
44.0%
]
43.75%
12815.4%
[
53.5%
-
54.0%
]
53.93%
4,19614.5%
[
59.5%
-
60.0%
]
59.63%
3,66912.8%
[
99.5%
-
100.0%
]
100.00%
66100.0%