Immigrants from Sudan Disability Age 5 to 17

COMPARE

Immigrants from Sudan
Race
Ancestry
AfghanAfricanAlaska NativeAlaskan AthabascanAlbanianAleutAlsatianAmericanApacheArabArapahoArgentineanArmenianAssyrian/Chaldean/SyriacAustralianAustrianBahamianBangladeshiBarbadianBasqueBelgianBelizeanBermudanBhutaneseBlackfeetBolivianBrazilianBritishBritish West IndianBulgarianBurmeseCajunCambodianCanadianCape VerdeanCarpatho RusynCelticCentral AmericanCentral American IndianCherokeeCheyenneChickasawChileanChineseChippewaChoctawColombianColvilleComancheCosta RicanCreeCreekCroatianCrowCubanCypriotCzechCzechoslovakianDanishDelawareDominicanDutchDutch West IndianEastern EuropeanEcuadorianEgyptianEnglishEstonianEthiopianEuropeanFijianFilipinoFinnishFrenchFrench American IndianFrench CanadianGermanGerman RussianGhanaianGreekGuamanian/ChamorroGuatemalanGuyaneseHaitianHmongHonduranHopiHoumaHungarianIcelanderIndian (Asian)IndonesianInupiatIranianIraqiIrishIroquoisIsraeliItalianJamaicanJapaneseJordanianKenyanKiowaKoreanLaotianLatvianLebaneseLiberianLithuanianLumbeeLuxembourgerMacedonianMalaysianMalteseMarshalleseMenomineeMexicanMexican American IndianMongolianMoroccanNative HawaiianNavajoNepaleseNew ZealanderNicaraguanNigerianNorthern EuropeanNorwegianOkinawanOsageOttawaPaiutePakistaniPalestinianPanamanianParaguayanPennsylvania GermanPeruvianPimaPolishPortuguesePotawatomiPuebloPuerto RicanPuget Sound SalishRomanianRussianSalvadoranSamoanScandinavianScotch-IrishScottishSeminoleSenegaleseSerbianShoshoneSierra LeoneanSiouxSlavicSlovakSloveneSomaliSouth AfricanSouth AmericanSouth American IndianSoviet UnionSpaniardSpanishSpanish AmericanSpanish American IndianSri LankanSubsaharan AfricanSudaneseSwedishSwissSyrianTaiwaneseThaiTlingit-HaidaTohono O'OdhamTonganTrinidadian and TobagonianTsimshianTurkishU.S. Virgin IslanderUgandanUkrainianUruguayanUteVenezuelanVietnameseWelshWest IndianYakamaYaquiYugoslavianYumanYup'ikZimbabwean
Immigration
NonimmigrantsImmigrantsAfghanistanAfricaAlbaniaArgentinaArmeniaAsiaAustraliaAustriaBahamasBangladeshBarbadosBelarusBelgiumBelizeBoliviaBosnia and HerzegovinaBrazilBulgariaBurma/MyanmarCabo VerdeCambodiaCameroonCanadaCaribbeanCentral AmericaChileChinaColombiaCongoCosta RicaCroatiaCubaCzechoslovakiaDenmarkDominicaDominican RepublicEastern AfricaEastern AsiaEastern EuropeEcuadorEgyptEl SalvadorEnglandEritreaEthiopiaEuropeFijiFranceGermanyGhanaGreeceGrenadaGuatemalaGuyanaHaitiHondurasHong KongHungaryIndiaIndonesiaIranIraqIrelandIsraelItalyJamaicaJapanJordanKazakhstanKenyaKoreaKuwaitLaosLatin AmericaLatviaLebanonLiberiaLithuaniaMalaysiaMexicoMicronesiaMiddle AfricaMoldovaMoroccoNepalNetherlandsNicaraguaNigeriaNorth AmericaNorth MacedoniaNorthern AfricaNorthern EuropeNorwayOceaniaPakistanPanamaPeruPhilippinesPolandPortugalRomaniaRussiaSaudi ArabiaScotlandSenegalSerbiaSierra LeoneSingaporeSomaliaSouth AfricaSouth AmericaSouth Central AsiaSouth Eastern AsiaSouthern EuropeSpainSri LankaSt. Vincent and the GrenadinesSudanSwedenSwitzerlandSyriaTaiwanThailandTrinidad and TobagoTurkeyUgandaUkraineUruguayUzbekistanVenezuelaVietnamWest IndiesWestern AfricaWestern AsiaWestern EuropeYemenZaireZimbabweAzores
Select to Compare
Race
Ancestry
AfghanAfricanAlaska NativeAlaskan AthabascanAlbanianAleutAlsatianAmericanApacheArabArapahoArgentineanArmenianAssyrian/Chaldean/SyriacAustralianAustrianBahamianBangladeshiBarbadianBasqueBelgianBelizeanBermudanBhutaneseBlackfeetBolivianBrazilianBritishBritish West IndianBulgarianBurmeseCajunCambodianCanadianCape VerdeanCarpatho RusynCelticCentral AmericanCentral American IndianCherokeeCheyenneChickasawChileanChineseChippewaChoctawColombianColvilleComancheCosta RicanCreeCreekCroatianCrowCubanCypriotCzechCzechoslovakianDanishDelawareDominicanDutchDutch West IndianEastern EuropeanEcuadorianEgyptianEnglishEstonianEthiopianEuropeanFijianFilipinoFinnishFrenchFrench American IndianFrench CanadianGermanGerman RussianGhanaianGreekGuamanian/ChamorroGuatemalanGuyaneseHaitianHmongHonduranHopiHoumaHungarianIcelanderIndian (Asian)IndonesianInupiatIranianIraqiIrishIroquoisIsraeliItalianJamaicanJapaneseJordanianKenyanKiowaKoreanLaotianLatvianLebaneseLiberianLithuanianLumbeeLuxembourgerMacedonianMalaysianMalteseMarshalleseMenomineeMexicanMexican American IndianMongolianMoroccanNative HawaiianNavajoNepaleseNew ZealanderNicaraguanNigerianNorthern EuropeanNorwegianOkinawanOsageOttawaPaiutePakistaniPalestinianPanamanianParaguayanPennsylvania GermanPeruvianPimaPolishPortuguesePotawatomiPuebloPuerto RicanPuget Sound SalishRomanianRussianSalvadoranSamoanScandinavianScotch-IrishScottishSeminoleSenegaleseSerbianShoshoneSierra LeoneanSiouxSlavicSlovakSloveneSomaliSouth AfricanSouth AmericanSouth American IndianSoviet UnionSpaniardSpanishSpanish AmericanSpanish American IndianSri LankanSubsaharan AfricanSudaneseSwedishSwissSyrianTaiwaneseThaiTlingit-HaidaTohono O'OdhamTonganTrinidadian and TobagonianTsimshianTurkishU.S. Virgin IslanderUgandanUkrainianUruguayanUteVenezuelanVietnameseWelshWest IndianYakamaYaquiYugoslavianYumanYup'ikZimbabwean
Immigration
NonimmigrantsImmigrantsAfghanistanAfricaAlbaniaArgentinaArmeniaAsiaAustraliaAustriaBahamasBangladeshBarbadosBelarusBelgiumBelizeBoliviaBosnia and HerzegovinaBrazilBulgariaBurma/MyanmarCabo VerdeCambodiaCameroonCanadaCaribbeanCentral AmericaChileChinaColombiaCongoCosta RicaCroatiaCubaCzechoslovakiaDenmarkDominicaDominican RepublicEastern AfricaEastern AsiaEastern EuropeEcuadorEgyptEl SalvadorEnglandEritreaEthiopiaEuropeFijiFranceGermanyGhanaGreeceGrenadaGuatemalaGuyanaHaitiHondurasHong KongHungaryIndiaIndonesiaIranIraqIrelandIsraelItalyJamaicaJapanJordanKazakhstanKenyaKoreaKuwaitLaosLatin AmericaLatviaLebanonLiberiaLithuaniaMalaysiaMexicoMicronesiaMiddle AfricaMoldovaMoroccoNepalNetherlandsNicaraguaNigeriaNorth AmericaNorth MacedoniaNorthern AfricaNorthern EuropeNorwayOceaniaPakistanPanamaPeruPhilippinesPolandPortugalRomaniaRussiaSaudi ArabiaScotlandSenegalSerbiaSierra LeoneSingaporeSomaliaSouth AfricaSouth AmericaSouth Central AsiaSouth Eastern AsiaSouthern EuropeSpainSri LankaSt. Vincent and the GrenadinesSwedenSwitzerlandSyriaTaiwanThailandTrinidad and TobagoTurkeyUgandaUkraineUruguayUzbekistanVenezuelaVietnamWest IndiesWestern AfricaWestern AsiaWestern EuropeYemenZaireZimbabweAzores
Disability Age 5 to 17
Income
Poverty
Unemployment
Labor Participation
Family Structure
Vehicle Availability
Education Level
Disability

Immigrants from Sudan Disability Age 5 to 17
Tragic

5.8%
DISABILITY | AGE 5 TO 17
6.7/ 100
METRIC RATING
222nd/ 347
METRIC RANK

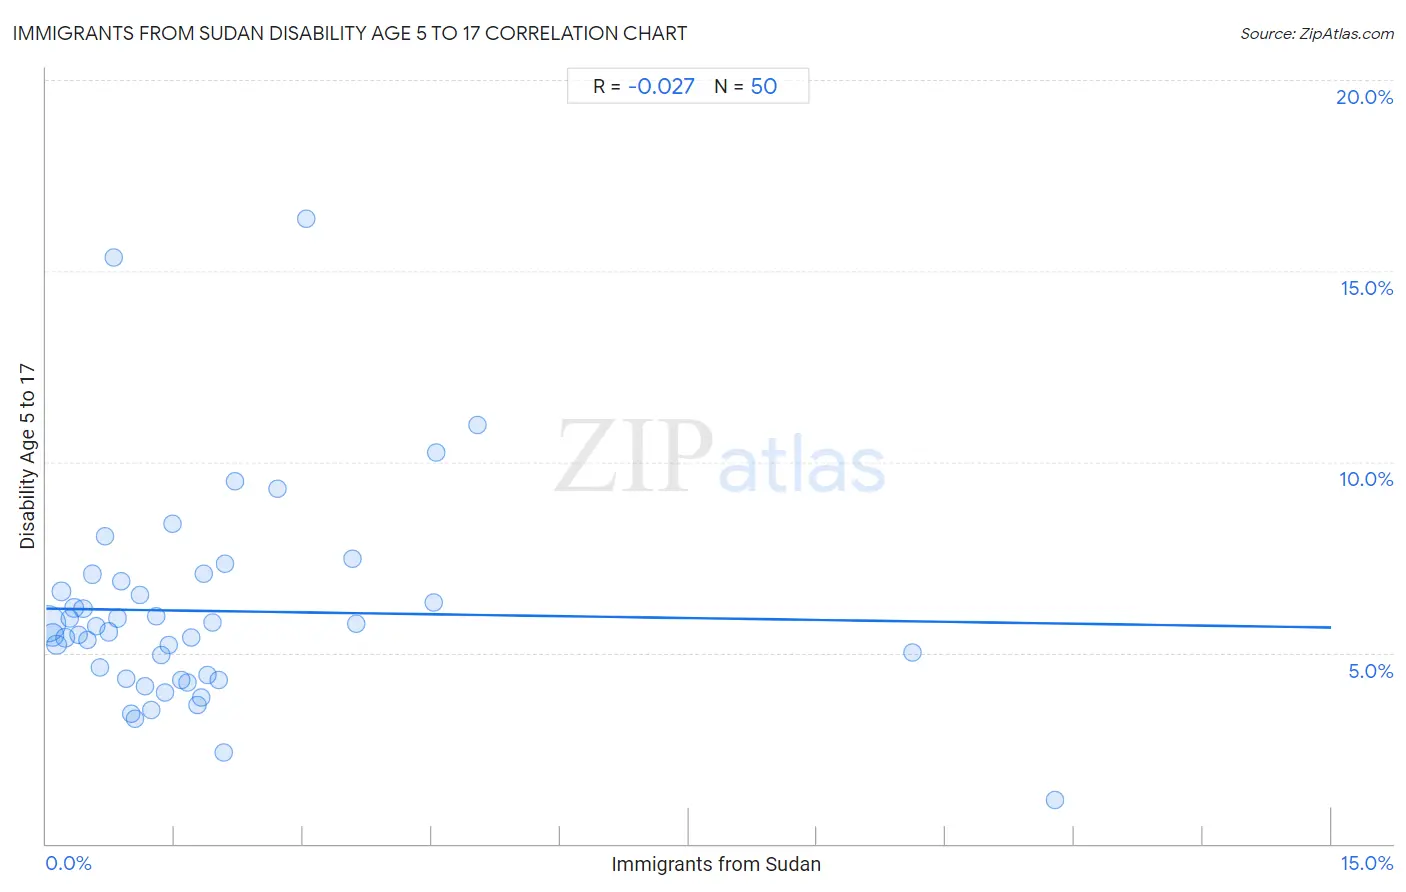
Immigrants from Sudan Disability Age 5 to 17 Correlation Chart

The statistical analysis conducted on geographies consisting of 118,823,515 people shows no correlation between the proportion of Immigrants from Sudan and percentage of population with a disability between the ages 5 and 17 in the United States with a correlation coefficient (R) of -0.027 and weighted average of 5.8%. On average, for every 1% (one percent) increase in Immigrants from Sudan within a typical geography, there is a decrease of 0.033% in percentage of population with a disability between the ages 5 and 17.
Immigrants from Sudan Disability Age 5 to 17
It is essential to understand that the correlation between the percentage of Immigrants from Sudan and percentage of population with a disability between the ages 5 and 17 does not imply a direct cause-and-effect relationship. It remains uncertain whether the presence of Immigrants from Sudan influences an upward or downward trend in the level of percentage of population with a disability between the ages 5 and 17 within an area, or if Immigrants from Sudan simply ended up residing in those areas with higher or lower levels of percentage of population with a disability between the ages 5 and 17 due to other factors.

Demographics Similar to Immigrants from Sudan by Disability Age 5 to 17

In terms of disability age 5 to 17, the demographic groups most similar to Immigrants from Sudan are Lithuanian (5.8%, a difference of 0.0%), Belgian (5.8%, a difference of 0.040%), Sierra Leonean (5.8%, a difference of 0.060%), Immigrants from Sierra Leone (5.8%, a difference of 0.070%), and Czech (5.8%, a difference of 0.12%).
DemographicsRating | RankDisability Age 5 to 17
Swedes
8.1
/100
|
#215
Tragic
5.8%
Nigerians
7.5
/100
|
#216
Tragic
5.8%
Czechs
7.4
/100
|
#217
Tragic
5.8%
Immigrants from Sierra Leone
7.1
/100
|
#218
Tragic
5.8%
Sierra Leoneans
7.0
/100
|
#219
Tragic
5.8%
Belgians
6.9
/100
|
#220
Tragic
5.8%
Lithuanians
6.7
/100
|
#221
Tragic
5.8%
Immigrants from Sudan
6.7
/100
|
#222
Tragic
5.8%
Alsatians
6.0
/100
|
#223
Tragic
5.8%
Mexicans
5.7
/100
|
#224
Tragic
5.8%
Guamanians/Chamorros
5.6
/100
|
#225
Tragic
5.8%
British West Indians
5.4
/100
|
#226
Tragic
5.8%
Swiss
5.1
/100
|
#227
Tragic
5.8%
Haitians
4.8
/100
|
#228
Tragic
5.8%
Bangladeshis
4.8
/100
|
#229
Tragic
5.8%

Immigrants from Sudan Disability Age 5 to 17 Correlation Summary

MeasurementImmigrants from Sudan DataDisability Age 5 to 17 Data
Minimum0.020%1.2%
Maximum11.8%16.4%
Range11.8%15.2%
Mean1.9%6.1%
Median1.3%5.6%
Interquartile 25% (IQ1)0.63%4.3%
Interquartile 75% (IQ3)2.0%6.9%
Interquartile Range (IQR)1.4%2.6%
Standard Deviation (Sample)2.2%2.8%
Standard Deviation (Population)2.2%2.7%

Correlation Details

Immigrants from Sudan PercentileSample SizeDisability Age 5 to 17
[
0.0%
-
0.5%
]
0.020%
75,050,7575.8%
[
0.0%
-
0.5%
]
0.071%
20,316,5035.5%
[
0.0%
-
0.5%
]
0.12%
7,189,9365.2%
[
0.0%
-
0.5%
]
0.17%
3,769,3386.6%
[
0.0%
-
0.5%
]
0.23%
3,072,5285.4%
[
0.0%
-
0.5%
]
0.28%
1,986,8955.9%
[
0.0%
-
0.5%
]
0.33%
1,521,2236.2%
[
0.0%
-
0.5%
]
0.38%
1,259,7535.5%
[
0.0%
-
0.5%
]
0.43%
628,8356.1%
[
0.0%
-
0.5%
]
0.48%
544,1355.3%
[
0.5%
-
1.0%
]
0.54%
1,024,8787.1%
[
0.5%
-
1.0%
]
0.58%
292,3925.7%
[
0.5%
-
1.0%
]
0.63%
494,0914.6%
[
0.5%
-
1.0%
]
0.68%
115,0578.1%
[
0.5%
-
1.0%
]
0.73%
209,2385.5%
[
0.5%
-
1.0%
]
0.78%
1,66015.4%
[
0.5%
-
1.0%
]
0.84%
200,9025.9%
[
0.5%
-
1.0%
]
0.88%
60,0086.9%
[
0.5%
-
1.0%
]
0.93%
156,3534.3%
[
0.5%
-
1.0%
]
0.99%
91,7063.4%
[
1.0%
-
1.5%
]
1.03%
36,3733.3%
[
1.0%
-
1.5%
]
1.09%
99,0506.5%
[
1.0%
-
1.5%
]
1.15%
32,2734.1%
[
1.0%
-
1.5%
]
1.23%
75,8273.5%
[
1.0%
-
1.5%
]
1.28%
75,8776.0%
[
1.0%
-
1.5%
]
1.34%
60,3085.0%
[
1.0%
-
1.5%
]
1.39%
14,2964.0%
[
1.0%
-
1.5%
]
1.43%
36,9605.2%
[
1.0%
-
1.5%
]
1.48%
5,8848.4%
[
1.5%
-
2.0%
]
1.58%
10,0674.3%
[
1.5%
-
2.0%
]
1.65%
43,0664.2%
[
1.5%
-
2.0%
]
1.70%
90,5705.4%
[
1.5%
-
2.0%
]
1.77%
11,8113.6%
[
1.5%
-
2.0%
]
1.80%
12,7433.8%
[
1.5%
-
2.0%
]
1.85%
17,0707.1%
[
1.5%
-
2.0%
]
1.89%
18,6904.4%
[
1.5%
-
2.0%
]
1.94%
3,5145.8%
[
2.0%
-
2.5%
]
2.01%
20,8344.3%
[
2.0%
-
2.5%
]
2.07%
21,6462.4%
[
2.0%
-
2.5%
]
2.09%
31,9767.3%
[
2.0%
-
2.5%
]
2.20%
40,4189.5%
[
2.5%
-
3.0%
]
2.71%
2,5139.3%
[
3.0%
-
3.5%
]
3.03%
21,42016.4%
[
3.5%
-
4.0%
]
3.58%
3,4407.5%
[
3.5%
-
4.0%
]
3.62%
10,3805.7%
[
4.5%
-
5.0%
]
4.52%
22,3406.3%
[
4.5%
-
5.0%
]
4.55%
7,20310.2%
[
5.0%
-
5.5%
]
5.03%
6,51611.0%
[
10.0%
-
10.5%
]
10.12%
1,2065.0%
[
11.5%
-
12.0%
]
11.78%
3,0561.2%