Immigrants from Moldova Disability Age 5 to 17
COMPARE
Immigrants from Moldova
Select to Compare
Disability Age 5 to 17
Immigrants from Moldova Disability Age 5 to 17
5.2%
DISABILITY | AGE 5 TO 17
99.6/ 100
METRIC RATING
75th/ 347
METRIC RANK
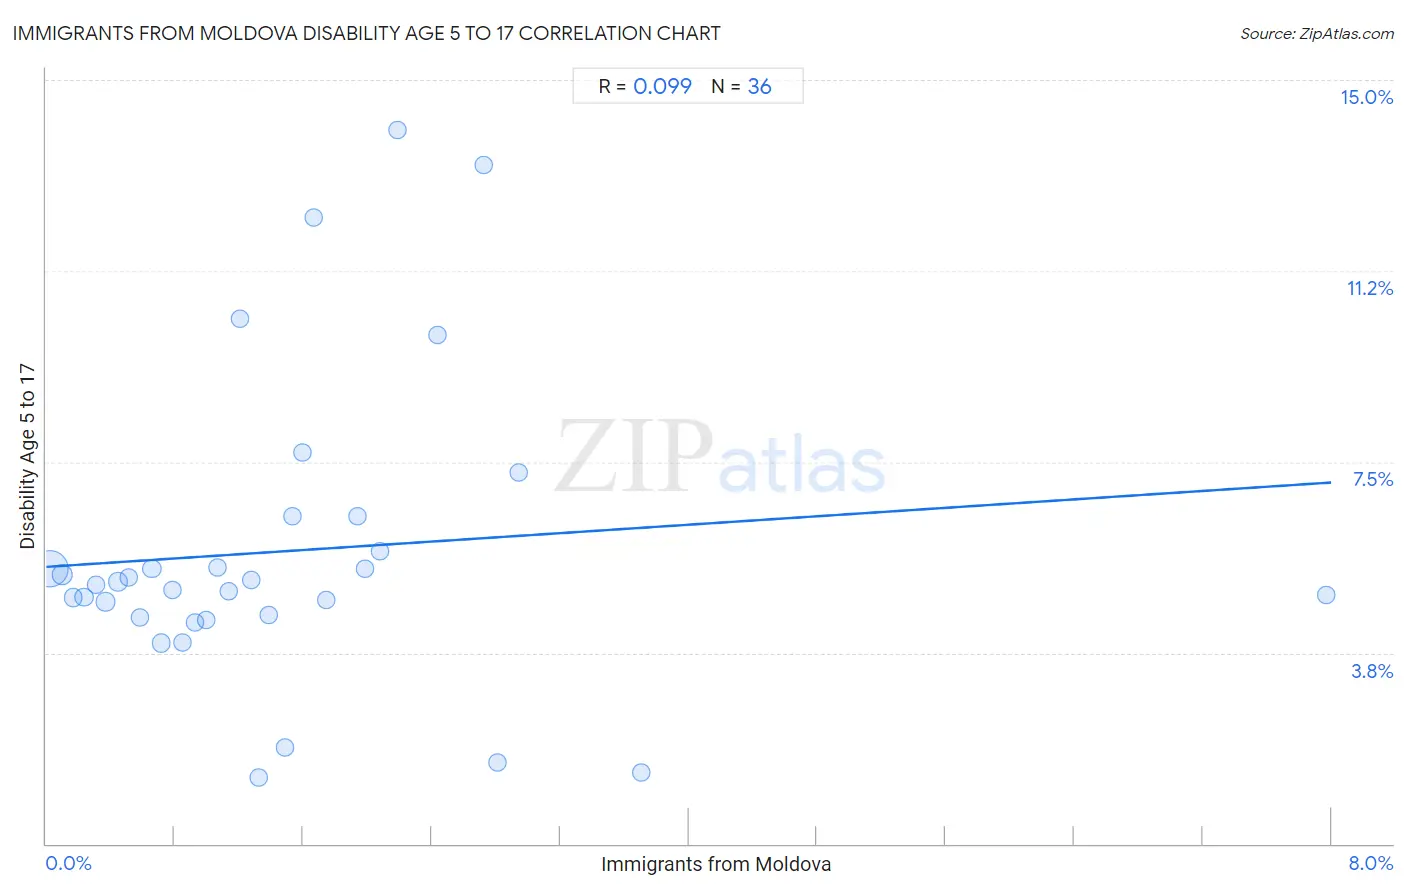
Immigrants from Moldova Disability Age 5 to 17 Correlation Chart
The statistical analysis conducted on geographies consisting of 123,951,863 people shows a slight positive correlation between the proportion of Immigrants from Moldova and percentage of population with a disability between the ages 5 and 17 in the United States with a correlation coefficient (R) of 0.099 and weighted average of 5.2%. On average, for every 1% (one percent) increase in Immigrants from Moldova within a typical geography, there is an increase of 0.21% in percentage of population with a disability between the ages 5 and 17.
It is essential to understand that the correlation between the percentage of Immigrants from Moldova and percentage of population with a disability between the ages 5 and 17 does not imply a direct cause-and-effect relationship. It remains uncertain whether the presence of Immigrants from Moldova influences an upward or downward trend in the level of percentage of population with a disability between the ages 5 and 17 within an area, or if Immigrants from Moldova simply ended up residing in those areas with higher or lower levels of percentage of population with a disability between the ages 5 and 17 due to other factors.
Demographics Similar to Immigrants from Moldova by Disability Age 5 to 17
In terms of disability age 5 to 17, the demographic groups most similar to Immigrants from Moldova are Immigrants from Guyana (5.2%, a difference of 0.040%), Immigrants from Kazakhstan (5.2%, a difference of 0.070%), Immigrants from Cuba (5.2%, a difference of 0.070%), Afghan (5.2%, a difference of 0.11%), and Sri Lankan (5.2%, a difference of 0.14%).
| Demographics | Rating | Rank | Disability Age 5 to 17 |
| Immigrants from Syria | 99.7 /100 | #68 | Exceptional 5.2% |
| Guyanese | 99.7 /100 | #69 | Exceptional 5.2% |
| Immigrants from Belgium | 99.7 /100 | #70 | Exceptional 5.2% |
| Jordanians | 99.7 /100 | #71 | Exceptional 5.2% |
| Immigrants from Vietnam | 99.7 /100 | #72 | Exceptional 5.2% |
| Immigrants from Czechoslovakia | 99.7 /100 | #73 | Exceptional 5.2% |
| Immigrants from Romania | 99.7 /100 | #74 | Exceptional 5.2% |
| Immigrants from Moldova | 99.6 /100 | #75 | Exceptional 5.2% |
| Immigrants from Guyana | 99.6 /100 | #76 | Exceptional 5.2% |
| Immigrants from Kazakhstan | 99.6 /100 | #77 | Exceptional 5.2% |
| Immigrants from Cuba | 99.6 /100 | #78 | Exceptional 5.2% |
| Afghans | 99.6 /100 | #79 | Exceptional 5.2% |
| Sri Lankans | 99.6 /100 | #80 | Exceptional 5.2% |
| Native Hawaiians | 99.6 /100 | #81 | Exceptional 5.2% |
| Immigrants from Sweden | 99.5 /100 | #82 | Exceptional 5.2% |
Immigrants from Moldova Disability Age 5 to 17 Correlation Summary
| Measurement | Immigrants from Moldova Data | Disability Age 5 to 17 Data |
| Minimum | 0.026% | 1.3% |
| Maximum | 8.0% | 14.0% |
| Range | 7.9% | 12.7% |
| Mean | 1.5% | 5.7% |
| Median | 1.2% | 5.1% |
| Interquartile 25% (IQ1) | 0.62% | 4.5% |
| Interquartile 75% (IQ3) | 2.0% | 6.1% |
| Interquartile Range (IQR) | 1.3% | 1.6% |
| Standard Deviation (Sample) | 1.4% | 3.0% |
| Standard Deviation (Population) | 1.4% | 2.9% |
Correlation Details
| Immigrants from Moldova Percentile | Sample Size | Disability Age 5 to 17 |
[ 0.0% - 0.5% ] 0.026% | 92,698,791 | 5.4% |
[ 0.0% - 0.5% ] 0.098% | 15,218,518 | 5.3% |
[ 0.0% - 0.5% ] 0.17% | 5,544,391 | 4.8% |
[ 0.0% - 0.5% ] 0.24% | 3,387,570 | 4.8% |
[ 0.0% - 0.5% ] 0.31% | 2,206,616 | 5.1% |
[ 0.0% - 0.5% ] 0.37% | 857,176 | 4.8% |
[ 0.0% - 0.5% ] 0.45% | 1,056,439 | 5.1% |
[ 0.5% - 1.0% ] 0.52% | 439,664 | 5.2% |
[ 0.5% - 1.0% ] 0.59% | 470,799 | 4.5% |
[ 0.5% - 1.0% ] 0.66% | 289,119 | 5.4% |
[ 0.5% - 1.0% ] 0.71% | 296,121 | 3.9% |
[ 0.5% - 1.0% ] 0.79% | 267,696 | 5.0% |
[ 0.5% - 1.0% ] 0.85% | 132,707 | 4.0% |
[ 0.5% - 1.0% ] 0.92% | 143,007 | 4.4% |
[ 0.5% - 1.0% ] 1.00% | 157,202 | 4.4% |
[ 1.0% - 1.5% ] 1.07% | 42,793 | 5.4% |
[ 1.0% - 1.5% ] 1.14% | 87,699 | 5.0% |
[ 1.0% - 1.5% ] 1.20% | 47,934 | 10.3% |
[ 1.0% - 1.5% ] 1.28% | 132,624 | 5.2% |
[ 1.0% - 1.5% ] 1.32% | 23,065 | 1.3% |
[ 1.0% - 1.5% ] 1.39% | 72,601 | 4.5% |
[ 1.0% - 1.5% ] 1.49% | 470 | 1.9% |
[ 1.5% - 2.0% ] 1.54% | 184,782 | 6.4% |
[ 1.5% - 2.0% ] 1.59% | 127,083 | 7.7% |
[ 1.5% - 2.0% ] 1.67% | 6,004 | 12.3% |
[ 1.5% - 2.0% ] 1.74% | 17,526 | 4.8% |
[ 1.5% - 2.0% ] 1.94% | 21,084 | 6.4% |
[ 1.5% - 2.0% ] 1.98% | 1,009 | 5.4% |
[ 2.0% - 2.5% ] 2.08% | 962 | 5.7% |
[ 2.0% - 2.5% ] 2.19% | 7,218 | 14.0% |
[ 2.0% - 2.5% ] 2.43% | 370 | 10.0% |
[ 2.5% - 3.0% ] 2.72% | 4,926 | 13.3% |
[ 2.5% - 3.0% ] 2.81% | 2,280 | 1.6% |
[ 2.5% - 3.0% ] 2.94% | 680 | 7.3% |
[ 3.5% - 4.0% ] 3.70% | 2,377 | 1.4% |
[ 7.5% - 8.0% ] 7.97% | 2,560 | 4.9% |