Immigrants from England Disability Age 5 to 17
COMPARE
Immigrants from England
Select to Compare
Disability Age 5 to 17
Immigrants from England Disability Age 5 to 17
5.6%
DISABILITY | AGE 5 TO 17
36.4/ 100
METRIC RATING
181st/ 347
METRIC RANK
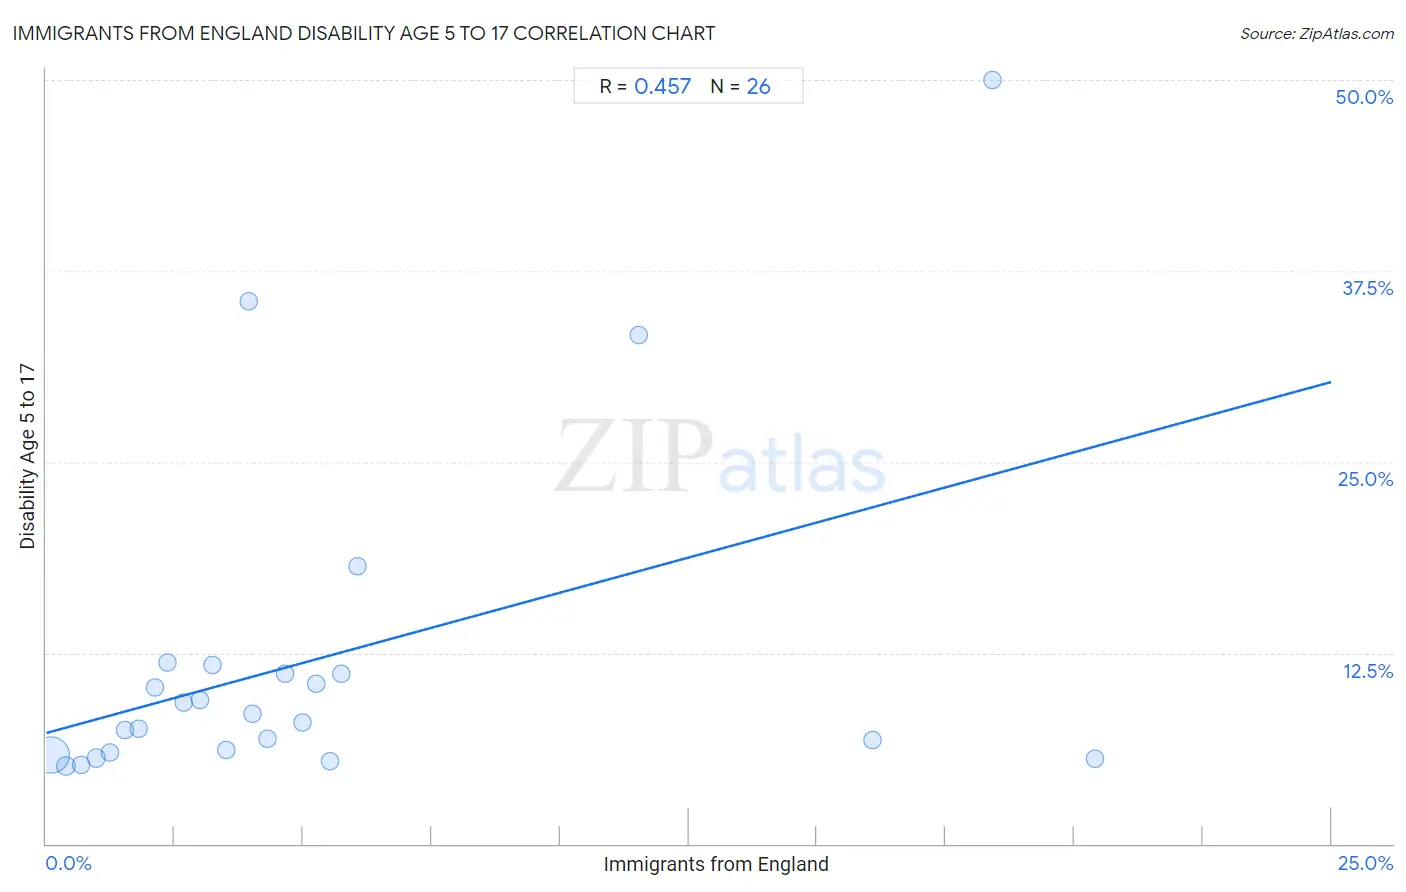
Immigrants from England Disability Age 5 to 17 Correlation Chart
The statistical analysis conducted on geographies consisting of 388,045,043 people shows a moderate positive correlation between the proportion of Immigrants from England and percentage of population with a disability between the ages 5 and 17 in the United States with a correlation coefficient (R) of 0.457 and weighted average of 5.6%. On average, for every 1% (one percent) increase in Immigrants from England within a typical geography, there is an increase of 0.92% in percentage of population with a disability between the ages 5 and 17.
It is essential to understand that the correlation between the percentage of Immigrants from England and percentage of population with a disability between the ages 5 and 17 does not imply a direct cause-and-effect relationship. It remains uncertain whether the presence of Immigrants from England influences an upward or downward trend in the level of percentage of population with a disability between the ages 5 and 17 within an area, or if Immigrants from England simply ended up residing in those areas with higher or lower levels of percentage of population with a disability between the ages 5 and 17 due to other factors.
Demographics Similar to Immigrants from England by Disability Age 5 to 17
In terms of disability age 5 to 17, the demographic groups most similar to Immigrants from England are Mexican American Indian (5.6%, a difference of 0.060%), Immigrants from Uruguay (5.6%, a difference of 0.070%), Immigrants from Latin America (5.6%, a difference of 0.11%), Syrian (5.6%, a difference of 0.14%), and Immigrants from Mexico (5.6%, a difference of 0.14%).
| Demographics | Rating | Rank | Disability Age 5 to 17 |
| Costa Ricans | 50.0 /100 | #174 | Average 5.6% |
| Shoshone | 49.4 /100 | #175 | Average 5.6% |
| Immigrants from Central America | 49.4 /100 | #176 | Average 5.6% |
| Immigrants from Western Europe | 47.8 /100 | #177 | Average 5.6% |
| Immigrants from Trinidad and Tobago | 47.6 /100 | #178 | Average 5.6% |
| Immigrants from Barbados | 40.5 /100 | #179 | Average 5.6% |
| Immigrants from Uruguay | 37.7 /100 | #180 | Fair 5.6% |
| Immigrants from England | 36.4 /100 | #181 | Fair 5.6% |
| Mexican American Indians | 35.2 /100 | #182 | Fair 5.6% |
| Immigrants from Latin America | 34.3 /100 | #183 | Fair 5.6% |
| Syrians | 33.8 /100 | #184 | Fair 5.6% |
| Immigrants from Mexico | 33.7 /100 | #185 | Fair 5.6% |
| Fijians | 31.7 /100 | #186 | Fair 5.7% |
| Immigrants from Thailand | 30.2 /100 | #187 | Fair 5.7% |
| Marshallese | 28.1 /100 | #188 | Fair 5.7% |
Immigrants from England Disability Age 5 to 17 Correlation Summary
| Measurement | Immigrants from England Data | Disability Age 5 to 17 Data |
| Minimum | 0.098% | 5.1% |
| Maximum | 20.4% | 50.0% |
| Range | 20.3% | 44.9% |
| Mean | 5.2% | 12.0% |
| Median | 3.7% | 8.2% |
| Interquartile 25% (IQ1) | 1.8% | 6.0% |
| Interquartile 75% (IQ3) | 5.5% | 11.1% |
| Interquartile Range (IQR) | 3.7% | 5.2% |
| Standard Deviation (Sample) | 5.4% | 10.9% |
| Standard Deviation (Population) | 5.3% | 10.7% |
Correlation Details
| Immigrants from England Percentile | Sample Size | Disability Age 5 to 17 |
[ 0.0% - 0.5% ] 0.098% | 345,566,581 | 5.8% |
[ 0.0% - 0.5% ] 0.38% | 33,777,673 | 5.1% |
[ 0.5% - 1.0% ] 0.68% | 6,073,513 | 5.2% |
[ 0.5% - 1.0% ] 0.97% | 1,519,675 | 5.6% |
[ 1.0% - 1.5% ] 1.23% | 601,758 | 6.0% |
[ 1.5% - 2.0% ] 1.54% | 208,003 | 7.5% |
[ 1.5% - 2.0% ] 1.80% | 109,194 | 7.5% |
[ 2.0% - 2.5% ] 2.10% | 45,730 | 10.2% |
[ 2.0% - 2.5% ] 2.36% | 36,080 | 11.9% |
[ 2.5% - 3.0% ] 2.67% | 17,758 | 9.2% |
[ 2.5% - 3.0% ] 2.99% | 30,673 | 9.4% |
[ 3.0% - 3.5% ] 3.24% | 12,388 | 11.7% |
[ 3.0% - 3.5% ] 3.50% | 4,948 | 6.2% |
[ 3.5% - 4.0% ] 3.93% | 229 | 35.6% |
[ 4.0% - 4.5% ] 4.00% | 1,898 | 8.5% |
[ 4.0% - 4.5% ] 4.30% | 13,712 | 6.9% |
[ 4.5% - 5.0% ] 4.66% | 14,691 | 11.1% |
[ 4.5% - 5.0% ] 4.99% | 3,264 | 7.9% |
[ 5.0% - 5.5% ] 5.24% | 3,051 | 10.5% |
[ 5.5% - 6.0% ] 5.53% | 1,772 | 5.4% |
[ 5.5% - 6.0% ] 5.73% | 1,029 | 11.1% |
[ 6.0% - 6.5% ] 6.06% | 742 | 18.2% |
[ 11.5% - 12.0% ] 11.54% | 130 | 33.3% |
[ 16.0% - 16.5% ] 16.07% | 361 | 6.8% |
[ 18.0% - 18.5% ] 18.42% | 38 | 50.0% |
[ 20.0% - 20.5% ] 20.39% | 152 | 5.6% |