Kenyan Disability Age 5 to 17

COMPARE

Kenyan
Race
Ancestry
AfghanAfricanAlaska NativeAlaskan AthabascanAlbanianAleutAlsatianAmericanApacheArabArapahoArgentineanArmenianAssyrian/Chaldean/SyriacAustralianAustrianBahamianBangladeshiBarbadianBasqueBelgianBelizeanBermudanBhutaneseBlackfeetBolivianBrazilianBritishBritish West IndianBulgarianBurmeseCajunCambodianCanadianCape VerdeanCarpatho RusynCelticCentral AmericanCentral American IndianCherokeeCheyenneChickasawChileanChineseChippewaChoctawColombianColvilleComancheCosta RicanCreeCreekCroatianCrowCubanCypriotCzechCzechoslovakianDanishDelawareDominicanDutchDutch West IndianEastern EuropeanEcuadorianEgyptianEnglishEstonianEthiopianEuropeanFijianFilipinoFinnishFrenchFrench American IndianFrench CanadianGermanGerman RussianGhanaianGreekGuamanian/ChamorroGuatemalanGuyaneseHaitianHmongHonduranHopiHoumaHungarianIcelanderIndian (Asian)IndonesianInupiatIranianIraqiIrishIroquoisIsraeliItalianJamaicanJapaneseJordanianKenyanKiowaKoreanLaotianLatvianLebaneseLiberianLithuanianLumbeeLuxembourgerMacedonianMalaysianMalteseMarshalleseMenomineeMexicanMexican American IndianMongolianMoroccanNative HawaiianNavajoNepaleseNew ZealanderNicaraguanNigerianNorthern EuropeanNorwegianOkinawanOsageOttawaPaiutePakistaniPalestinianPanamanianParaguayanPennsylvania GermanPeruvianPimaPolishPortuguesePotawatomiPuebloPuerto RicanPuget Sound SalishRomanianRussianSalvadoranSamoanScandinavianScotch-IrishScottishSeminoleSenegaleseSerbianShoshoneSierra LeoneanSiouxSlavicSlovakSloveneSomaliSouth AfricanSouth AmericanSouth American IndianSoviet UnionSpaniardSpanishSpanish AmericanSpanish American IndianSri LankanSubsaharan AfricanSudaneseSwedishSwissSyrianTaiwaneseThaiTlingit-HaidaTohono O'OdhamTonganTrinidadian and TobagonianTsimshianTurkishU.S. Virgin IslanderUgandanUkrainianUruguayanUteVenezuelanVietnameseWelshWest IndianYakamaYaquiYugoslavianYumanYup'ikZimbabwean
Immigration
NonimmigrantsImmigrantsAfghanistanAfricaAlbaniaArgentinaArmeniaAsiaAustraliaAustriaBahamasBangladeshBarbadosBelarusBelgiumBelizeBoliviaBosnia and HerzegovinaBrazilBulgariaBurma/MyanmarCabo VerdeCambodiaCameroonCanadaCaribbeanCentral AmericaChileChinaColombiaCongoCosta RicaCroatiaCubaCzechoslovakiaDenmarkDominicaDominican RepublicEastern AfricaEastern AsiaEastern EuropeEcuadorEgyptEl SalvadorEnglandEritreaEthiopiaEuropeFijiFranceGermanyGhanaGreeceGrenadaGuatemalaGuyanaHaitiHondurasHong KongHungaryIndiaIndonesiaIranIraqIrelandIsraelItalyJamaicaJapanJordanKazakhstanKenyaKoreaKuwaitLaosLatin AmericaLatviaLebanonLiberiaLithuaniaMalaysiaMexicoMicronesiaMiddle AfricaMoldovaMoroccoNepalNetherlandsNicaraguaNigeriaNorth AmericaNorth MacedoniaNorthern AfricaNorthern EuropeNorwayOceaniaPakistanPanamaPeruPhilippinesPolandPortugalRomaniaRussiaSaudi ArabiaScotlandSenegalSerbiaSierra LeoneSingaporeSomaliaSouth AfricaSouth AmericaSouth Central AsiaSouth Eastern AsiaSouthern EuropeSpainSri LankaSt. Vincent and the GrenadinesSudanSwedenSwitzerlandSyriaTaiwanThailandTrinidad and TobagoTurkeyUgandaUkraineUruguayUzbekistanVenezuelaVietnamWest IndiesWestern AfricaWestern AsiaWestern EuropeYemenZaireZimbabweAzores
Select to Compare
Race
Ancestry
AfghanAfricanAlaska NativeAlaskan AthabascanAlbanianAleutAlsatianAmericanApacheArabArapahoArgentineanArmenianAssyrian/Chaldean/SyriacAustralianAustrianBahamianBangladeshiBarbadianBasqueBelgianBelizeanBermudanBhutaneseBlackfeetBolivianBrazilianBritishBritish West IndianBulgarianBurmeseCajunCambodianCanadianCape VerdeanCarpatho RusynCelticCentral AmericanCentral American IndianCherokeeCheyenneChickasawChileanChineseChippewaChoctawColombianColvilleComancheCosta RicanCreeCreekCroatianCrowCubanCypriotCzechCzechoslovakianDanishDelawareDominicanDutchDutch West IndianEastern EuropeanEcuadorianEgyptianEnglishEstonianEthiopianEuropeanFijianFilipinoFinnishFrenchFrench American IndianFrench CanadianGermanGerman RussianGhanaianGreekGuamanian/ChamorroGuatemalanGuyaneseHaitianHmongHonduranHopiHoumaHungarianIcelanderIndian (Asian)IndonesianInupiatIranianIraqiIrishIroquoisIsraeliItalianJamaicanJapaneseJordanianKiowaKoreanLaotianLatvianLebaneseLiberianLithuanianLumbeeLuxembourgerMacedonianMalaysianMalteseMarshalleseMenomineeMexicanMexican American IndianMongolianMoroccanNative HawaiianNavajoNepaleseNew ZealanderNicaraguanNigerianNorthern EuropeanNorwegianOkinawanOsageOttawaPaiutePakistaniPalestinianPanamanianParaguayanPennsylvania GermanPeruvianPimaPolishPortuguesePotawatomiPuebloPuerto RicanPuget Sound SalishRomanianRussianSalvadoranSamoanScandinavianScotch-IrishScottishSeminoleSenegaleseSerbianShoshoneSierra LeoneanSiouxSlavicSlovakSloveneSomaliSouth AfricanSouth AmericanSouth American IndianSoviet UnionSpaniardSpanishSpanish AmericanSpanish American IndianSri LankanSubsaharan AfricanSudaneseSwedishSwissSyrianTaiwaneseThaiTlingit-HaidaTohono O'OdhamTonganTrinidadian and TobagonianTsimshianTurkishU.S. Virgin IslanderUgandanUkrainianUruguayanUteVenezuelanVietnameseWelshWest IndianYakamaYaquiYugoslavianYumanYup'ikZimbabwean
Immigration
NonimmigrantsImmigrantsAfghanistanAfricaAlbaniaArgentinaArmeniaAsiaAustraliaAustriaBahamasBangladeshBarbadosBelarusBelgiumBelizeBoliviaBosnia and HerzegovinaBrazilBulgariaBurma/MyanmarCabo VerdeCambodiaCameroonCanadaCaribbeanCentral AmericaChileChinaColombiaCongoCosta RicaCroatiaCubaCzechoslovakiaDenmarkDominicaDominican RepublicEastern AfricaEastern AsiaEastern EuropeEcuadorEgyptEl SalvadorEnglandEritreaEthiopiaEuropeFijiFranceGermanyGhanaGreeceGrenadaGuatemalaGuyanaHaitiHondurasHong KongHungaryIndiaIndonesiaIranIraqIrelandIsraelItalyJamaicaJapanJordanKazakhstanKenyaKoreaKuwaitLaosLatin AmericaLatviaLebanonLiberiaLithuaniaMalaysiaMexicoMicronesiaMiddle AfricaMoldovaMoroccoNepalNetherlandsNicaraguaNigeriaNorth AmericaNorth MacedoniaNorthern AfricaNorthern EuropeNorwayOceaniaPakistanPanamaPeruPhilippinesPolandPortugalRomaniaRussiaSaudi ArabiaScotlandSenegalSerbiaSierra LeoneSingaporeSomaliaSouth AfricaSouth AmericaSouth Central AsiaSouth Eastern AsiaSouthern EuropeSpainSri LankaSt. Vincent and the GrenadinesSudanSwedenSwitzerlandSyriaTaiwanThailandTrinidad and TobagoTurkeyUgandaUkraineUruguayUzbekistanVenezuelaVietnamWest IndiesWestern AfricaWestern AsiaWestern EuropeYemenZaireZimbabweAzores
Disability Age 5 to 17
Income
Poverty
Unemployment
Labor Participation
Family Structure
Vehicle Availability
Education Level
Disability

Kenyan Disability Age 5 to 17
Poor

5.8%
DISABILITY | AGE 5 TO 17
10.0/ 100
METRIC RATING
208th/ 347
METRIC RANK

Kenyan Disability Age 5 to 17 Correlation Chart

The statistical analysis conducted on geographies consisting of 167,701,588 people shows no correlation between the proportion of Kenyans and percentage of population with a disability between the ages 5 and 17 in the United States with a correlation coefficient (R) of 0.001 and weighted average of 5.8%. On average, for every 1% (one percent) increase in Kenyans within a typical geography, there is an increase of 0.00071% in percentage of population with a disability between the ages 5 and 17.
Kenyan Disability Age 5 to 17
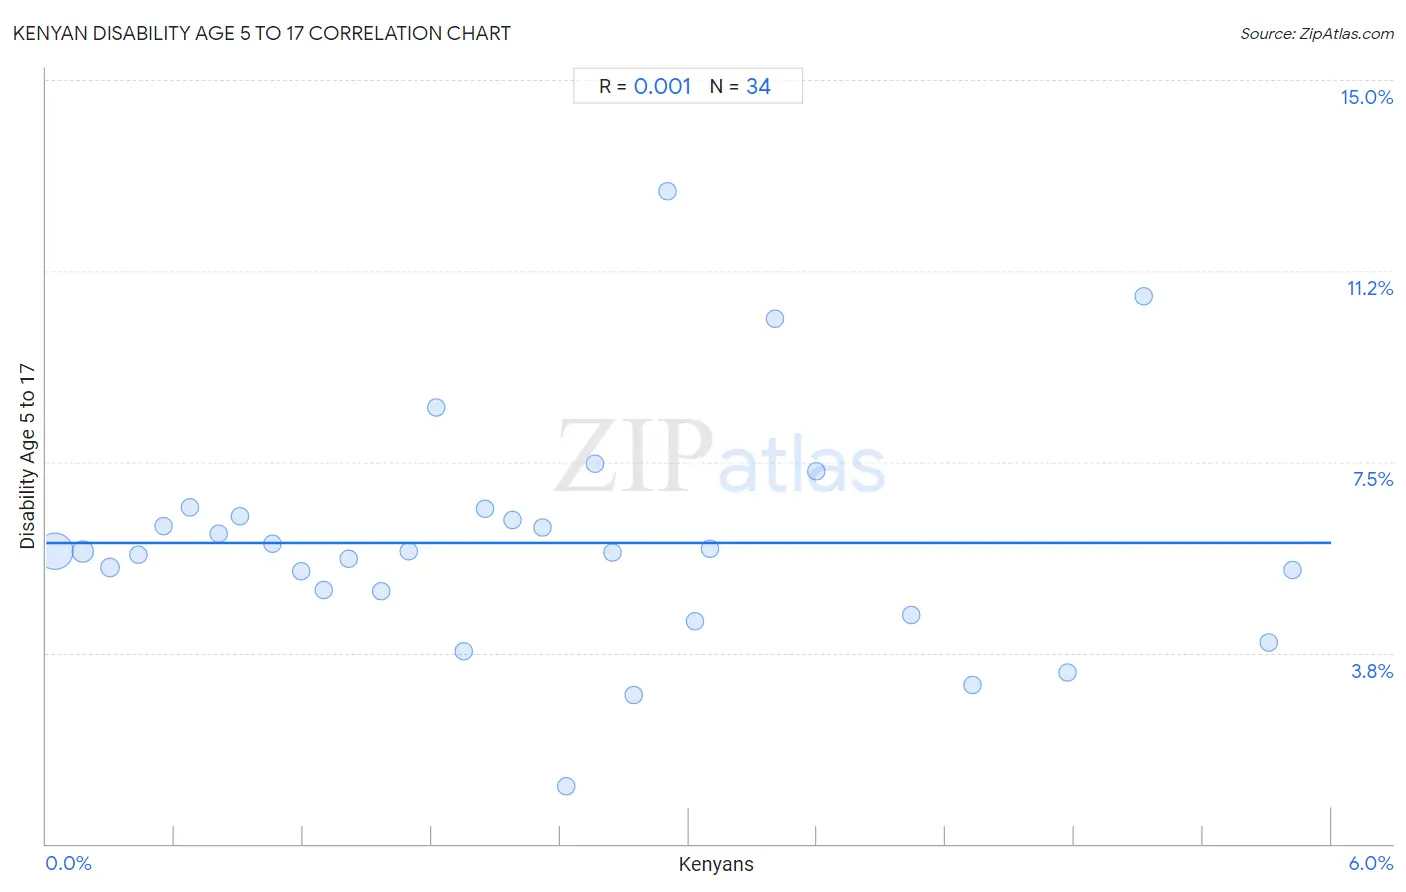
It is essential to understand that the correlation between the percentage of Kenyans and percentage of population with a disability between the ages 5 and 17 does not imply a direct cause-and-effect relationship. It remains uncertain whether the presence of Kenyans influences an upward or downward trend in the level of percentage of population with a disability between the ages 5 and 17 within an area, or if Kenyans simply ended up residing in those areas with higher or lower levels of percentage of population with a disability between the ages 5 and 17 due to other factors.

Demographics Similar to Kenyans by Disability Age 5 to 17

In terms of disability age 5 to 17, the demographic groups most similar to Kenyans are Immigrants from Uganda (5.8%, a difference of 0.040%), Moroccan (5.7%, a difference of 0.050%), Immigrants from Haiti (5.8%, a difference of 0.070%), Trinidadian and Tobagonian (5.7%, a difference of 0.10%), and Immigrants from Africa (5.7%, a difference of 0.10%).
DemographicsRating | RankDisability Age 5 to 17
Basques
13.7
/100
|
#201
Poor
5.7%
Austrians
13.2
/100
|
#202
Poor
5.7%
Spanish American Indians
12.8
/100
|
#203
Poor
5.7%
Paiute
11.2
/100
|
#204
Poor
5.7%
Trinidadians and Tobagonians
10.8
/100
|
#205
Poor
5.7%
Immigrants from Africa
10.8
/100
|
#206
Poor
5.7%
Moroccans
10.4
/100
|
#207
Poor
5.7%
Kenyans
10.0
/100
|
#208
Poor
5.8%
Immigrants from Uganda
9.7
/100
|
#209
Tragic
5.8%
Immigrants from Haiti
9.5
/100
|
#210
Tragic
5.8%
Yugoslavians
9.1
/100
|
#211
Tragic
5.8%
Immigrants from Panama
8.7
/100
|
#212
Tragic
5.8%
Immigrants from Cameroon
8.3
/100
|
#213
Tragic
5.8%
Immigrants from Morocco
8.3
/100
|
#214
Tragic
5.8%
Swedes
8.1
/100
|
#215
Tragic
5.8%

Kenyan Disability Age 5 to 17 Correlation Summary

MeasurementKenyan DataDisability Age 5 to 17 Data
Minimum0.039%1.1%
Maximum5.8%12.8%
Range5.8%11.7%
Mean2.3%5.9%
Median2.1%5.7%
Interquartile 25% (IQ1)1.1%5.0%
Interquartile 75% (IQ3)3.1%6.4%
Interquartile Range (IQR)2.0%1.5%
Standard Deviation (Sample)1.6%2.2%
Standard Deviation (Population)1.6%2.2%

Correlation Details

Kenyan PercentileSample SizeDisability Age 5 to 17
[
0.0%
-
0.5%
]
0.039%
126,374,5475.7%
[
0.0%
-
0.5%
]
0.17%
21,605,5985.7%
[
0.0%
-
0.5%
]
0.30%
8,380,2585.4%
[
0.0%
-
0.5%
]
0.43%
4,720,6065.7%
[
0.5%
-
1.0%
]
0.55%
2,077,9706.2%
[
0.5%
-
1.0%
]
0.67%
1,165,5476.6%
[
0.5%
-
1.0%
]
0.80%
968,8416.1%
[
0.5%
-
1.0%
]
0.90%
443,2366.4%
[
1.0%
-
1.5%
]
1.05%
431,2275.9%
[
1.0%
-
1.5%
]
1.19%
327,7405.4%
[
1.0%
-
1.5%
]
1.30%
231,5945.0%
[
1.0%
-
1.5%
]
1.41%
210,3335.6%
[
1.5%
-
2.0%
]
1.56%
190,2895.0%
[
1.5%
-
2.0%
]
1.69%
99,1015.8%
[
1.5%
-
2.0%
]
1.82%
28,7598.6%
[
1.5%
-
2.0%
]
1.95%
130,7473.8%
[
2.0%
-
2.5%
]
2.05%
69,6126.6%
[
2.0%
-
2.5%
]
2.18%
82,9726.3%
[
2.0%
-
2.5%
]
2.32%
61,1716.2%
[
2.0%
-
2.5%
]
2.43%
1,4821.1%
[
2.5%
-
3.0%
]
2.56%
5867.5%
[
2.5%
-
3.0%
]
2.65%
31,7795.7%
[
2.5%
-
3.0%
]
2.74%
6,8552.9%
[
2.5%
-
3.0%
]
2.90%
3,96612.8%
[
3.0%
-
3.5%
]
3.03%
12,8304.4%
[
3.0%
-
3.5%
]
3.10%
8,3895.8%
[
3.0%
-
3.5%
]
3.40%
2,76410.3%
[
3.5%
-
4.0%
]
3.59%
3,7857.3%
[
4.0%
-
4.5%
]
4.04%
4,2614.5%
[
4.0%
-
4.5%
]
4.32%
2,4743.1%
[
4.5%
-
5.0%
]
4.77%
9,3323.4%
[
5.0%
-
5.5%
]
5.13%
4,99510.8%
[
5.5%
-
6.0%
]
5.71%
4,7284.0%
[
5.5%
-
6.0%
]
5.82%
3,2145.4%