Immigrants from Argentina Disability Age 5 to 17

COMPARE

Immigrants from Argentina
Race
Ancestry
AfghanAfricanAlaska NativeAlaskan AthabascanAlbanianAleutAlsatianAmericanApacheArabArapahoArgentineanArmenianAssyrian/Chaldean/SyriacAustralianAustrianBahamianBangladeshiBarbadianBasqueBelgianBelizeanBermudanBhutaneseBlackfeetBolivianBrazilianBritishBritish West IndianBulgarianBurmeseCajunCambodianCanadianCape VerdeanCarpatho RusynCelticCentral AmericanCentral American IndianCherokeeCheyenneChickasawChileanChineseChippewaChoctawColombianColvilleComancheCosta RicanCreeCreekCroatianCrowCubanCypriotCzechCzechoslovakianDanishDelawareDominicanDutchDutch West IndianEastern EuropeanEcuadorianEgyptianEnglishEstonianEthiopianEuropeanFijianFilipinoFinnishFrenchFrench American IndianFrench CanadianGermanGerman RussianGhanaianGreekGuamanian/ChamorroGuatemalanGuyaneseHaitianHmongHonduranHopiHoumaHungarianIcelanderIndian (Asian)IndonesianInupiatIranianIraqiIrishIroquoisIsraeliItalianJamaicanJapaneseJordanianKenyanKiowaKoreanLaotianLatvianLebaneseLiberianLithuanianLumbeeLuxembourgerMacedonianMalaysianMalteseMarshalleseMenomineeMexicanMexican American IndianMongolianMoroccanNative HawaiianNavajoNepaleseNew ZealanderNicaraguanNigerianNorthern EuropeanNorwegianOkinawanOsageOttawaPaiutePakistaniPalestinianPanamanianParaguayanPennsylvania GermanPeruvianPimaPolishPortuguesePotawatomiPuebloPuerto RicanPuget Sound SalishRomanianRussianSalvadoranSamoanScandinavianScotch-IrishScottishSeminoleSenegaleseSerbianShoshoneSierra LeoneanSiouxSlavicSlovakSloveneSomaliSouth AfricanSouth AmericanSouth American IndianSoviet UnionSpaniardSpanishSpanish AmericanSpanish American IndianSri LankanSubsaharan AfricanSudaneseSwedishSwissSyrianTaiwaneseThaiTlingit-HaidaTohono O'OdhamTonganTrinidadian and TobagonianTsimshianTurkishU.S. Virgin IslanderUgandanUkrainianUruguayanUteVenezuelanVietnameseWelshWest IndianYakamaYaquiYugoslavianYumanYup'ikZimbabwean
Immigration
NonimmigrantsImmigrantsAfghanistanAfricaAlbaniaArgentinaArmeniaAsiaAustraliaAustriaBahamasBangladeshBarbadosBelarusBelgiumBelizeBoliviaBosnia and HerzegovinaBrazilBulgariaBurma/MyanmarCabo VerdeCambodiaCameroonCanadaCaribbeanCentral AmericaChileChinaColombiaCongoCosta RicaCroatiaCubaCzechoslovakiaDenmarkDominicaDominican RepublicEastern AfricaEastern AsiaEastern EuropeEcuadorEgyptEl SalvadorEnglandEritreaEthiopiaEuropeFijiFranceGermanyGhanaGreeceGrenadaGuatemalaGuyanaHaitiHondurasHong KongHungaryIndiaIndonesiaIranIraqIrelandIsraelItalyJamaicaJapanJordanKazakhstanKenyaKoreaKuwaitLaosLatin AmericaLatviaLebanonLiberiaLithuaniaMalaysiaMexicoMicronesiaMiddle AfricaMoldovaMoroccoNepalNetherlandsNicaraguaNigeriaNorth AmericaNorth MacedoniaNorthern AfricaNorthern EuropeNorwayOceaniaPakistanPanamaPeruPhilippinesPolandPortugalRomaniaRussiaSaudi ArabiaScotlandSenegalSerbiaSierra LeoneSingaporeSomaliaSouth AfricaSouth AmericaSouth Central AsiaSouth Eastern AsiaSouthern EuropeSpainSri LankaSt. Vincent and the GrenadinesSudanSwedenSwitzerlandSyriaTaiwanThailandTrinidad and TobagoTurkeyUgandaUkraineUruguayUzbekistanVenezuelaVietnamWest IndiesWestern AfricaWestern AsiaWestern EuropeYemenZaireZimbabweAzores
Select to Compare
Race
Ancestry
AfghanAfricanAlaska NativeAlaskan AthabascanAlbanianAleutAlsatianAmericanApacheArabArapahoArgentineanArmenianAssyrian/Chaldean/SyriacAustralianAustrianBahamianBangladeshiBarbadianBasqueBelgianBelizeanBermudanBhutaneseBlackfeetBolivianBrazilianBritishBritish West IndianBulgarianBurmeseCajunCambodianCanadianCape VerdeanCarpatho RusynCelticCentral AmericanCentral American IndianCherokeeCheyenneChickasawChileanChineseChippewaChoctawColombianColvilleComancheCosta RicanCreeCreekCroatianCrowCubanCypriotCzechCzechoslovakianDanishDelawareDominicanDutchDutch West IndianEastern EuropeanEcuadorianEgyptianEnglishEstonianEthiopianEuropeanFijianFilipinoFinnishFrenchFrench American IndianFrench CanadianGermanGerman RussianGhanaianGreekGuamanian/ChamorroGuatemalanGuyaneseHaitianHmongHonduranHopiHoumaHungarianIcelanderIndian (Asian)IndonesianInupiatIranianIraqiIrishIroquoisIsraeliItalianJamaicanJapaneseJordanianKenyanKiowaKoreanLaotianLatvianLebaneseLiberianLithuanianLumbeeLuxembourgerMacedonianMalaysianMalteseMarshalleseMenomineeMexicanMexican American IndianMongolianMoroccanNative HawaiianNavajoNepaleseNew ZealanderNicaraguanNigerianNorthern EuropeanNorwegianOkinawanOsageOttawaPaiutePakistaniPalestinianPanamanianParaguayanPennsylvania GermanPeruvianPimaPolishPortuguesePotawatomiPuebloPuerto RicanPuget Sound SalishRomanianRussianSalvadoranSamoanScandinavianScotch-IrishScottishSeminoleSenegaleseSerbianShoshoneSierra LeoneanSiouxSlavicSlovakSloveneSomaliSouth AfricanSouth AmericanSouth American IndianSoviet UnionSpaniardSpanishSpanish AmericanSpanish American IndianSri LankanSubsaharan AfricanSudaneseSwedishSwissSyrianTaiwaneseThaiTlingit-HaidaTohono O'OdhamTonganTrinidadian and TobagonianTsimshianTurkishU.S. Virgin IslanderUgandanUkrainianUruguayanUteVenezuelanVietnameseWelshWest IndianYakamaYaquiYugoslavianYumanYup'ikZimbabwean
Immigration
NonimmigrantsImmigrantsAfghanistanAfricaAlbaniaArmeniaAsiaAustraliaAustriaBahamasBangladeshBarbadosBelarusBelgiumBelizeBoliviaBosnia and HerzegovinaBrazilBulgariaBurma/MyanmarCabo VerdeCambodiaCameroonCanadaCaribbeanCentral AmericaChileChinaColombiaCongoCosta RicaCroatiaCubaCzechoslovakiaDenmarkDominicaDominican RepublicEastern AfricaEastern AsiaEastern EuropeEcuadorEgyptEl SalvadorEnglandEritreaEthiopiaEuropeFijiFranceGermanyGhanaGreeceGrenadaGuatemalaGuyanaHaitiHondurasHong KongHungaryIndiaIndonesiaIranIraqIrelandIsraelItalyJamaicaJapanJordanKazakhstanKenyaKoreaKuwaitLaosLatin AmericaLatviaLebanonLiberiaLithuaniaMalaysiaMexicoMicronesiaMiddle AfricaMoldovaMoroccoNepalNetherlandsNicaraguaNigeriaNorth AmericaNorth MacedoniaNorthern AfricaNorthern EuropeNorwayOceaniaPakistanPanamaPeruPhilippinesPolandPortugalRomaniaRussiaSaudi ArabiaScotlandSenegalSerbiaSierra LeoneSingaporeSomaliaSouth AfricaSouth AmericaSouth Central AsiaSouth Eastern AsiaSouthern EuropeSpainSri LankaSt. Vincent and the GrenadinesSudanSwedenSwitzerlandSyriaTaiwanThailandTrinidad and TobagoTurkeyUgandaUkraineUruguayUzbekistanVenezuelaVietnamWest IndiesWestern AfricaWestern AsiaWestern EuropeYemenZaireZimbabweAzores
Disability Age 5 to 17
Income
Poverty
Unemployment
Labor Participation
Family Structure
Vehicle Availability
Education Level
Disability

Immigrants from Argentina Disability Age 5 to 17
Exceptional

5.0%
DISABILITY | AGE 5 TO 17
100.0/ 100
METRIC RATING
39th/ 347
METRIC RANK

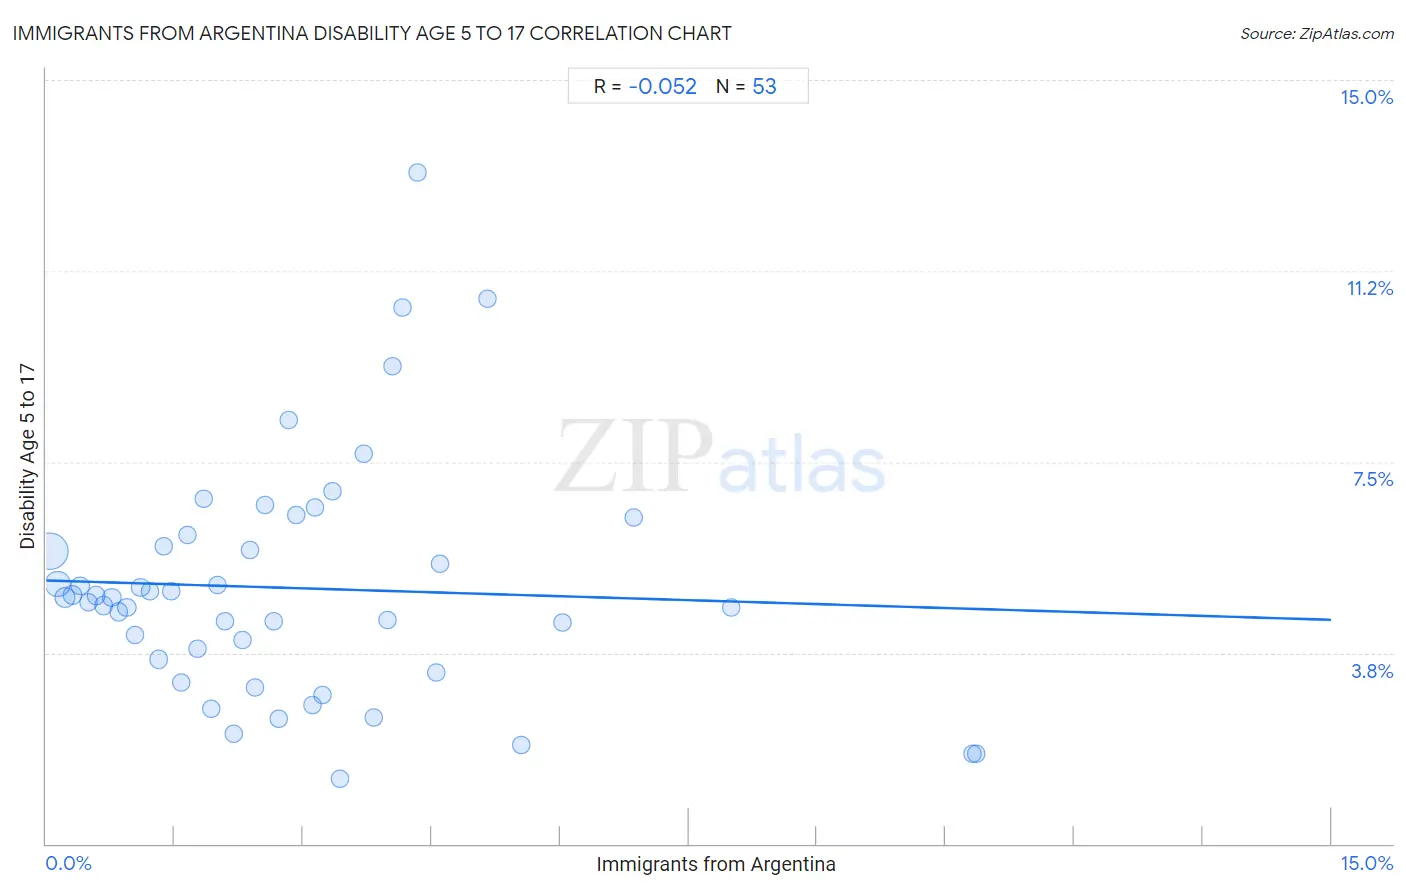
Immigrants from Argentina Disability Age 5 to 17 Correlation Chart

The statistical analysis conducted on geographies consisting of 262,882,826 people shows a slight negative correlation between the proportion of Immigrants from Argentina and percentage of population with a disability between the ages 5 and 17 in the United States with a correlation coefficient (R) of -0.052 and weighted average of 5.0%. On average, for every 1% (one percent) increase in Immigrants from Argentina within a typical geography, there is a decrease of 0.051% in percentage of population with a disability between the ages 5 and 17.
Immigrants from Argentina Disability Age 5 to 17
It is essential to understand that the correlation between the percentage of Immigrants from Argentina and percentage of population with a disability between the ages 5 and 17 does not imply a direct cause-and-effect relationship. It remains uncertain whether the presence of Immigrants from Argentina influences an upward or downward trend in the level of percentage of population with a disability between the ages 5 and 17 within an area, or if Immigrants from Argentina simply ended up residing in those areas with higher or lower levels of percentage of population with a disability between the ages 5 and 17 due to other factors.

Demographics Similar to Immigrants from Argentina by Disability Age 5 to 17

In terms of disability age 5 to 17, the demographic groups most similar to Immigrants from Argentina are Immigrants from Philippines (5.0%, a difference of 0.010%), Immigrants from Belarus (5.0%, a difference of 0.050%), Immigrants from Egypt (5.0%, a difference of 0.080%), Okinawan (5.0%, a difference of 0.080%), and Bolivian (5.0%, a difference of 0.12%).
DemographicsRating | RankDisability Age 5 to 17
Soviet Union
100.0
/100
|
#32
Exceptional
5.0%
Immigrants from Indonesia
100.0
/100
|
#33
Exceptional
5.0%
Israelis
100.0
/100
|
#34
Exceptional
5.0%
Bolivians
100.0
/100
|
#35
Exceptional
5.0%
Immigrants from Egypt
100.0
/100
|
#36
Exceptional
5.0%
Immigrants from Belarus
100.0
/100
|
#37
Exceptional
5.0%
Immigrants from Philippines
100.0
/100
|
#38
Exceptional
5.0%
Immigrants from Argentina
100.0
/100
|
#39
Exceptional
5.0%
Okinawans
100.0
/100
|
#40
Exceptional
5.0%
Immigrants from Australia
100.0
/100
|
#41
Exceptional
5.0%
Immigrants from Sri Lanka
100.0
/100
|
#42
Exceptional
5.0%
Immigrants from Russia
100.0
/100
|
#43
Exceptional
5.0%
Egyptians
100.0
/100
|
#44
Exceptional
5.0%
Tongans
100.0
/100
|
#45
Exceptional
5.0%
Assyrians/Chaldeans/Syriacs
100.0
/100
|
#46
Exceptional
5.0%

Immigrants from Argentina Disability Age 5 to 17 Correlation Summary

MeasurementImmigrants from Argentina DataDisability Age 5 to 17 Data
Minimum0.040%1.3%
Maximum10.9%13.2%
Range10.8%11.9%
Mean2.9%5.0%
Median2.4%4.8%
Interquartile 25% (IQ1)1.2%3.5%
Interquartile 75% (IQ3)3.9%6.0%
Interquartile Range (IQR)2.8%2.5%
Standard Deviation (Sample)2.4%2.3%
Standard Deviation (Population)2.4%2.3%

Correlation Details

Immigrants from Argentina PercentileSample SizeDisability Age 5 to 17
[
0.0%
-
0.5%
]
0.040%
155,259,2665.8%
[
0.0%
-
0.5%
]
0.13%
58,008,5705.1%
[
0.0%
-
0.5%
]
0.22%
20,061,4014.8%
[
0.0%
-
0.5%
]
0.31%
10,265,8214.9%
[
0.0%
-
0.5%
]
0.40%
6,702,4485.1%
[
0.0%
-
0.5%
]
0.49%
3,282,3914.7%
[
0.5%
-
1.0%
]
0.58%
2,029,1314.9%
[
0.5%
-
1.0%
]
0.67%
1,535,7844.7%
[
0.5%
-
1.0%
]
0.77%
852,6054.8%
[
0.5%
-
1.0%
]
0.84%
637,0334.6%
[
0.5%
-
1.0%
]
0.94%
753,8724.6%
[
1.0%
-
1.5%
]
1.03%
351,2904.1%
[
1.0%
-
1.5%
]
1.10%
760,5845.0%
[
1.0%
-
1.5%
]
1.21%
447,2655.0%
[
1.0%
-
1.5%
]
1.31%
321,9923.6%
[
1.0%
-
1.5%
]
1.38%
49,6655.8%
[
1.0%
-
1.5%
]
1.46%
32,1055.0%
[
1.5%
-
2.0%
]
1.57%
228,6423.2%
[
1.5%
-
2.0%
]
1.65%
301,3606.1%
[
1.5%
-
2.0%
]
1.76%
15,5583.8%
[
1.5%
-
2.0%
]
1.84%
95,2766.8%
[
1.5%
-
2.0%
]
1.93%
77,1792.7%
[
1.5%
-
2.0%
]
2.00%
93,2865.1%
[
2.0%
-
2.5%
]
2.09%
22,2964.4%
[
2.0%
-
2.5%
]
2.19%
58,4232.2%
[
2.0%
-
2.5%
]
2.29%
40,6044.0%
[
2.0%
-
2.5%
]
2.37%
14,1905.8%
[
2.0%
-
2.5%
]
2.43%
8,9553.1%
[
2.5%
-
3.0%
]
2.56%
26,8146.7%
[
2.5%
-
3.0%
]
2.66%
15,3224.4%
[
2.5%
-
3.0%
]
2.72%
54,9812.5%
[
2.5%
-
3.0%
]
2.84%
5648.3%
[
2.5%
-
3.0%
]
2.92%
116,2256.4%
[
3.0%
-
3.5%
]
3.11%
5462.7%
[
3.0%
-
3.5%
]
3.14%
39,6216.6%
[
3.0%
-
3.5%
]
3.23%
4,8012.9%
[
3.0%
-
3.5%
]
3.34%
2,9676.9%
[
3.0%
-
3.5%
]
3.43%
42,0581.3%
[
3.5%
-
4.0%
]
3.71%
32,8817.7%
[
3.5%
-
4.0%
]
3.83%
26,4362.5%
[
3.5%
-
4.0%
]
3.98%
5,6254.4%
[
4.0%
-
4.5%
]
4.04%
23,7349.4%
[
4.0%
-
4.5%
]
4.15%
28910.5%
[
4.0%
-
4.5%
]
4.33%
1,64013.2%
[
4.5%
-
5.0%
]
4.55%
82,4003.4%
[
4.5%
-
5.0%
]
4.60%
16,4505.5%
[
5.0%
-
5.5%
]
5.15%
7,80010.7%
[
5.5%
-
6.0%
]
5.55%
8831.9%
[
6.0%
-
6.5%
]
6.03%
35,9674.4%
[
6.5%
-
7.0%
]
6.85%
3,5896.4%
[
7.5%
-
8.0%
]
7.99%
5,0304.6%
[
10.5%
-
11.0%
]
10.81%
14,6391.8%
[
10.5%
-
11.0%
]
10.86%
14,5721.8%