Belizean Disability Age 5 to 17

COMPARE

Belizean
Race
Ancestry
AfghanAfricanAlaska NativeAlaskan AthabascanAlbanianAleutAlsatianAmericanApacheArabArapahoArgentineanArmenianAssyrian/Chaldean/SyriacAustralianAustrianBahamianBangladeshiBarbadianBasqueBelgianBelizeanBermudanBhutaneseBlackfeetBolivianBrazilianBritishBritish West IndianBulgarianBurmeseCajunCambodianCanadianCape VerdeanCarpatho RusynCelticCentral AmericanCentral American IndianCherokeeCheyenneChickasawChileanChineseChippewaChoctawColombianColvilleComancheCosta RicanCreeCreekCroatianCrowCubanCypriotCzechCzechoslovakianDanishDelawareDominicanDutchDutch West IndianEastern EuropeanEcuadorianEgyptianEnglishEstonianEthiopianEuropeanFijianFilipinoFinnishFrenchFrench American IndianFrench CanadianGermanGerman RussianGhanaianGreekGuamanian/ChamorroGuatemalanGuyaneseHaitianHmongHonduranHopiHoumaHungarianIcelanderIndian (Asian)IndonesianInupiatIranianIraqiIrishIroquoisIsraeliItalianJamaicanJapaneseJordanianKenyanKiowaKoreanLaotianLatvianLebaneseLiberianLithuanianLumbeeLuxembourgerMacedonianMalaysianMalteseMarshalleseMenomineeMexicanMexican American IndianMongolianMoroccanNative HawaiianNavajoNepaleseNew ZealanderNicaraguanNigerianNorthern EuropeanNorwegianOkinawanOsageOttawaPaiutePakistaniPalestinianPanamanianParaguayanPennsylvania GermanPeruvianPimaPolishPortuguesePotawatomiPuebloPuerto RicanPuget Sound SalishRomanianRussianSalvadoranSamoanScandinavianScotch-IrishScottishSeminoleSenegaleseSerbianShoshoneSierra LeoneanSiouxSlavicSlovakSloveneSomaliSouth AfricanSouth AmericanSouth American IndianSoviet UnionSpaniardSpanishSpanish AmericanSpanish American IndianSri LankanSubsaharan AfricanSudaneseSwedishSwissSyrianTaiwaneseThaiTlingit-HaidaTohono O'OdhamTonganTrinidadian and TobagonianTsimshianTurkishU.S. Virgin IslanderUgandanUkrainianUruguayanUteVenezuelanVietnameseWelshWest IndianYakamaYaquiYugoslavianYumanYup'ikZimbabwean
Immigration
NonimmigrantsImmigrantsAfghanistanAfricaAlbaniaArgentinaArmeniaAsiaAustraliaAustriaBahamasBangladeshBarbadosBelarusBelgiumBelizeBoliviaBosnia and HerzegovinaBrazilBulgariaBurma/MyanmarCabo VerdeCambodiaCameroonCanadaCaribbeanCentral AmericaChileChinaColombiaCongoCosta RicaCroatiaCubaCzechoslovakiaDenmarkDominicaDominican RepublicEastern AfricaEastern AsiaEastern EuropeEcuadorEgyptEl SalvadorEnglandEritreaEthiopiaEuropeFijiFranceGermanyGhanaGreeceGrenadaGuatemalaGuyanaHaitiHondurasHong KongHungaryIndiaIndonesiaIranIraqIrelandIsraelItalyJamaicaJapanJordanKazakhstanKenyaKoreaKuwaitLaosLatin AmericaLatviaLebanonLiberiaLithuaniaMalaysiaMexicoMicronesiaMiddle AfricaMoldovaMoroccoNepalNetherlandsNicaraguaNigeriaNorth AmericaNorth MacedoniaNorthern AfricaNorthern EuropeNorwayOceaniaPakistanPanamaPeruPhilippinesPolandPortugalRomaniaRussiaSaudi ArabiaScotlandSenegalSerbiaSierra LeoneSingaporeSomaliaSouth AfricaSouth AmericaSouth Central AsiaSouth Eastern AsiaSouthern EuropeSpainSri LankaSt. Vincent and the GrenadinesSudanSwedenSwitzerlandSyriaTaiwanThailandTrinidad and TobagoTurkeyUgandaUkraineUruguayUzbekistanVenezuelaVietnamWest IndiesWestern AfricaWestern AsiaWestern EuropeYemenZaireZimbabweAzores
Select to Compare
Race
Ancestry
AfghanAfricanAlaska NativeAlaskan AthabascanAlbanianAleutAlsatianAmericanApacheArabArapahoArgentineanArmenianAssyrian/Chaldean/SyriacAustralianAustrianBahamianBangladeshiBarbadianBasqueBelgianBermudanBhutaneseBlackfeetBolivianBrazilianBritishBritish West IndianBulgarianBurmeseCajunCambodianCanadianCape VerdeanCarpatho RusynCelticCentral AmericanCentral American IndianCherokeeCheyenneChickasawChileanChineseChippewaChoctawColombianColvilleComancheCosta RicanCreeCreekCroatianCrowCubanCypriotCzechCzechoslovakianDanishDelawareDominicanDutchDutch West IndianEastern EuropeanEcuadorianEgyptianEnglishEstonianEthiopianEuropeanFijianFilipinoFinnishFrenchFrench American IndianFrench CanadianGermanGerman RussianGhanaianGreekGuamanian/ChamorroGuatemalanGuyaneseHaitianHmongHonduranHopiHoumaHungarianIcelanderIndian (Asian)IndonesianInupiatIranianIraqiIrishIroquoisIsraeliItalianJamaicanJapaneseJordanianKenyanKiowaKoreanLaotianLatvianLebaneseLiberianLithuanianLumbeeLuxembourgerMacedonianMalaysianMalteseMarshalleseMenomineeMexicanMexican American IndianMongolianMoroccanNative HawaiianNavajoNepaleseNew ZealanderNicaraguanNigerianNorthern EuropeanNorwegianOkinawanOsageOttawaPaiutePakistaniPalestinianPanamanianParaguayanPennsylvania GermanPeruvianPimaPolishPortuguesePotawatomiPuebloPuerto RicanPuget Sound SalishRomanianRussianSalvadoranSamoanScandinavianScotch-IrishScottishSeminoleSenegaleseSerbianShoshoneSierra LeoneanSiouxSlavicSlovakSloveneSomaliSouth AfricanSouth AmericanSouth American IndianSoviet UnionSpaniardSpanishSpanish AmericanSpanish American IndianSri LankanSubsaharan AfricanSudaneseSwedishSwissSyrianTaiwaneseThaiTlingit-HaidaTohono O'OdhamTonganTrinidadian and TobagonianTsimshianTurkishU.S. Virgin IslanderUgandanUkrainianUruguayanUteVenezuelanVietnameseWelshWest IndianYakamaYaquiYugoslavianYumanYup'ikZimbabwean
Immigration
NonimmigrantsImmigrantsAfghanistanAfricaAlbaniaArgentinaArmeniaAsiaAustraliaAustriaBahamasBangladeshBarbadosBelarusBelgiumBelizeBoliviaBosnia and HerzegovinaBrazilBulgariaBurma/MyanmarCabo VerdeCambodiaCameroonCanadaCaribbeanCentral AmericaChileChinaColombiaCongoCosta RicaCroatiaCubaCzechoslovakiaDenmarkDominicaDominican RepublicEastern AfricaEastern AsiaEastern EuropeEcuadorEgyptEl SalvadorEnglandEritreaEthiopiaEuropeFijiFranceGermanyGhanaGreeceGrenadaGuatemalaGuyanaHaitiHondurasHong KongHungaryIndiaIndonesiaIranIraqIrelandIsraelItalyJamaicaJapanJordanKazakhstanKenyaKoreaKuwaitLaosLatin AmericaLatviaLebanonLiberiaLithuaniaMalaysiaMexicoMicronesiaMiddle AfricaMoldovaMoroccoNepalNetherlandsNicaraguaNigeriaNorth AmericaNorth MacedoniaNorthern AfricaNorthern EuropeNorwayOceaniaPakistanPanamaPeruPhilippinesPolandPortugalRomaniaRussiaSaudi ArabiaScotlandSenegalSerbiaSierra LeoneSingaporeSomaliaSouth AfricaSouth AmericaSouth Central AsiaSouth Eastern AsiaSouthern EuropeSpainSri LankaSt. Vincent and the GrenadinesSudanSwedenSwitzerlandSyriaTaiwanThailandTrinidad and TobagoTurkeyUgandaUkraineUruguayUzbekistanVenezuelaVietnamWest IndiesWestern AfricaWestern AsiaWestern EuropeYemenZaireZimbabweAzores
Disability Age 5 to 17
Income
Poverty
Unemployment
Labor Participation
Family Structure
Vehicle Availability
Education Level
Disability

Belizean Disability Age 5 to 17
Exceptional

5.4%
DISABILITY | AGE 5 TO 17
90.8/ 100
METRIC RATING
139th/ 347
METRIC RANK

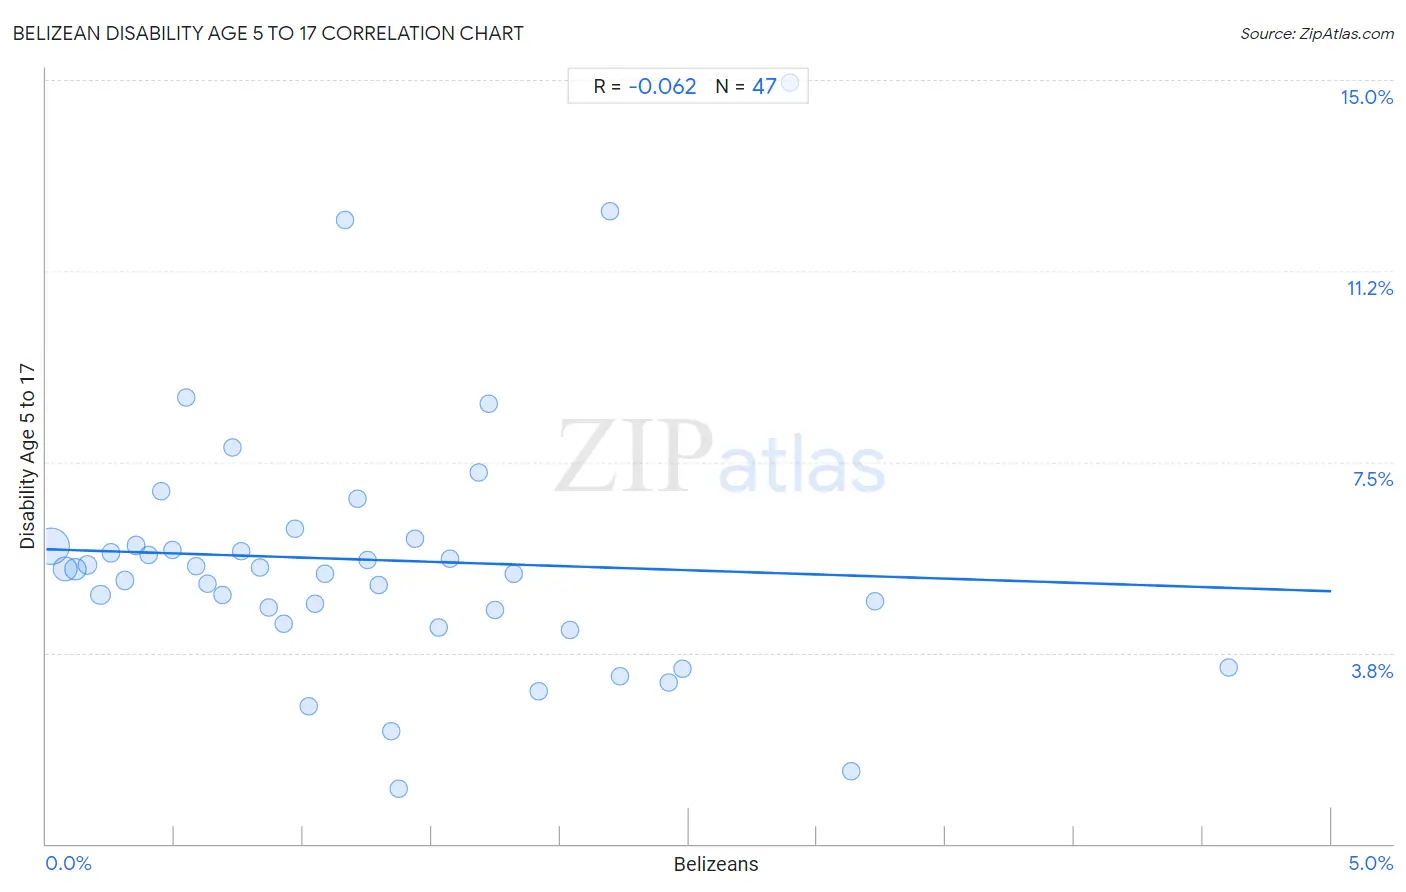
Belizean Disability Age 5 to 17 Correlation Chart

The statistical analysis conducted on geographies consisting of 143,880,682 people shows a slight negative correlation between the proportion of Belizeans and percentage of population with a disability between the ages 5 and 17 in the United States with a correlation coefficient (R) of -0.062 and weighted average of 5.4%. On average, for every 1% (one percent) increase in Belizeans within a typical geography, there is a decrease of 0.17% in percentage of population with a disability between the ages 5 and 17.
Belizean Disability Age 5 to 17
It is essential to understand that the correlation between the percentage of Belizeans and percentage of population with a disability between the ages 5 and 17 does not imply a direct cause-and-effect relationship. It remains uncertain whether the presence of Belizeans influences an upward or downward trend in the level of percentage of population with a disability between the ages 5 and 17 within an area, or if Belizeans simply ended up residing in those areas with higher or lower levels of percentage of population with a disability between the ages 5 and 17 due to other factors.

Demographics Similar to Belizeans by Disability Age 5 to 17

In terms of disability age 5 to 17, the demographic groups most similar to Belizeans are Immigrants from Oceania (5.4%, a difference of 0.0%), Navajo (5.4%, a difference of 0.010%), Immigrants from Netherlands (5.4%, a difference of 0.050%), Immigrants from Denmark (5.4%, a difference of 0.090%), and Immigrants from Belize (5.4%, a difference of 0.14%).
DemographicsRating | RankDisability Age 5 to 17
Immigrants from Colombia
92.9
/100
|
#132
Exceptional
5.4%
Venezuelans
92.7
/100
|
#133
Exceptional
5.4%
Yuman
92.3
/100
|
#134
Exceptional
5.4%
Immigrants from Belize
91.7
/100
|
#135
Exceptional
5.4%
Immigrants from Denmark
91.4
/100
|
#136
Exceptional
5.4%
Navajo
90.9
/100
|
#137
Exceptional
5.4%
Immigrants from Oceania
90.8
/100
|
#138
Exceptional
5.4%
Belizeans
90.8
/100
|
#139
Exceptional
5.4%
Immigrants from Netherlands
90.5
/100
|
#140
Exceptional
5.4%
South American Indians
89.3
/100
|
#141
Excellent
5.5%
Colombians
88.0
/100
|
#142
Excellent
5.5%
Immigrants from Hungary
87.9
/100
|
#143
Excellent
5.5%
Pakistanis
87.3
/100
|
#144
Excellent
5.5%
Immigrants from Guatemala
86.6
/100
|
#145
Excellent
5.5%
Albanians
83.7
/100
|
#146
Excellent
5.5%

Belizean Disability Age 5 to 17 Correlation Summary

MeasurementBelizean DataDisability Age 5 to 17 Data
Minimum0.018%1.1%
Maximum4.6%14.9%
Range4.6%13.9%
Mean1.3%5.6%
Median1.1%5.4%
Interquartile 25% (IQ1)0.55%4.3%
Interquartile 75% (IQ3)1.7%5.9%
Interquartile Range (IQR)1.2%1.5%
Standard Deviation (Sample)0.96%2.6%
Standard Deviation (Population)0.95%2.5%

Correlation Details

Belizean PercentileSample SizeDisability Age 5 to 17
[
0.0%
-
0.5%
]
0.018%
83,024,0895.9%
[
0.0%
-
0.5%
]
0.073%
26,164,1235.4%
[
0.0%
-
0.5%
]
0.11%
12,836,7895.4%
[
0.0%
-
0.5%
]
0.16%
5,912,2275.5%
[
0.0%
-
0.5%
]
0.21%
6,742,4324.9%
[
0.0%
-
0.5%
]
0.25%
2,320,8255.7%
[
0.0%
-
0.5%
]
0.31%
1,272,5615.2%
[
0.0%
-
0.5%
]
0.35%
1,545,8845.9%
[
0.0%
-
0.5%
]
0.40%
573,7265.7%
[
0.0%
-
0.5%
]
0.45%
306,0836.9%
[
0.0%
-
0.5%
]
0.49%
601,8195.8%
[
0.5%
-
1.0%
]
0.55%
130,7028.8%
[
0.5%
-
1.0%
]
0.58%
454,5465.4%
[
0.5%
-
1.0%
]
0.63%
108,0965.1%
[
0.5%
-
1.0%
]
0.69%
163,3414.9%
[
0.5%
-
1.0%
]
0.72%
178,1307.8%
[
0.5%
-
1.0%
]
0.76%
96,1865.8%
[
0.5%
-
1.0%
]
0.83%
97,5365.4%
[
0.5%
-
1.0%
]
0.87%
146,6494.7%
[
0.5%
-
1.0%
]
0.92%
89,1954.3%
[
0.5%
-
1.0%
]
0.97%
169,2696.2%
[
1.0%
-
1.5%
]
1.02%
76,3382.7%
[
1.0%
-
1.5%
]
1.05%
44,0934.7%
[
1.0%
-
1.5%
]
1.09%
117,8675.3%
[
1.0%
-
1.5%
]
1.16%
19,50212.3%
[
1.0%
-
1.5%
]
1.21%
18,0516.8%
[
1.0%
-
1.5%
]
1.25%
86,6735.6%
[
1.0%
-
1.5%
]
1.29%
76,9415.1%
[
1.0%
-
1.5%
]
1.34%
62,7802.2%
[
1.0%
-
1.5%
]
1.37%
1,9661.1%
[
1.0%
-
1.5%
]
1.44%
4,9466.0%
[
1.5%
-
2.0%
]
1.53%
115,8584.2%
[
1.5%
-
2.0%
]
1.57%
15,4765.6%
[
1.5%
-
2.0%
]
1.68%
32,2297.3%
[
1.5%
-
2.0%
]
1.72%
50,0248.6%
[
1.5%
-
2.0%
]
1.75%
43,0924.6%
[
1.5%
-
2.0%
]
1.82%
12,6515.3%
[
1.5%
-
2.0%
]
1.92%
49,8983.0%
[
2.0%
-
2.5%
]
2.04%
7,7024.2%
[
2.0%
-
2.5%
]
2.19%
15,13212.4%
[
2.0%
-
2.5%
]
2.23%
22,0593.3%
[
2.0%
-
2.5%
]
2.42%
20,3363.2%
[
2.0%
-
2.5%
]
2.48%
45,3223.4%
[
2.5%
-
3.0%
]
2.89%
1,10614.9%
[
3.0%
-
3.5%
]
3.13%
2,2041.4%
[
3.0%
-
3.5%
]
3.22%
1,4894.8%
[
4.5%
-
5.0%
]
4.60%
2,7393.5%