Immigrants from Yemen Disability Age 5 to 17

COMPARE

Immigrants from Yemen
Race
Ancestry
AfghanAfricanAlaska NativeAlaskan AthabascanAlbanianAleutAlsatianAmericanApacheArabArapahoArgentineanArmenianAssyrian/Chaldean/SyriacAustralianAustrianBahamianBangladeshiBarbadianBasqueBelgianBelizeanBermudanBhutaneseBlackfeetBolivianBrazilianBritishBritish West IndianBulgarianBurmeseCajunCambodianCanadianCape VerdeanCarpatho RusynCelticCentral AmericanCentral American IndianCherokeeCheyenneChickasawChileanChineseChippewaChoctawColombianColvilleComancheCosta RicanCreeCreekCroatianCrowCubanCypriotCzechCzechoslovakianDanishDelawareDominicanDutchDutch West IndianEastern EuropeanEcuadorianEgyptianEnglishEstonianEthiopianEuropeanFijianFilipinoFinnishFrenchFrench American IndianFrench CanadianGermanGerman RussianGhanaianGreekGuamanian/ChamorroGuatemalanGuyaneseHaitianHmongHonduranHopiHoumaHungarianIcelanderIndian (Asian)IndonesianInupiatIranianIraqiIrishIroquoisIsraeliItalianJamaicanJapaneseJordanianKenyanKiowaKoreanLaotianLatvianLebaneseLiberianLithuanianLumbeeLuxembourgerMacedonianMalaysianMalteseMarshalleseMenomineeMexicanMexican American IndianMongolianMoroccanNative HawaiianNavajoNepaleseNew ZealanderNicaraguanNigerianNorthern EuropeanNorwegianOkinawanOsageOttawaPaiutePakistaniPalestinianPanamanianParaguayanPennsylvania GermanPeruvianPimaPolishPortuguesePotawatomiPuebloPuerto RicanPuget Sound SalishRomanianRussianSalvadoranSamoanScandinavianScotch-IrishScottishSeminoleSenegaleseSerbianShoshoneSierra LeoneanSiouxSlavicSlovakSloveneSomaliSouth AfricanSouth AmericanSouth American IndianSoviet UnionSpaniardSpanishSpanish AmericanSpanish American IndianSri LankanSubsaharan AfricanSudaneseSwedishSwissSyrianTaiwaneseThaiTlingit-HaidaTohono O'OdhamTonganTrinidadian and TobagonianTsimshianTurkishU.S. Virgin IslanderUgandanUkrainianUruguayanUteVenezuelanVietnameseWelshWest IndianYakamaYaquiYugoslavianYumanYup'ikZimbabwean
Immigration
NonimmigrantsImmigrantsAfghanistanAfricaAlbaniaArgentinaArmeniaAsiaAustraliaAustriaBahamasBangladeshBarbadosBelarusBelgiumBelizeBoliviaBosnia and HerzegovinaBrazilBulgariaBurma/MyanmarCabo VerdeCambodiaCameroonCanadaCaribbeanCentral AmericaChileChinaColombiaCongoCosta RicaCroatiaCubaCzechoslovakiaDenmarkDominicaDominican RepublicEastern AfricaEastern AsiaEastern EuropeEcuadorEgyptEl SalvadorEnglandEritreaEthiopiaEuropeFijiFranceGermanyGhanaGreeceGrenadaGuatemalaGuyanaHaitiHondurasHong KongHungaryIndiaIndonesiaIranIraqIrelandIsraelItalyJamaicaJapanJordanKazakhstanKenyaKoreaKuwaitLaosLatin AmericaLatviaLebanonLiberiaLithuaniaMalaysiaMexicoMicronesiaMiddle AfricaMoldovaMoroccoNepalNetherlandsNicaraguaNigeriaNorth AmericaNorth MacedoniaNorthern AfricaNorthern EuropeNorwayOceaniaPakistanPanamaPeruPhilippinesPolandPortugalRomaniaRussiaSaudi ArabiaScotlandSenegalSerbiaSierra LeoneSingaporeSomaliaSouth AfricaSouth AmericaSouth Central AsiaSouth Eastern AsiaSouthern EuropeSpainSri LankaSt. Vincent and the GrenadinesSudanSwedenSwitzerlandSyriaTaiwanThailandTrinidad and TobagoTurkeyUgandaUkraineUruguayUzbekistanVenezuelaVietnamWest IndiesWestern AfricaWestern AsiaWestern EuropeYemenZaireZimbabweAzores
Select to Compare
Race
Ancestry
AfghanAfricanAlaska NativeAlaskan AthabascanAlbanianAleutAlsatianAmericanApacheArabArapahoArgentineanArmenianAssyrian/Chaldean/SyriacAustralianAustrianBahamianBangladeshiBarbadianBasqueBelgianBelizeanBermudanBhutaneseBlackfeetBolivianBrazilianBritishBritish West IndianBulgarianBurmeseCajunCambodianCanadianCape VerdeanCarpatho RusynCelticCentral AmericanCentral American IndianCherokeeCheyenneChickasawChileanChineseChippewaChoctawColombianColvilleComancheCosta RicanCreeCreekCroatianCrowCubanCypriotCzechCzechoslovakianDanishDelawareDominicanDutchDutch West IndianEastern EuropeanEcuadorianEgyptianEnglishEstonianEthiopianEuropeanFijianFilipinoFinnishFrenchFrench American IndianFrench CanadianGermanGerman RussianGhanaianGreekGuamanian/ChamorroGuatemalanGuyaneseHaitianHmongHonduranHopiHoumaHungarianIcelanderIndian (Asian)IndonesianInupiatIranianIraqiIrishIroquoisIsraeliItalianJamaicanJapaneseJordanianKenyanKiowaKoreanLaotianLatvianLebaneseLiberianLithuanianLumbeeLuxembourgerMacedonianMalaysianMalteseMarshalleseMenomineeMexicanMexican American IndianMongolianMoroccanNative HawaiianNavajoNepaleseNew ZealanderNicaraguanNigerianNorthern EuropeanNorwegianOkinawanOsageOttawaPaiutePakistaniPalestinianPanamanianParaguayanPennsylvania GermanPeruvianPimaPolishPortuguesePotawatomiPuebloPuerto RicanPuget Sound SalishRomanianRussianSalvadoranSamoanScandinavianScotch-IrishScottishSeminoleSenegaleseSerbianShoshoneSierra LeoneanSiouxSlavicSlovakSloveneSomaliSouth AfricanSouth AmericanSouth American IndianSoviet UnionSpaniardSpanishSpanish AmericanSpanish American IndianSri LankanSubsaharan AfricanSudaneseSwedishSwissSyrianTaiwaneseThaiTlingit-HaidaTohono O'OdhamTonganTrinidadian and TobagonianTsimshianTurkishU.S. Virgin IslanderUgandanUkrainianUruguayanUteVenezuelanVietnameseWelshWest IndianYakamaYaquiYugoslavianYumanYup'ikZimbabwean
Immigration
NonimmigrantsImmigrantsAfghanistanAfricaAlbaniaArgentinaArmeniaAsiaAustraliaAustriaBahamasBangladeshBarbadosBelarusBelgiumBelizeBoliviaBosnia and HerzegovinaBrazilBulgariaBurma/MyanmarCabo VerdeCambodiaCameroonCanadaCaribbeanCentral AmericaChileChinaColombiaCongoCosta RicaCroatiaCubaCzechoslovakiaDenmarkDominicaDominican RepublicEastern AfricaEastern AsiaEastern EuropeEcuadorEgyptEl SalvadorEnglandEritreaEthiopiaEuropeFijiFranceGermanyGhanaGreeceGrenadaGuatemalaGuyanaHaitiHondurasHong KongHungaryIndiaIndonesiaIranIraqIrelandIsraelItalyJamaicaJapanJordanKazakhstanKenyaKoreaKuwaitLaosLatin AmericaLatviaLebanonLiberiaLithuaniaMalaysiaMexicoMicronesiaMiddle AfricaMoldovaMoroccoNepalNetherlandsNicaraguaNigeriaNorth AmericaNorth MacedoniaNorthern AfricaNorthern EuropeNorwayOceaniaPakistanPanamaPeruPhilippinesPolandPortugalRomaniaRussiaSaudi ArabiaScotlandSenegalSerbiaSierra LeoneSingaporeSomaliaSouth AfricaSouth AmericaSouth Central AsiaSouth Eastern AsiaSouthern EuropeSpainSri LankaSt. Vincent and the GrenadinesSudanSwedenSwitzerlandSyriaTaiwanThailandTrinidad and TobagoTurkeyUgandaUkraineUruguayUzbekistanVenezuelaVietnamWest IndiesWestern AfricaWestern AsiaWestern EuropeZaireZimbabweAzores
Disability Age 5 to 17
Income
Poverty
Unemployment
Labor Participation
Family Structure
Vehicle Availability
Education Level
Disability

Immigrants from Yemen Disability Age 5 to 17
Exceptional

5.3%
DISABILITY | AGE 5 TO 17
98.2/ 100
METRIC RATING
106th/ 347
METRIC RANK

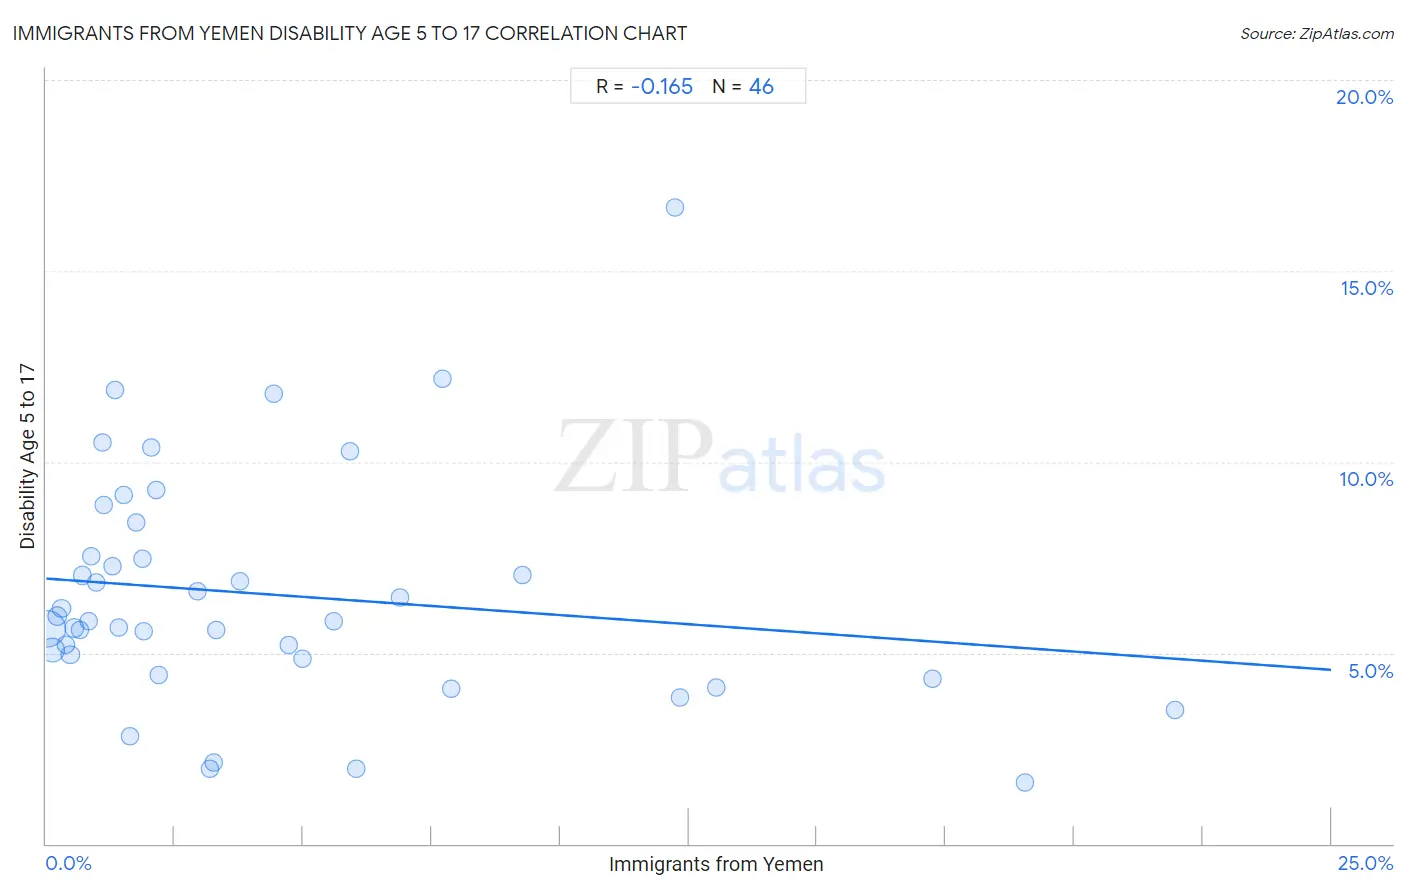
Immigrants from Yemen Disability Age 5 to 17 Correlation Chart

The statistical analysis conducted on geographies consisting of 82,306,406 people shows a poor negative correlation between the proportion of Immigrants from Yemen and percentage of population with a disability between the ages 5 and 17 in the United States with a correlation coefficient (R) of -0.165 and weighted average of 5.3%. On average, for every 1% (one percent) increase in Immigrants from Yemen within a typical geography, there is a decrease of 0.096% in percentage of population with a disability between the ages 5 and 17.
Immigrants from Yemen Disability Age 5 to 17
It is essential to understand that the correlation between the percentage of Immigrants from Yemen and percentage of population with a disability between the ages 5 and 17 does not imply a direct cause-and-effect relationship. It remains uncertain whether the presence of Immigrants from Yemen influences an upward or downward trend in the level of percentage of population with a disability between the ages 5 and 17 within an area, or if Immigrants from Yemen simply ended up residing in those areas with higher or lower levels of percentage of population with a disability between the ages 5 and 17 due to other factors.

Demographics Similar to Immigrants from Yemen by Disability Age 5 to 17

In terms of disability age 5 to 17, the demographic groups most similar to Immigrants from Yemen are Russian (5.3%, a difference of 0.030%), Immigrants from South Africa (5.3%, a difference of 0.070%), Immigrants from Northern Africa (5.3%, a difference of 0.11%), Immigrants from Italy (5.3%, a difference of 0.13%), and Immigrants from Eritrea (5.3%, a difference of 0.16%).
DemographicsRating | RankDisability Age 5 to 17
Cambodians
98.8
/100
|
#99
Exceptional
5.3%
Nepalese
98.7
/100
|
#100
Exceptional
5.3%
Menominee
98.7
/100
|
#101
Exceptional
5.3%
Nicaraguans
98.6
/100
|
#102
Exceptional
5.3%
Salvadorans
98.6
/100
|
#103
Exceptional
5.3%
Peruvians
98.5
/100
|
#104
Exceptional
5.3%
Immigrants from Italy
98.4
/100
|
#105
Exceptional
5.3%
Immigrants from Yemen
98.2
/100
|
#106
Exceptional
5.3%
Russians
98.2
/100
|
#107
Exceptional
5.3%
Immigrants from South Africa
98.1
/100
|
#108
Exceptional
5.3%
Immigrants from Northern Africa
98.1
/100
|
#109
Exceptional
5.3%
Immigrants from Eritrea
98.0
/100
|
#110
Exceptional
5.3%
Ethiopians
97.9
/100
|
#111
Exceptional
5.3%
Immigrants from Latvia
97.9
/100
|
#112
Exceptional
5.3%
Aleuts
97.8
/100
|
#113
Exceptional
5.3%

Immigrants from Yemen Disability Age 5 to 17 Correlation Summary

MeasurementImmigrants from Yemen DataDisability Age 5 to 17 Data
Minimum0.021%1.6%
Maximum22.0%16.7%
Range21.9%15.1%
Mean4.4%6.5%
Median2.1%5.8%
Interquartile 25% (IQ1)0.97%4.8%
Interquartile 75% (IQ3)5.9%7.5%
Interquartile Range (IQR)4.9%2.7%
Standard Deviation (Sample)5.2%3.0%
Standard Deviation (Population)5.2%3.0%

Correlation Details

Immigrants from Yemen PercentileSample SizeDisability Age 5 to 17
[
0.0%
-
0.5%
]
0.021%
52,149,0315.6%
[
0.0%
-
0.5%
]
0.12%
17,213,9535.1%
[
0.0%
-
0.5%
]
0.21%
4,583,1746.0%
[
0.0%
-
0.5%
]
0.29%
2,106,1076.2%
[
0.0%
-
0.5%
]
0.38%
1,733,7225.2%
[
0.0%
-
0.5%
]
0.46%
1,562,5795.0%
[
0.5%
-
1.0%
]
0.55%
507,7125.6%
[
0.5%
-
1.0%
]
0.66%
280,3645.6%
[
0.5%
-
1.0%
]
0.70%
887,7467.0%
[
0.5%
-
1.0%
]
0.82%
218,0075.8%
[
0.5%
-
1.0%
]
0.88%
43,7327.5%
[
0.5%
-
1.0%
]
0.97%
124,2926.8%
[
1.0%
-
1.5%
]
1.09%
49,14110.5%
[
1.0%
-
1.5%
]
1.13%
64,1998.9%
[
1.0%
-
1.5%
]
1.28%
7027.3%
[
1.0%
-
1.5%
]
1.33%
17,99211.9%
[
1.0%
-
1.5%
]
1.42%
78,3235.7%
[
1.0%
-
1.5%
]
1.50%
83,6529.1%
[
1.5%
-
2.0%
]
1.62%
8,3872.8%
[
1.5%
-
2.0%
]
1.76%
20,5038.4%
[
1.5%
-
2.0%
]
1.88%
78,1637.5%
[
1.5%
-
2.0%
]
1.90%
12,7715.6%
[
2.0%
-
2.5%
]
2.03%
23,56510.4%
[
2.0%
-
2.5%
]
2.14%
16,8969.3%
[
2.0%
-
2.5%
]
2.20%
42,5484.4%
[
2.5%
-
3.0%
]
2.93%
8,2846.6%
[
3.0%
-
3.5%
]
3.18%
1,8892.0%
[
3.0%
-
3.5%
]
3.27%
1,8372.1%
[
3.0%
-
3.5%
]
3.31%
2,6305.6%
[
3.5%
-
4.0%
]
3.77%
24,9906.9%
[
4.0%
-
4.5%
]
4.42%
2,48711.8%
[
4.5%
-
5.0%
]
4.71%
20,9365.2%
[
4.5%
-
5.0%
]
4.99%
19,7624.8%
[
5.5%
-
6.0%
]
5.60%
26,5475.8%
[
5.5%
-
6.0%
]
5.91%
1,30310.3%
[
6.0%
-
6.5%
]
6.02%
25,2782.0%
[
6.5%
-
7.0%
]
6.88%
13,7046.5%
[
7.5%
-
8.0%
]
7.71%
77812.2%
[
7.5%
-
8.0%
]
7.89%
108,4144.1%
[
9.0%
-
9.5%
]
9.28%
1,1327.0%
[
12.0%
-
12.5%
]
12.22%
63016.7%
[
12.0%
-
12.5%
]
12.32%
53,0443.8%
[
13.0%
-
13.5%
]
13.03%
43,2134.1%
[
17.0%
-
17.5%
]
17.25%
27,8424.3%
[
19.0%
-
19.5%
]
19.05%
8,9191.6%
[
21.5%
-
22.0%
]
21.97%
5,5263.5%