Immigrants from Western Asia Disability Age 5 to 17
COMPARE
Immigrants from Western Asia
Select to Compare
Disability Age 5 to 17
Immigrants from Western Asia Disability Age 5 to 17
5.1%
DISABILITY | AGE 5 TO 17
100.0/ 100
METRIC RATING
49th/ 347
METRIC RANK
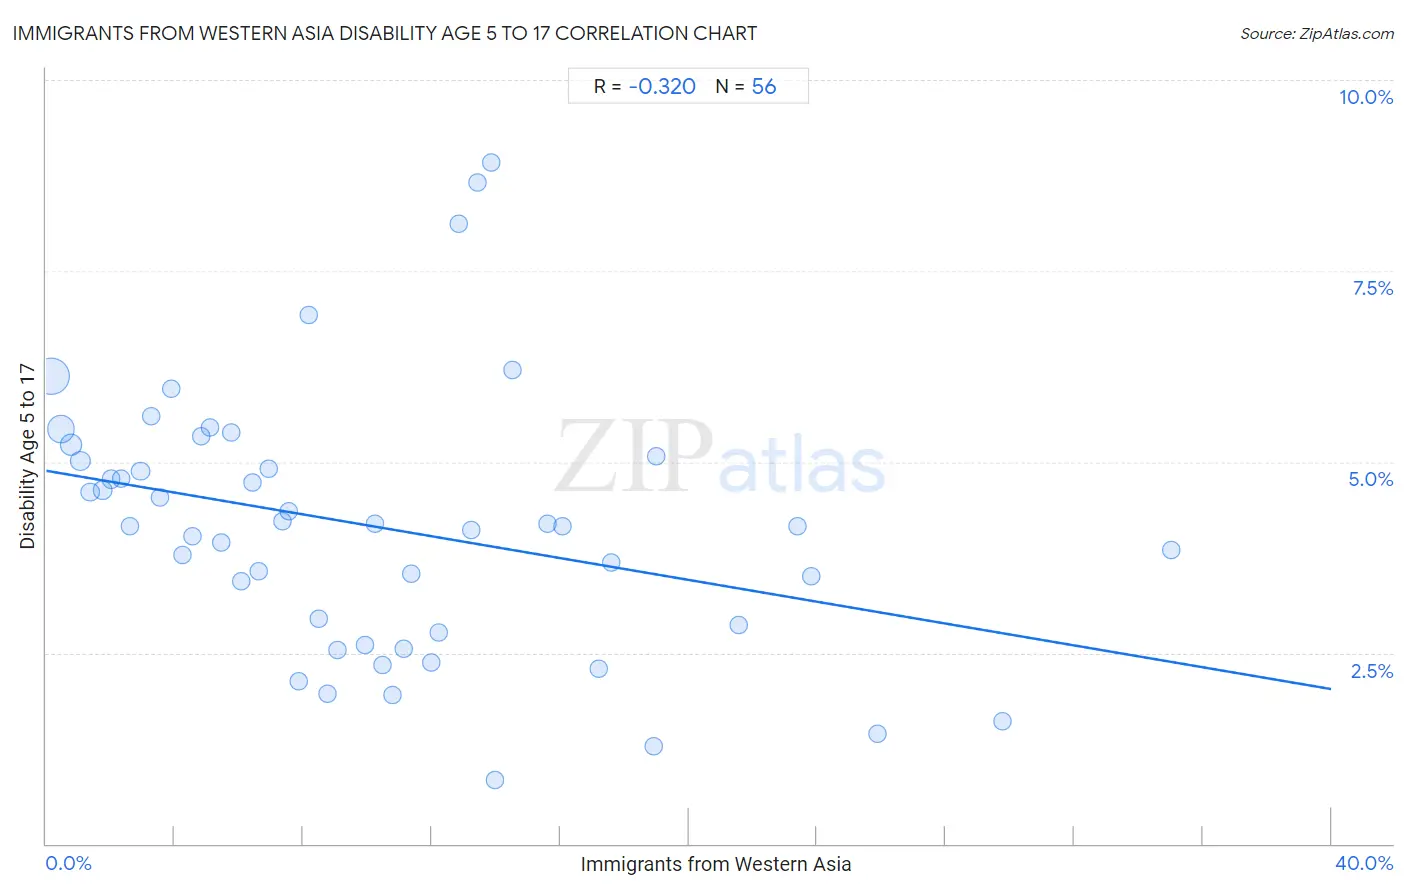
Immigrants from Western Asia Disability Age 5 to 17 Correlation Chart
The statistical analysis conducted on geographies consisting of 400,987,262 people shows a mild negative correlation between the proportion of Immigrants from Western Asia and percentage of population with a disability between the ages 5 and 17 in the United States with a correlation coefficient (R) of -0.320 and weighted average of 5.1%. On average, for every 1% (one percent) increase in Immigrants from Western Asia within a typical geography, there is a decrease of 0.071% in percentage of population with a disability between the ages 5 and 17.
It is essential to understand that the correlation between the percentage of Immigrants from Western Asia and percentage of population with a disability between the ages 5 and 17 does not imply a direct cause-and-effect relationship. It remains uncertain whether the presence of Immigrants from Western Asia influences an upward or downward trend in the level of percentage of population with a disability between the ages 5 and 17 within an area, or if Immigrants from Western Asia simply ended up residing in those areas with higher or lower levels of percentage of population with a disability between the ages 5 and 17 due to other factors.
Demographics Similar to Immigrants from Western Asia by Disability Age 5 to 17
In terms of disability age 5 to 17, the demographic groups most similar to Immigrants from Western Asia are Korean (5.1%, a difference of 0.080%), Vietnamese (5.1%, a difference of 0.27%), Assyrian/Chaldean/Syriac (5.0%, a difference of 0.39%), Argentinean (5.1%, a difference of 0.41%), and Tongan (5.0%, a difference of 0.46%).
| Demographics | Rating | Rank | Disability Age 5 to 17 |
| Immigrants from Sri Lanka | 100.0 /100 | #42 | Exceptional 5.0% |
| Immigrants from Russia | 100.0 /100 | #43 | Exceptional 5.0% |
| Egyptians | 100.0 /100 | #44 | Exceptional 5.0% |
| Tongans | 100.0 /100 | #45 | Exceptional 5.0% |
| Assyrians/Chaldeans/Syriacs | 100.0 /100 | #46 | Exceptional 5.0% |
| Vietnamese | 100.0 /100 | #47 | Exceptional 5.1% |
| Koreans | 100.0 /100 | #48 | Exceptional 5.1% |
| Immigrants from Western Asia | 100.0 /100 | #49 | Exceptional 5.1% |
| Argentineans | 99.9 /100 | #50 | Exceptional 5.1% |
| Turks | 99.9 /100 | #51 | Exceptional 5.1% |
| Immigrants from Fiji | 99.9 /100 | #52 | Exceptional 5.1% |
| Immigrants from Lithuania | 99.9 /100 | #53 | Exceptional 5.1% |
| Paraguayans | 99.9 /100 | #54 | Exceptional 5.1% |
| Laotians | 99.9 /100 | #55 | Exceptional 5.1% |
| Immigrants from Turkey | 99.9 /100 | #56 | Exceptional 5.1% |
Immigrants from Western Asia Disability Age 5 to 17 Correlation Summary
| Measurement | Immigrants from Western Asia Data | Disability Age 5 to 17 Data |
| Minimum | 0.14% | 0.84% |
| Maximum | 35.0% | 8.9% |
| Range | 34.9% | 8.1% |
| Mean | 10.2% | 4.2% |
| Median | 8.6% | 4.2% |
| Interquartile 25% (IQ1) | 4.4% | 2.8% |
| Interquartile 75% (IQ3) | 13.9% | 5.0% |
| Interquartile Range (IQR) | 9.5% | 2.2% |
| Standard Deviation (Sample) | 7.7% | 1.7% |
| Standard Deviation (Population) | 7.6% | 1.7% |
Correlation Details
| Immigrants from Western Asia Percentile | Sample Size | Disability Age 5 to 17 |
[ 0.0% - 0.5% ] 0.14% | 202,101,497 | 6.1% |
[ 0.0% - 0.5% ] 0.45% | 101,194,897 | 5.4% |
[ 0.5% - 1.0% ] 0.78% | 44,909,417 | 5.2% |
[ 1.0% - 1.5% ] 1.07% | 19,342,998 | 5.0% |
[ 1.0% - 1.5% ] 1.38% | 9,231,438 | 4.6% |
[ 1.5% - 2.0% ] 1.76% | 9,867,120 | 4.6% |
[ 2.0% - 2.5% ] 2.01% | 3,522,609 | 4.8% |
[ 2.0% - 2.5% ] 2.32% | 2,272,307 | 4.8% |
[ 2.5% - 3.0% ] 2.61% | 1,494,308 | 4.2% |
[ 2.5% - 3.0% ] 2.94% | 1,406,507 | 4.9% |
[ 3.0% - 3.5% ] 3.28% | 895,571 | 5.6% |
[ 3.5% - 4.0% ] 3.56% | 581,072 | 4.5% |
[ 3.5% - 4.0% ] 3.90% | 284,720 | 6.0% |
[ 4.0% - 4.5% ] 4.25% | 489,725 | 3.8% |
[ 4.5% - 5.0% ] 4.54% | 281,299 | 4.0% |
[ 4.5% - 5.0% ] 4.81% | 167,401 | 5.3% |
[ 5.0% - 5.5% ] 5.09% | 298,567 | 5.5% |
[ 5.0% - 5.5% ] 5.43% | 101,188 | 3.9% |
[ 5.5% - 6.0% ] 5.77% | 268,448 | 5.4% |
[ 6.0% - 6.5% ] 6.08% | 187,917 | 3.4% |
[ 6.0% - 6.5% ] 6.44% | 120,665 | 4.7% |
[ 6.5% - 7.0% ] 6.60% | 148,692 | 3.6% |
[ 6.5% - 7.0% ] 6.94% | 97,305 | 4.9% |
[ 7.0% - 7.5% ] 7.35% | 102,180 | 4.2% |
[ 7.5% - 8.0% ] 7.54% | 74,265 | 4.4% |
[ 7.5% - 8.0% ] 7.84% | 37,339 | 2.1% |
[ 8.0% - 8.5% ] 8.17% | 87,848 | 6.9% |
[ 8.0% - 8.5% ] 8.48% | 11,326 | 3.0% |
[ 8.5% - 9.0% ] 8.77% | 25,278 | 2.0% |
[ 9.0% - 9.5% ] 9.06% | 49,028 | 2.5% |
[ 9.5% - 10.0% ] 9.92% | 1,975 | 2.6% |
[ 10.0% - 10.5% ] 10.23% | 52,786 | 4.2% |
[ 10.0% - 10.5% ] 10.49% | 11,091 | 2.3% |
[ 10.5% - 11.0% ] 10.77% | 22,430 | 2.0% |
[ 11.0% - 11.5% ] 11.14% | 45,937 | 2.6% |
[ 11.0% - 11.5% ] 11.36% | 61,447 | 3.5% |
[ 12.0% - 12.5% ] 12.00% | 21,680 | 2.4% |
[ 12.0% - 12.5% ] 12.23% | 33,804 | 2.8% |
[ 12.5% - 13.0% ] 12.83% | 34,921 | 8.1% |
[ 13.0% - 13.5% ] 13.24% | 43,863 | 4.1% |
[ 13.0% - 13.5% ] 13.42% | 59,775 | 8.7% |
[ 13.5% - 14.0% ] 13.84% | 105,950 | 8.9% |
[ 13.5% - 14.0% ] 13.99% | 18,445 | 0.84% |
[ 14.5% - 15.0% ] 14.53% | 146,149 | 6.2% |
[ 15.5% - 16.0% ] 15.62% | 16,679 | 4.2% |
[ 16.0% - 16.5% ] 16.05% | 62,474 | 4.2% |
[ 17.0% - 17.5% ] 17.18% | 194,512 | 2.3% |
[ 17.5% - 18.0% ] 17.59% | 50,005 | 3.7% |
[ 18.5% - 19.0% ] 18.92% | 32,294 | 1.3% |
[ 18.5% - 19.0% ] 18.99% | 22,831 | 5.1% |
[ 21.5% - 22.0% ] 21.57% | 40,392 | 2.9% |
[ 23.0% - 23.5% ] 23.38% | 151,646 | 4.1% |
[ 23.5% - 24.0% ] 23.81% | 5,526 | 3.5% |
[ 25.5% - 26.0% ] 25.87% | 35,755 | 1.4% |
[ 29.5% - 30.0% ] 29.76% | 8,919 | 1.6% |
[ 35.0% - 35.5% ] 35.02% | 53,044 | 3.8% |