Ukrainian Disability Age 5 to 17

COMPARE

Ukrainian
Race
Ancestry
AfghanAfricanAlaska NativeAlaskan AthabascanAlbanianAleutAlsatianAmericanApacheArabArapahoArgentineanArmenianAssyrian/Chaldean/SyriacAustralianAustrianBahamianBangladeshiBarbadianBasqueBelgianBelizeanBermudanBhutaneseBlackfeetBolivianBrazilianBritishBritish West IndianBulgarianBurmeseCajunCambodianCanadianCape VerdeanCarpatho RusynCelticCentral AmericanCentral American IndianCherokeeCheyenneChickasawChileanChineseChippewaChoctawColombianColvilleComancheCosta RicanCreeCreekCroatianCrowCubanCypriotCzechCzechoslovakianDanishDelawareDominicanDutchDutch West IndianEastern EuropeanEcuadorianEgyptianEnglishEstonianEthiopianEuropeanFijianFilipinoFinnishFrenchFrench American IndianFrench CanadianGermanGerman RussianGhanaianGreekGuamanian/ChamorroGuatemalanGuyaneseHaitianHmongHonduranHopiHoumaHungarianIcelanderIndian (Asian)IndonesianInupiatIranianIraqiIrishIroquoisIsraeliItalianJamaicanJapaneseJordanianKenyanKiowaKoreanLaotianLatvianLebaneseLiberianLithuanianLumbeeLuxembourgerMacedonianMalaysianMalteseMarshalleseMenomineeMexicanMexican American IndianMongolianMoroccanNative HawaiianNavajoNepaleseNew ZealanderNicaraguanNigerianNorthern EuropeanNorwegianOkinawanOsageOttawaPaiutePakistaniPalestinianPanamanianParaguayanPennsylvania GermanPeruvianPimaPolishPortuguesePotawatomiPuebloPuerto RicanPuget Sound SalishRomanianRussianSalvadoranSamoanScandinavianScotch-IrishScottishSeminoleSenegaleseSerbianShoshoneSierra LeoneanSiouxSlavicSlovakSloveneSomaliSouth AfricanSouth AmericanSouth American IndianSoviet UnionSpaniardSpanishSpanish AmericanSpanish American IndianSri LankanSubsaharan AfricanSudaneseSwedishSwissSyrianTaiwaneseThaiTlingit-HaidaTohono O'OdhamTonganTrinidadian and TobagonianTsimshianTurkishU.S. Virgin IslanderUgandanUkrainianUruguayanUteVenezuelanVietnameseWelshWest IndianYakamaYaquiYugoslavianYumanYup'ikZimbabwean
Immigration
NonimmigrantsImmigrantsAfghanistanAfricaAlbaniaArgentinaArmeniaAsiaAustraliaAustriaBahamasBangladeshBarbadosBelarusBelgiumBelizeBoliviaBosnia and HerzegovinaBrazilBulgariaBurma/MyanmarCabo VerdeCambodiaCameroonCanadaCaribbeanCentral AmericaChileChinaColombiaCongoCosta RicaCroatiaCubaCzechoslovakiaDenmarkDominicaDominican RepublicEastern AfricaEastern AsiaEastern EuropeEcuadorEgyptEl SalvadorEnglandEritreaEthiopiaEuropeFijiFranceGermanyGhanaGreeceGrenadaGuatemalaGuyanaHaitiHondurasHong KongHungaryIndiaIndonesiaIranIraqIrelandIsraelItalyJamaicaJapanJordanKazakhstanKenyaKoreaKuwaitLaosLatin AmericaLatviaLebanonLiberiaLithuaniaMalaysiaMexicoMicronesiaMiddle AfricaMoldovaMoroccoNepalNetherlandsNicaraguaNigeriaNorth AmericaNorth MacedoniaNorthern AfricaNorthern EuropeNorwayOceaniaPakistanPanamaPeruPhilippinesPolandPortugalRomaniaRussiaSaudi ArabiaScotlandSenegalSerbiaSierra LeoneSingaporeSomaliaSouth AfricaSouth AmericaSouth Central AsiaSouth Eastern AsiaSouthern EuropeSpainSri LankaSt. Vincent and the GrenadinesSudanSwedenSwitzerlandSyriaTaiwanThailandTrinidad and TobagoTurkeyUgandaUkraineUruguayUzbekistanVenezuelaVietnamWest IndiesWestern AfricaWestern AsiaWestern EuropeYemenZaireZimbabweAzores
Select to Compare
Race
Ancestry
AfghanAfricanAlaska NativeAlaskan AthabascanAlbanianAleutAlsatianAmericanApacheArabArapahoArgentineanArmenianAssyrian/Chaldean/SyriacAustralianAustrianBahamianBangladeshiBarbadianBasqueBelgianBelizeanBermudanBhutaneseBlackfeetBolivianBrazilianBritishBritish West IndianBulgarianBurmeseCajunCambodianCanadianCape VerdeanCarpatho RusynCelticCentral AmericanCentral American IndianCherokeeCheyenneChickasawChileanChineseChippewaChoctawColombianColvilleComancheCosta RicanCreeCreekCroatianCrowCubanCypriotCzechCzechoslovakianDanishDelawareDominicanDutchDutch West IndianEastern EuropeanEcuadorianEgyptianEnglishEstonianEthiopianEuropeanFijianFilipinoFinnishFrenchFrench American IndianFrench CanadianGermanGerman RussianGhanaianGreekGuamanian/ChamorroGuatemalanGuyaneseHaitianHmongHonduranHopiHoumaHungarianIcelanderIndian (Asian)IndonesianInupiatIranianIraqiIrishIroquoisIsraeliItalianJamaicanJapaneseJordanianKenyanKiowaKoreanLaotianLatvianLebaneseLiberianLithuanianLumbeeLuxembourgerMacedonianMalaysianMalteseMarshalleseMenomineeMexicanMexican American IndianMongolianMoroccanNative HawaiianNavajoNepaleseNew ZealanderNicaraguanNigerianNorthern EuropeanNorwegianOkinawanOsageOttawaPaiutePakistaniPalestinianPanamanianParaguayanPennsylvania GermanPeruvianPimaPolishPortuguesePotawatomiPuebloPuerto RicanPuget Sound SalishRomanianRussianSalvadoranSamoanScandinavianScotch-IrishScottishSeminoleSenegaleseSerbianShoshoneSierra LeoneanSiouxSlavicSlovakSloveneSomaliSouth AfricanSouth AmericanSouth American IndianSoviet UnionSpaniardSpanishSpanish AmericanSpanish American IndianSri LankanSubsaharan AfricanSudaneseSwedishSwissSyrianTaiwaneseThaiTlingit-HaidaTohono O'OdhamTonganTrinidadian and TobagonianTsimshianTurkishU.S. Virgin IslanderUgandanUruguayanUteVenezuelanVietnameseWelshWest IndianYakamaYaquiYugoslavianYumanYup'ikZimbabwean
Immigration
NonimmigrantsImmigrantsAfghanistanAfricaAlbaniaArgentinaArmeniaAsiaAustraliaAustriaBahamasBangladeshBarbadosBelarusBelgiumBelizeBoliviaBosnia and HerzegovinaBrazilBulgariaBurma/MyanmarCabo VerdeCambodiaCameroonCanadaCaribbeanCentral AmericaChileChinaColombiaCongoCosta RicaCroatiaCubaCzechoslovakiaDenmarkDominicaDominican RepublicEastern AfricaEastern AsiaEastern EuropeEcuadorEgyptEl SalvadorEnglandEritreaEthiopiaEuropeFijiFranceGermanyGhanaGreeceGrenadaGuatemalaGuyanaHaitiHondurasHong KongHungaryIndiaIndonesiaIranIraqIrelandIsraelItalyJamaicaJapanJordanKazakhstanKenyaKoreaKuwaitLaosLatin AmericaLatviaLebanonLiberiaLithuaniaMalaysiaMexicoMicronesiaMiddle AfricaMoldovaMoroccoNepalNetherlandsNicaraguaNigeriaNorth AmericaNorth MacedoniaNorthern AfricaNorthern EuropeNorwayOceaniaPakistanPanamaPeruPhilippinesPolandPortugalRomaniaRussiaSaudi ArabiaScotlandSenegalSerbiaSierra LeoneSingaporeSomaliaSouth AfricaSouth AmericaSouth Central AsiaSouth Eastern AsiaSouthern EuropeSpainSri LankaSt. Vincent and the GrenadinesSudanSwedenSwitzerlandSyriaTaiwanThailandTrinidad and TobagoTurkeyUgandaUkraineUruguayUzbekistanVenezuelaVietnamWest IndiesWestern AfricaWestern AsiaWestern EuropeYemenZaireZimbabweAzores
Disability Age 5 to 17
Income
Poverty
Unemployment
Labor Participation
Family Structure
Vehicle Availability
Education Level
Disability

Ukrainian Disability Age 5 to 17
Average

5.6%
DISABILITY | AGE 5 TO 17
51.5/ 100
METRIC RATING
172nd/ 347
METRIC RANK

Ukrainian Disability Age 5 to 17 Correlation Chart

The statistical analysis conducted on geographies consisting of 442,807,363 people shows a substantial positive correlation between the proportion of Ukrainians and percentage of population with a disability between the ages 5 and 17 in the United States with a correlation coefficient (R) of 0.565 and weighted average of 5.6%. On average, for every 1% (one percent) increase in Ukrainians within a typical geography, there is an increase of 0.56% in percentage of population with a disability between the ages 5 and 17.
Ukrainian Disability Age 5 to 17
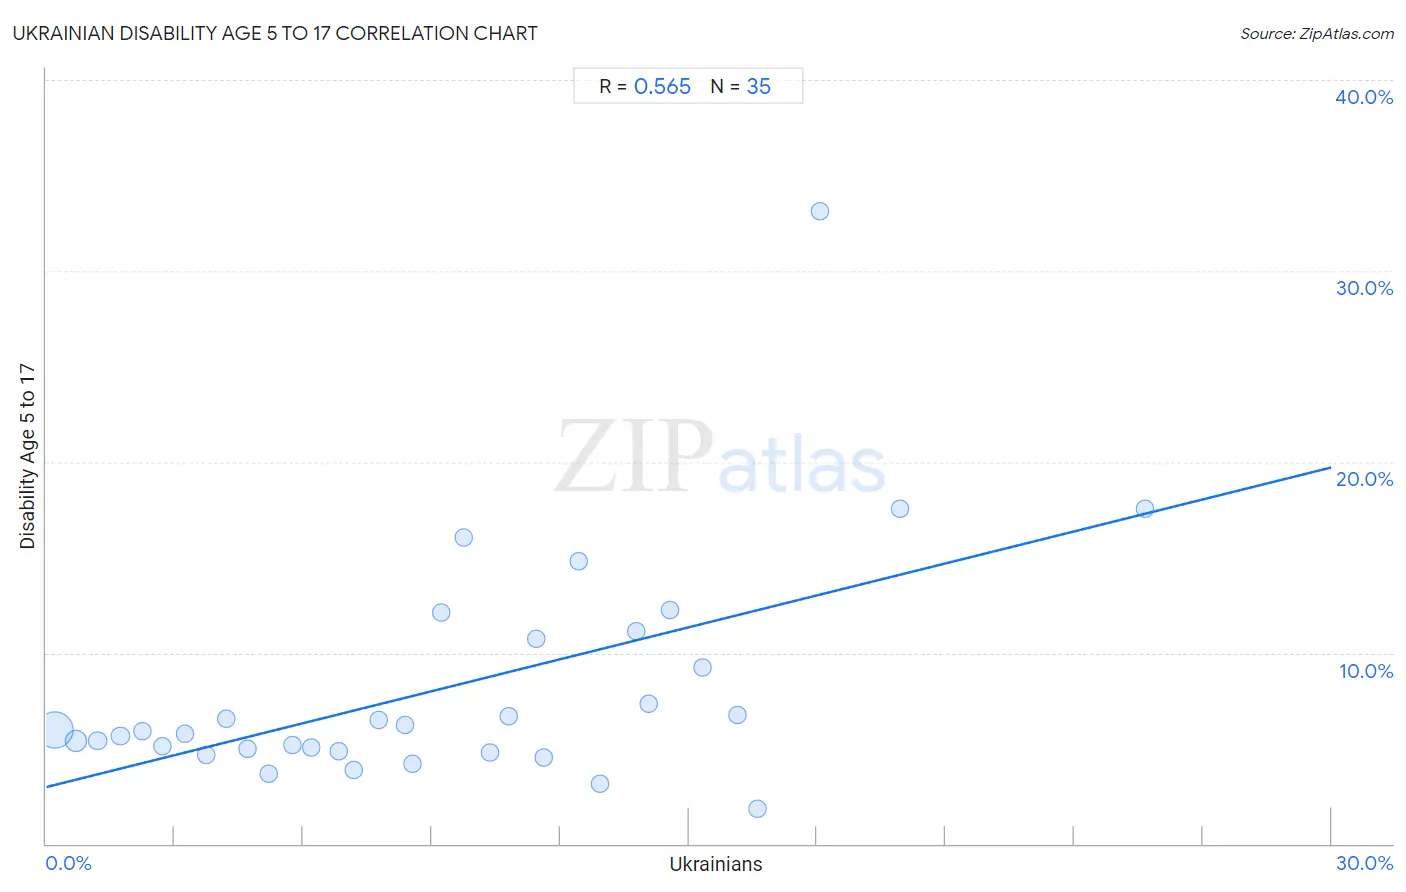
It is essential to understand that the correlation between the percentage of Ukrainians and percentage of population with a disability between the ages 5 and 17 does not imply a direct cause-and-effect relationship. It remains uncertain whether the presence of Ukrainians influences an upward or downward trend in the level of percentage of population with a disability between the ages 5 and 17 within an area, or if Ukrainians simply ended up residing in those areas with higher or lower levels of percentage of population with a disability between the ages 5 and 17 due to other factors.

Demographics Similar to Ukrainians by Disability Age 5 to 17

In terms of disability age 5 to 17, the demographic groups most similar to Ukrainians are Uruguayan (5.6%, a difference of 0.030%), Costa Rican (5.6%, a difference of 0.080%), Shoshone (5.6%, a difference of 0.10%), Immigrants from Central America (5.6%, a difference of 0.11%), and Serbian (5.6%, a difference of 0.12%).
DemographicsRating | RankDisability Age 5 to 17
Lebanese
61.4
/100
|
#165
Good
5.6%
Greeks
60.6
/100
|
#166
Good
5.6%
Immigrants from Burma/Myanmar
59.3
/100
|
#167
Average
5.6%
Iraqis
56.0
/100
|
#168
Average
5.6%
Immigrants from Norway
55.7
/100
|
#169
Average
5.6%
Serbians
54.0
/100
|
#170
Average
5.6%
Immigrants from Iraq
53.9
/100
|
#171
Average
5.6%
Ukrainians
51.5
/100
|
#172
Average
5.6%
Uruguayans
51.0
/100
|
#173
Average
5.6%
Costa Ricans
50.0
/100
|
#174
Average
5.6%
Shoshone
49.4
/100
|
#175
Average
5.6%
Immigrants from Central America
49.4
/100
|
#176
Average
5.6%
Immigrants from Western Europe
47.8
/100
|
#177
Average
5.6%
Immigrants from Trinidad and Tobago
47.6
/100
|
#178
Average
5.6%
Immigrants from Barbados
40.5
/100
|
#179
Average
5.6%

Ukrainian Disability Age 5 to 17 Correlation Summary

MeasurementUkrainian DataDisability Age 5 to 17 Data
Minimum0.19%1.8%
Maximum25.7%33.1%
Range25.5%31.3%
Mean9.2%8.1%
Median8.5%5.9%
Interquartile 25% (IQ1)4.2%4.8%
Interquartile 75% (IQ3)13.8%10.7%
Interquartile Range (IQR)9.6%5.9%
Standard Deviation (Sample)6.0%6.0%
Standard Deviation (Population)6.0%5.9%

Correlation Details

Ukrainian PercentileSample SizeDisability Age 5 to 17
[
0.0%
-
0.5%
]
0.19%
332,153,7395.9%
[
0.5%
-
1.0%
]
0.70%
76,381,6265.4%
[
1.0%
-
1.5%
]
1.19%
18,621,8445.4%
[
1.5%
-
2.0%
]
1.73%
7,627,3805.6%
[
2.0%
-
2.5%
]
2.24%
2,783,1905.9%
[
2.5%
-
3.0%
]
2.70%
2,243,6875.1%
[
3.0%
-
3.5%
]
3.25%
575,9075.8%
[
3.5%
-
4.0%
]
3.73%
749,0474.6%
[
4.0%
-
4.5%
]
4.19%
351,3966.5%
[
4.5%
-
5.0%
]
4.69%
351,1495.0%
[
5.0%
-
5.5%
]
5.19%
127,7003.7%
[
5.5%
-
6.0%
]
5.76%
297,6315.2%
[
6.0%
-
6.5%
]
6.20%
128,3765.1%
[
6.5%
-
7.0%
]
6.83%
98,2494.8%
[
7.0%
-
7.5%
]
7.17%
68,9233.9%
[
7.5%
-
8.0%
]
7.77%
2,4716.5%
[
8.0%
-
8.5%
]
8.38%
80,7086.2%
[
8.5%
-
9.0%
]
8.54%
52,3564.2%
[
9.0%
-
9.5%
]
9.22%
9,27012.1%
[
9.5%
-
10.0%
]
9.75%
5,51016.0%
[
10.0%
-
10.5%
]
10.35%
1,3814.8%
[
10.5%
-
11.0%
]
10.80%
2136.7%
[
11.0%
-
11.5%
]
11.44%
37610.7%
[
11.5%
-
12.0%
]
11.60%
84,4114.5%
[
12.0%
-
12.5%
]
12.43%
1,11814.8%
[
12.5%
-
13.0%
]
12.94%
1,7783.2%
[
13.5%
-
14.0%
]
13.78%
31211.1%
[
14.0%
-
14.5%
]
14.05%
1,8367.3%
[
14.5%
-
15.0%
]
14.56%
73512.2%
[
15.0%
-
15.5%
]
15.32%
3859.2%
[
16.0%
-
16.5%
]
16.13%
2,4746.7%
[
16.5%
-
17.0%
]
16.62%
3431.8%
[
18.0%
-
18.5%
]
18.08%
96833.1%
[
19.5%
-
20.0%
]
19.92%
49217.6%
[
25.5%
-
26.0%
]
25.65%
38217.6%