Iraqi Disability Age 5 to 17
COMPARE
Iraqi
Select to Compare
Disability Age 5 to 17
Iraqi Disability Age 5 to 17
5.6%
DISABILITY | AGE 5 TO 17
56.0/ 100
METRIC RATING
168th/ 347
METRIC RANK
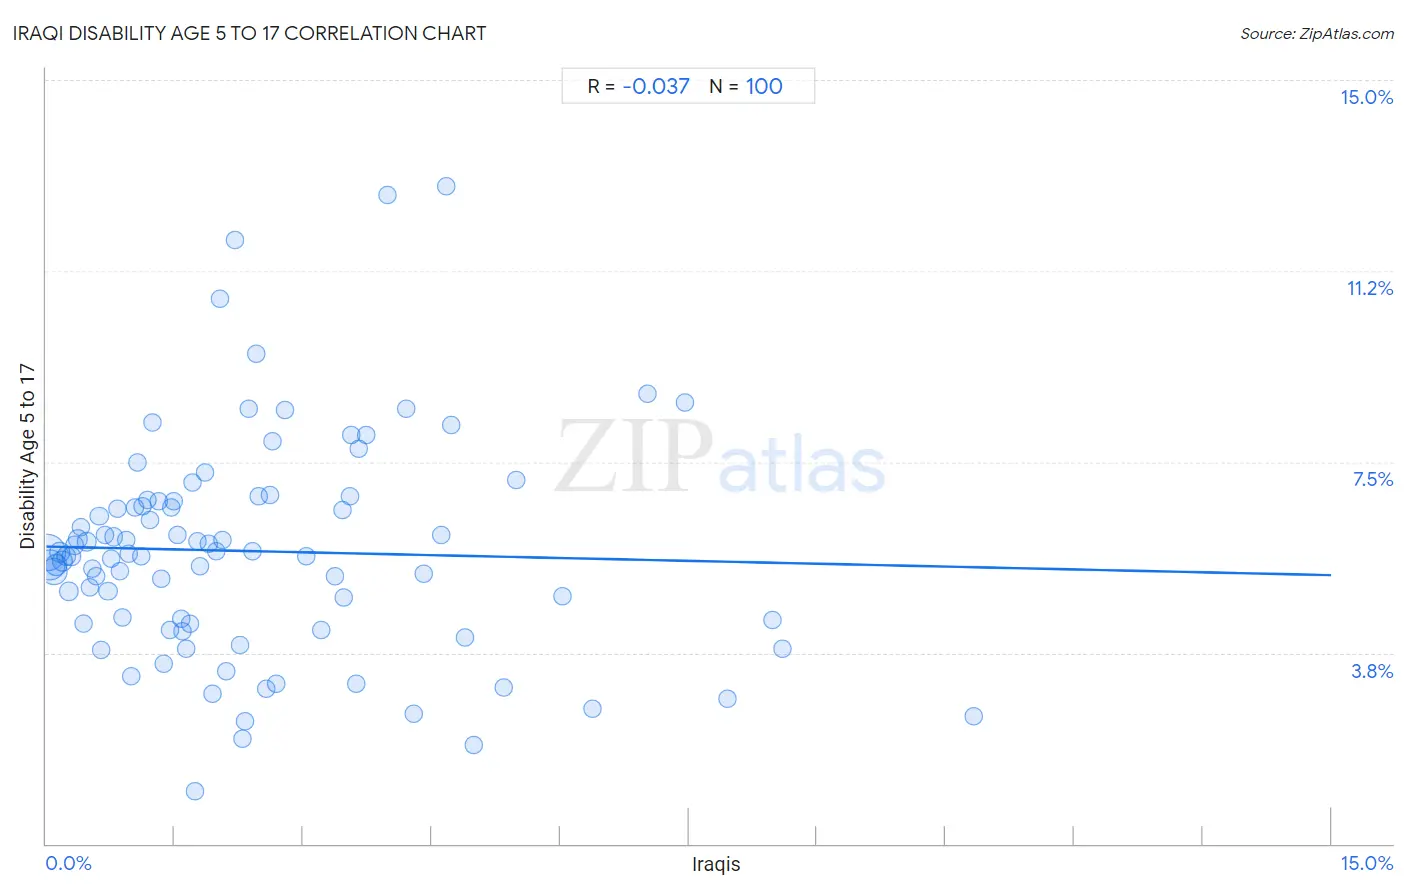
Iraqi Disability Age 5 to 17 Correlation Chart
The statistical analysis conducted on geographies consisting of 170,075,057 people shows no correlation between the proportion of Iraqis and percentage of population with a disability between the ages 5 and 17 in the United States with a correlation coefficient (R) of -0.037 and weighted average of 5.6%. On average, for every 1% (one percent) increase in Iraqis within a typical geography, there is a decrease of 0.037% in percentage of population with a disability between the ages 5 and 17.
It is essential to understand that the correlation between the percentage of Iraqis and percentage of population with a disability between the ages 5 and 17 does not imply a direct cause-and-effect relationship. It remains uncertain whether the presence of Iraqis influences an upward or downward trend in the level of percentage of population with a disability between the ages 5 and 17 within an area, or if Iraqis simply ended up residing in those areas with higher or lower levels of percentage of population with a disability between the ages 5 and 17 due to other factors.
Demographics Similar to Iraqis by Disability Age 5 to 17
In terms of disability age 5 to 17, the demographic groups most similar to Iraqis are Immigrants from Norway (5.6%, a difference of 0.020%), Serbian (5.6%, a difference of 0.10%), Immigrants from Iraq (5.6%, a difference of 0.11%), Immigrants from Burma/Myanmar (5.6%, a difference of 0.17%), and Greek (5.6%, a difference of 0.23%).
| Demographics | Rating | Rank | Disability Age 5 to 17 |
| Immigrants from Saudi Arabia | 69.1 /100 | #161 | Good 5.5% |
| Zimbabweans | 67.2 /100 | #162 | Good 5.5% |
| Immigrants from Southern Europe | 64.0 /100 | #163 | Good 5.6% |
| Immigrants from Scotland | 61.9 /100 | #164 | Good 5.6% |
| Lebanese | 61.4 /100 | #165 | Good 5.6% |
| Greeks | 60.6 /100 | #166 | Good 5.6% |
| Immigrants from Burma/Myanmar | 59.3 /100 | #167 | Average 5.6% |
| Iraqis | 56.0 /100 | #168 | Average 5.6% |
| Immigrants from Norway | 55.7 /100 | #169 | Average 5.6% |
| Serbians | 54.0 /100 | #170 | Average 5.6% |
| Immigrants from Iraq | 53.9 /100 | #171 | Average 5.6% |
| Ukrainians | 51.5 /100 | #172 | Average 5.6% |
| Uruguayans | 51.0 /100 | #173 | Average 5.6% |
| Costa Ricans | 50.0 /100 | #174 | Average 5.6% |
| Shoshone | 49.4 /100 | #175 | Average 5.6% |
Iraqi Disability Age 5 to 17 Correlation Summary
| Measurement | Iraqi Data | Disability Age 5 to 17 Data |
| Minimum | 0.019% | 1.0% |
| Maximum | 10.8% | 12.9% |
| Range | 10.8% | 11.9% |
| Mean | 2.4% | 5.7% |
| Median | 1.8% | 5.7% |
| Interquartile 25% (IQ1) | 0.88% | 4.3% |
| Interquartile 75% (IQ3) | 3.5% | 6.7% |
| Interquartile Range (IQR) | 2.6% | 2.4% |
| Standard Deviation (Sample) | 2.1% | 2.2% |
| Standard Deviation (Population) | 2.1% | 2.2% |
Correlation Details
| Iraqi Percentile | Sample Size | Disability Age 5 to 17 |
[ 0.0% - 0.5% ] 0.019% | 54,051,488 | 5.7% |
[ 0.0% - 0.5% ] 0.049% | 36,411,716 | 5.5% |
[ 0.0% - 0.5% ] 0.086% | 23,987,267 | 5.3% |
[ 0.0% - 0.5% ] 0.12% | 10,874,820 | 5.5% |
[ 0.0% - 0.5% ] 0.16% | 8,557,979 | 5.7% |
[ 0.0% - 0.5% ] 0.19% | 7,970,986 | 5.5% |
[ 0.0% - 0.5% ] 0.23% | 3,907,639 | 5.6% |
[ 0.0% - 0.5% ] 0.26% | 3,093,505 | 5.0% |
[ 0.0% - 0.5% ] 0.30% | 3,017,401 | 5.6% |
[ 0.0% - 0.5% ] 0.33% | 1,872,946 | 5.9% |
[ 0.0% - 0.5% ] 0.37% | 1,601,419 | 6.0% |
[ 0.0% - 0.5% ] 0.40% | 1,976,525 | 6.2% |
[ 0.0% - 0.5% ] 0.44% | 1,013,079 | 4.3% |
[ 0.0% - 0.5% ] 0.47% | 846,794 | 5.9% |
[ 0.5% - 1.0% ] 0.51% | 758,219 | 5.0% |
[ 0.5% - 1.0% ] 0.54% | 834,900 | 5.4% |
[ 0.5% - 1.0% ] 0.58% | 635,028 | 5.3% |
[ 0.5% - 1.0% ] 0.62% | 720,098 | 6.4% |
[ 0.5% - 1.0% ] 0.65% | 477,979 | 3.8% |
[ 0.5% - 1.0% ] 0.68% | 209,573 | 6.1% |
[ 0.5% - 1.0% ] 0.72% | 452,606 | 5.0% |
[ 0.5% - 1.0% ] 0.76% | 509,707 | 5.6% |
[ 0.5% - 1.0% ] 0.78% | 353,185 | 6.0% |
[ 0.5% - 1.0% ] 0.83% | 373,998 | 6.6% |
[ 0.5% - 1.0% ] 0.86% | 570,214 | 5.4% |
[ 0.5% - 1.0% ] 0.89% | 336,334 | 4.4% |
[ 0.5% - 1.0% ] 0.93% | 116,639 | 6.0% |
[ 0.5% - 1.0% ] 0.97% | 129,825 | 5.7% |
[ 0.5% - 1.0% ] 0.99% | 204,160 | 3.3% |
[ 1.0% - 1.5% ] 1.03% | 109,546 | 6.6% |
[ 1.0% - 1.5% ] 1.07% | 188,029 | 7.5% |
[ 1.0% - 1.5% ] 1.11% | 163,925 | 5.6% |
[ 1.0% - 1.5% ] 1.13% | 34,764 | 6.6% |
[ 1.0% - 1.5% ] 1.18% | 272,158 | 6.8% |
[ 1.0% - 1.5% ] 1.21% | 155,660 | 6.4% |
[ 1.0% - 1.5% ] 1.24% | 138,598 | 8.3% |
[ 1.0% - 1.5% ] 1.31% | 54,393 | 6.7% |
[ 1.0% - 1.5% ] 1.34% | 88,190 | 5.2% |
[ 1.0% - 1.5% ] 1.38% | 4,576 | 3.5% |
[ 1.0% - 1.5% ] 1.44% | 57,042 | 4.2% |
[ 1.0% - 1.5% ] 1.46% | 76,757 | 6.6% |
[ 1.0% - 1.5% ] 1.49% | 181,518 | 6.7% |
[ 1.5% - 2.0% ] 1.53% | 394,812 | 6.1% |
[ 1.5% - 2.0% ] 1.57% | 121,760 | 4.4% |
[ 1.5% - 2.0% ] 1.59% | 43,269 | 4.2% |
[ 1.5% - 2.0% ] 1.63% | 88,248 | 3.8% |
[ 1.5% - 2.0% ] 1.67% | 7,534 | 4.3% |
[ 1.5% - 2.0% ] 1.70% | 31,220 | 7.1% |
[ 1.5% - 2.0% ] 1.73% | 33,170 | 1.0% |
[ 1.5% - 2.0% ] 1.77% | 153,050 | 6.0% |
[ 1.5% - 2.0% ] 1.80% | 44,873 | 5.4% |
[ 1.5% - 2.0% ] 1.85% | 2,437 | 7.3% |
[ 1.5% - 2.0% ] 1.90% | 40,923 | 5.9% |
[ 1.5% - 2.0% ] 1.94% | 63,109 | 2.9% |
[ 1.5% - 2.0% ] 1.99% | 34,758 | 5.7% |
[ 2.0% - 2.5% ] 2.02% | 29,673 | 10.7% |
[ 2.0% - 2.5% ] 2.06% | 76,047 | 6.0% |
[ 2.0% - 2.5% ] 2.10% | 39,831 | 3.4% |
[ 2.0% - 2.5% ] 2.20% | 27,959 | 11.9% |
[ 2.0% - 2.5% ] 2.26% | 37,947 | 3.9% |
[ 2.0% - 2.5% ] 2.29% | 19,289 | 2.1% |
[ 2.0% - 2.5% ] 2.33% | 34,222 | 2.4% |
[ 2.0% - 2.5% ] 2.37% | 19,342 | 8.5% |
[ 2.0% - 2.5% ] 2.41% | 19,975 | 5.7% |
[ 2.0% - 2.5% ] 2.45% | 34,375 | 9.6% |
[ 2.0% - 2.5% ] 2.49% | 22,082 | 6.8% |
[ 2.5% - 3.0% ] 2.57% | 17,007 | 3.0% |
[ 2.5% - 3.0% ] 2.61% | 29,075 | 6.8% |
[ 2.5% - 3.0% ] 2.64% | 61,381 | 7.9% |
[ 2.5% - 3.0% ] 2.68% | 81,232 | 3.1% |
[ 2.5% - 3.0% ] 2.78% | 30,590 | 8.5% |
[ 3.0% - 3.5% ] 3.03% | 15,155 | 5.7% |
[ 3.0% - 3.5% ] 3.22% | 45,692 | 4.2% |
[ 3.0% - 3.5% ] 3.37% | 267 | 5.3% |
[ 3.0% - 3.5% ] 3.45% | 14,997 | 6.6% |
[ 3.0% - 3.5% ] 3.48% | 27,848 | 4.8% |
[ 3.5% - 4.0% ] 3.54% | 16,469 | 6.8% |
[ 3.5% - 4.0% ] 3.56% | 36,101 | 8.0% |
[ 3.5% - 4.0% ] 3.62% | 15,017 | 3.1% |
[ 3.5% - 4.0% ] 3.65% | 1,368 | 7.8% |
[ 3.5% - 4.0% ] 3.74% | 4,092 | 8.0% |
[ 3.5% - 4.0% ] 3.98% | 6,607 | 12.8% |
[ 4.0% - 4.5% ] 4.20% | 15,826 | 8.5% |
[ 4.0% - 4.5% ] 4.28% | 45,937 | 2.6% |
[ 4.0% - 4.5% ] 4.40% | 16,850 | 5.3% |
[ 4.5% - 5.0% ] 4.61% | 147,500 | 6.1% |
[ 4.5% - 5.0% ] 4.67% | 214 | 12.9% |
[ 4.5% - 5.0% ] 4.73% | 69,638 | 8.2% |
[ 4.5% - 5.0% ] 4.89% | 108,414 | 4.1% |
[ 4.5% - 5.0% ] 4.99% | 22,430 | 2.0% |
[ 5.0% - 5.5% ] 5.34% | 8,277 | 3.1% |
[ 5.0% - 5.5% ] 5.49% | 164 | 7.1% |
[ 6.0% - 6.5% ] 6.02% | 79,216 | 4.9% |
[ 6.0% - 6.5% ] 6.38% | 11,265 | 2.7% |
[ 7.0% - 7.5% ] 7.02% | 105,721 | 8.8% |
[ 7.0% - 7.5% ] 7.46% | 59,775 | 8.7% |
[ 7.5% - 8.0% ] 7.95% | 40,392 | 2.9% |
[ 8.0% - 8.5% ] 8.48% | 43,232 | 4.4% |
[ 8.5% - 9.0% ] 8.60% | 53,044 | 3.8% |
[ 10.5% - 11.0% ] 10.82% | 33,174 | 2.5% |