States with the Highest Percentage of Tlingit-Haida Population
RELATED REPORTS & OPTIONS
Tlingit-Haida
United States
Compare States
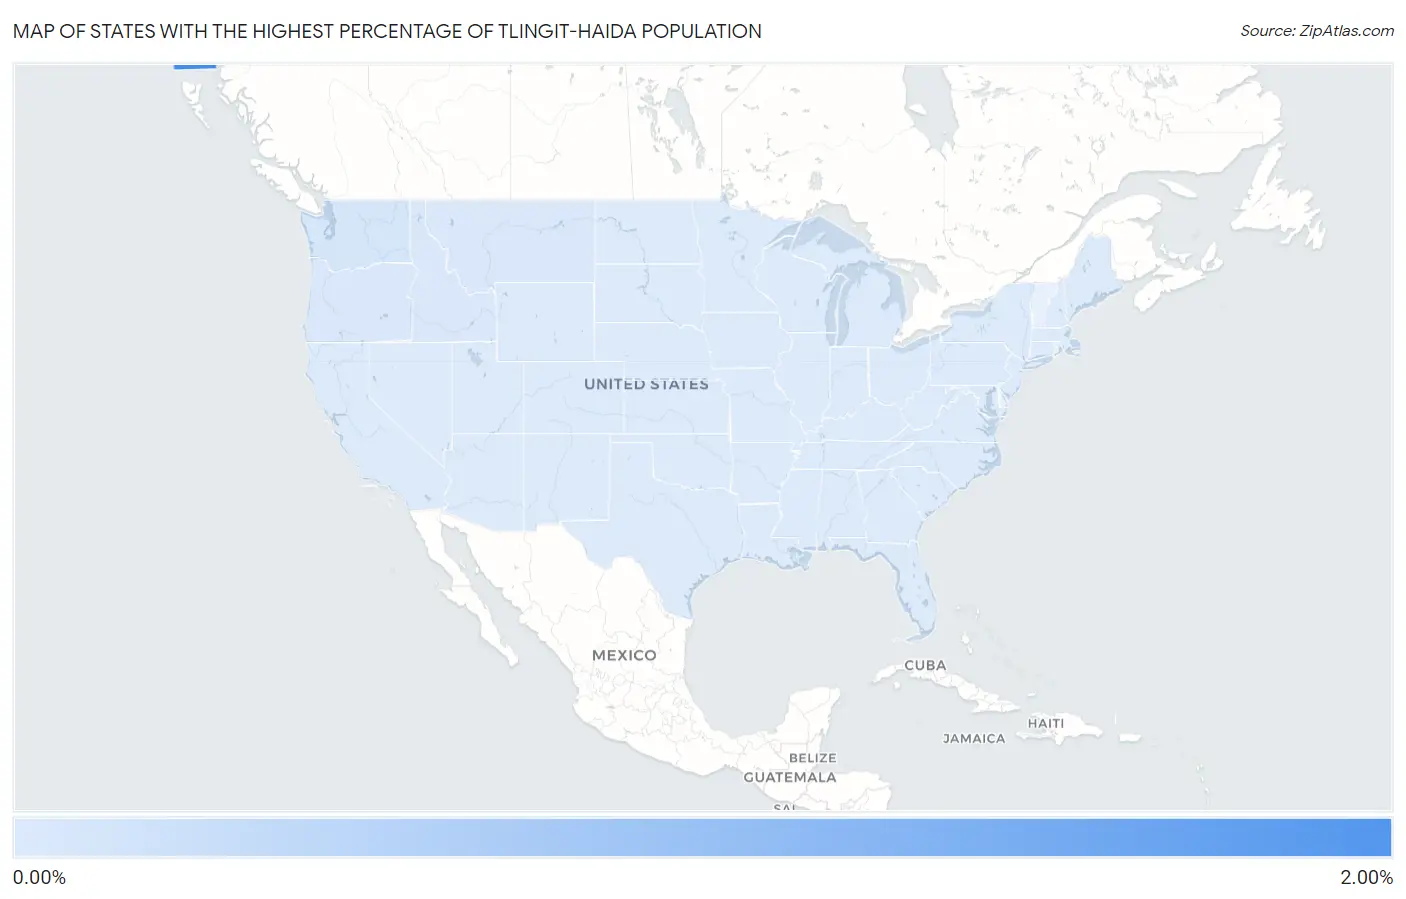
Map of States with the Highest Percentage of Tlingit-Haida Population
0.00%
2.00%
States with the Highest Percentage of Tlingit-Haida Population in the United States
| State | Tlingit-Haida | vs State Median | vs National | |
| 1. | Alaska | 1.70% | 0.0012% (+1.70) | 0.0082%(+1.69) |
| 2. | Washington | 0.082% | 0.0012% (+0.081) | 0.0082%(+0.074) |
| 3. | Oregon | 0.034% | 0.0012% (+0.032) | 0.0082%(+0.025) |
| 4. | Montana | 0.028% | 0.0012% (+0.027) | 0.0082%(+0.020) |
| 5. | Hawaii | 0.025% | 0.0012% (+0.024) | 0.0082%(+0.017) |
| 6. | Idaho | 0.016% | 0.0012% (+0.015) | 0.0082%(+0.008) |
| 7. | Wyoming | 0.011% | 0.0012% (+0.010) | 0.0082%(+0.003) |
| 8. | Arizona | 0.0091% | 0.0012% (+0.008) | 0.0082%(+0.001) |
| 9. | Nevada | 0.0087% | 0.0012% (+0.008) | 0.0082%(+0.001) |
| 10. | Utah | 0.0085% | 0.0012% (+0.007) | 0.0082%(+0.000) |
| 11. | North Dakota | 0.0066% | 0.0012% (+0.005) | 0.0082%(-0.002) |
| 12. | New Mexico | 0.0063% | 0.0012% (+0.005) | 0.0082%(-0.002) |
| 13. | Colorado | 0.0062% | 0.0012% (+0.005) | 0.0082%(-0.002) |
| 14. | Oklahoma | 0.0047% | 0.0012% (+0.004) | 0.0082%(-0.004) |
| 15. | California | 0.0042% | 0.0012% (+0.003) | 0.0082%(-0.004) |
| 16. | Kansas | 0.0042% | 0.0012% (+0.003) | 0.0082%(-0.004) |
| 17. | South Dakota | 0.0042% | 0.0012% (+0.003) | 0.0082%(-0.004) |
| 18. | Minnesota | 0.0040% | 0.0012% (+0.003) | 0.0082%(-0.004) |
| 19. | North Carolina | 0.0019% | 0.0012% (+0.001) | 0.0082%(-0.006) |
| 20. | Nebraska | 0.0017% | 0.0012% (+0.001) | 0.0082%(-0.006) |
| 21. | New Jersey | 0.0016% | 0.0012% (+0.000) | 0.0082%(-0.007) |
| 22. | Tennessee | 0.0016% | 0.0012% (+0.000) | 0.0082%(-0.007) |
| 23. | Iowa | 0.0013% | 0.0012% (+0.000) | 0.0082%(-0.007) |
| 24. | Virginia | 0.0012% | 0.0012% (=0.000) | 0.0082%(-0.007) |
| 25. | Massachusetts | 0.0011% | 0.0012% (-0.000) | 0.0082%(-0.007) |
| 26. | Pennsylvania | 0.0010% | 0.0012% (-0.000) | 0.0082%(-0.007) |
| 27. | Wisconsin | 0.00099% | 0.0012% (-0.000) | 0.0082%(-0.007) |
| 28. | Michigan | 0.00094% | 0.0012% (-0.000) | 0.0082%(-0.007) |
| 29. | Arkansas | 0.00089% | 0.0012% (-0.000) | 0.0082%(-0.007) |
| 30. | Florida | 0.00087% | 0.0012% (-0.000) | 0.0082%(-0.007) |
| 31. | Texas | 0.00079% | 0.0012% (-0.000) | 0.0082%(-0.007) |
| 32. | Indiana | 0.00075% | 0.0012% (-0.000) | 0.0082%(-0.007) |
| 33. | South Carolina | 0.00074% | 0.0012% (-0.000) | 0.0082%(-0.007) |
| 34. | Louisiana | 0.00071% | 0.0012% (-0.000) | 0.0082%(-0.008) |
| 35. | Missouri | 0.00067% | 0.0012% (-0.000) | 0.0082%(-0.008) |
| 36. | Ohio | 0.00055% | 0.0012% (-0.001) | 0.0082%(-0.008) |
| 37. | Maine | 0.00051% | 0.0012% (-0.001) | 0.0082%(-0.008) |
| 38. | Alabama | 0.00050% | 0.0012% (-0.001) | 0.0082%(-0.008) |
| 39. | Illinois | 0.00049% | 0.0012% (-0.001) | 0.0082%(-0.008) |
| 40. | Mississippi | 0.00047% | 0.0012% (-0.001) | 0.0082%(-0.008) |
| 41. | New York | 0.00043% | 0.0012% (-0.001) | 0.0082%(-0.008) |
| 42. | Kentucky | 0.00029% | 0.0012% (-0.001) | 0.0082%(-0.008) |
| 43. | Connecticut | 0.00022% | 0.0012% (-0.001) | 0.0082%(-0.008) |
| 44. | New Hampshire | 0.00022% | 0.0012% (-0.001) | 0.0082%(-0.008) |
| 45. | Maryland | 0.00011% | 0.0012% (-0.001) | 0.0082%(-0.008) |
| 46. | Georgia | 0.00007% | 0.0012% (-0.001) | 0.0082%(-0.008) |
| 47. | West Virginia | 0.00006% | 0.0012% (-0.001) | 0.0082%(-0.008) |
1
Common Questions
What are the Top 10 States with the Highest Percentage of Tlingit-Haida Population in the United States?
Top 10 States with the Highest Percentage of Tlingit-Haida Population in the United States are:
What state has the Highest Percentage of Tlingit-Haida Population in the United States?
Alaska has the Highest Percentage of Tlingit-Haida Population in the United States with 1.70%.
What is the Percentage of Tlingit-Haida Population in the United States?
Percentage of Tlingit-Haida Population in the United States is 0.0082%.