Spaniard Disability Age 5 to 17
COMPARE
Spaniard
Select to Compare
Disability Age 5 to 17
Spaniard Disability Age 5 to 17
5.9%
DISABILITY | AGE 5 TO 17
2.0/ 100
METRIC RATING
242nd/ 347
METRIC RANK
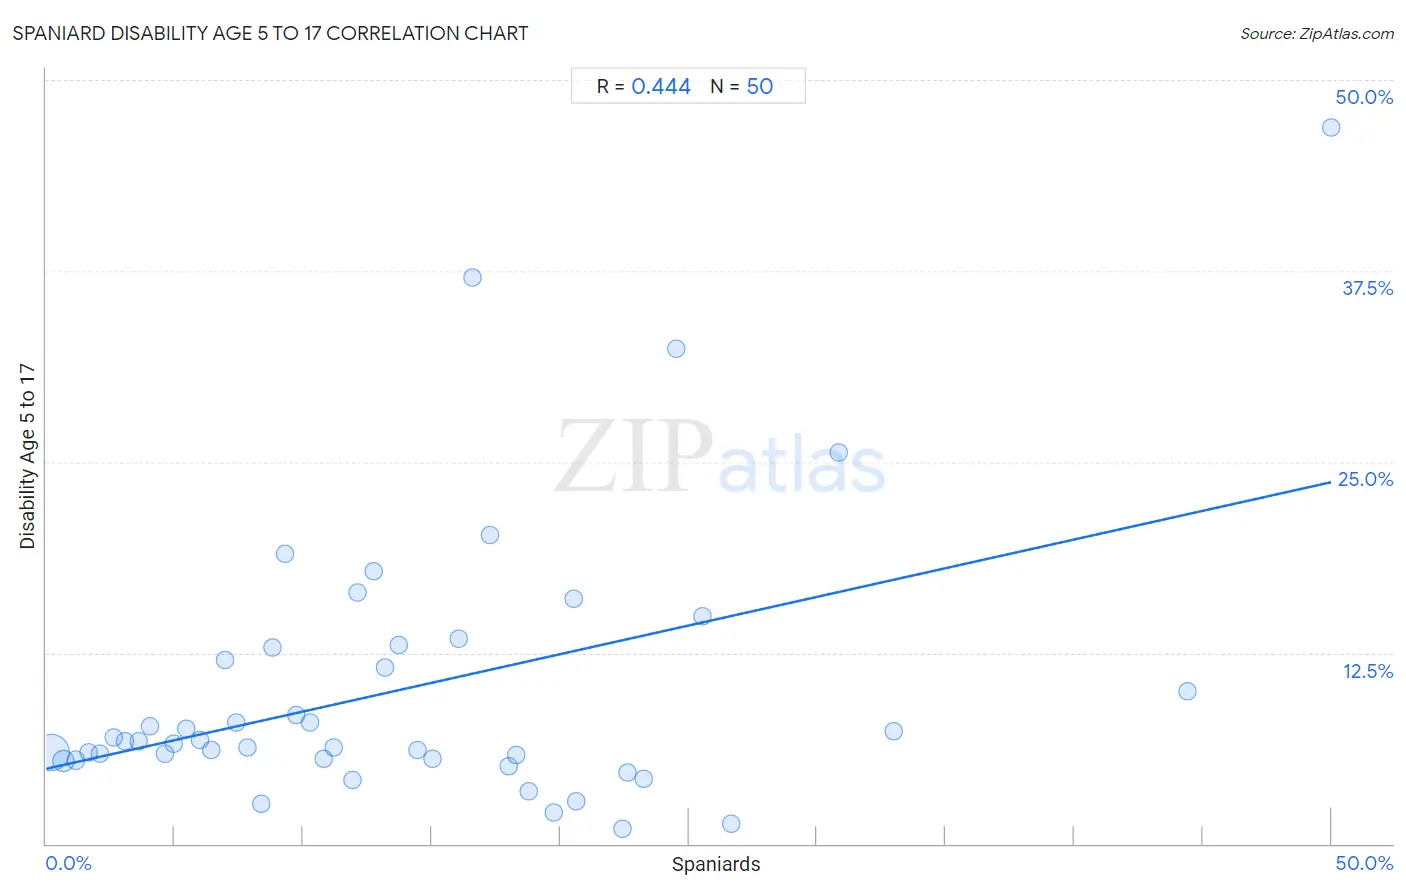
Spaniard Disability Age 5 to 17 Correlation Chart
The statistical analysis conducted on geographies consisting of 438,849,773 people shows a moderate positive correlation between the proportion of Spaniards and percentage of population with a disability between the ages 5 and 17 in the United States with a correlation coefficient (R) of 0.444 and weighted average of 5.9%. On average, for every 1% (one percent) increase in Spaniards within a typical geography, there is an increase of 0.38% in percentage of population with a disability between the ages 5 and 17.
It is essential to understand that the correlation between the percentage of Spaniards and percentage of population with a disability between the ages 5 and 17 does not imply a direct cause-and-effect relationship. It remains uncertain whether the presence of Spaniards influences an upward or downward trend in the level of percentage of population with a disability between the ages 5 and 17 within an area, or if Spaniards simply ended up residing in those areas with higher or lower levels of percentage of population with a disability between the ages 5 and 17 due to other factors.
Demographics Similar to Spaniards by Disability Age 5 to 17
In terms of disability age 5 to 17, the demographic groups most similar to Spaniards are Indonesian (5.9%, a difference of 0.010%), Immigrants from Germany (5.9%, a difference of 0.070%), Immigrants from Micronesia (5.9%, a difference of 0.070%), Immigrants from Caribbean (5.9%, a difference of 0.080%), and Tlingit-Haida (5.9%, a difference of 0.080%).
| Demographics | Rating | Rank | Disability Age 5 to 17 |
| Malaysians | 3.4 /100 | #235 | Tragic 5.8% |
| Immigrants from Brazil | 3.2 /100 | #236 | Tragic 5.8% |
| Sudanese | 2.9 /100 | #237 | Tragic 5.8% |
| Hungarians | 2.6 /100 | #238 | Tragic 5.8% |
| German Russians | 2.4 /100 | #239 | Tragic 5.9% |
| West Indians | 2.4 /100 | #240 | Tragic 5.9% |
| Immigrants from Caribbean | 2.1 /100 | #241 | Tragic 5.9% |
| Spaniards | 2.0 /100 | #242 | Tragic 5.9% |
| Indonesians | 2.0 /100 | #243 | Tragic 5.9% |
| Immigrants from Germany | 1.9 /100 | #244 | Tragic 5.9% |
| Immigrants from Micronesia | 1.9 /100 | #245 | Tragic 5.9% |
| Tlingit-Haida | 1.9 /100 | #246 | Tragic 5.9% |
| Immigrants from Honduras | 1.8 /100 | #247 | Tragic 5.9% |
| British | 1.7 /100 | #248 | Tragic 5.9% |
| Immigrants from Ghana | 1.7 /100 | #249 | Tragic 5.9% |
Spaniard Disability Age 5 to 17 Correlation Summary
| Measurement | Spaniard Data | Disability Age 5 to 17 Data |
| Minimum | 0.20% | 0.99% |
| Maximum | 50.0% | 46.9% |
| Range | 49.8% | 45.9% |
| Mean | 14.0% | 10.2% |
| Median | 12.0% | 6.7% |
| Interquartile 25% (IQ1) | 6.0% | 5.6% |
| Interquartile 75% (IQ3) | 19.8% | 12.9% |
| Interquartile Range (IQR) | 13.8% | 7.3% |
| Standard Deviation (Sample) | 10.7% | 9.0% |
| Standard Deviation (Population) | 10.6% | 9.0% |
Correlation Details
| Spaniard Percentile | Sample Size | Disability Age 5 to 17 |
[ 0.0% - 0.5% ] 0.20% | 334,308,571 | 6.0% |
[ 0.5% - 1.0% ] 0.66% | 77,439,971 | 5.4% |
[ 1.0% - 1.5% ] 1.15% | 15,582,902 | 5.5% |
[ 1.5% - 2.0% ] 1.65% | 4,245,658 | 6.0% |
[ 2.0% - 2.5% ] 2.10% | 2,034,961 | 5.9% |
[ 2.5% - 3.0% ] 2.62% | 1,245,800 | 7.0% |
[ 3.0% - 3.5% ] 3.06% | 766,485 | 6.7% |
[ 3.5% - 4.0% ] 3.59% | 516,375 | 6.7% |
[ 4.0% - 4.5% ] 4.04% | 301,446 | 7.7% |
[ 4.5% - 5.0% ] 4.60% | 1,045,677 | 5.9% |
[ 4.5% - 5.0% ] 4.94% | 315,390 | 6.5% |
[ 5.0% - 5.5% ] 5.47% | 294,379 | 7.5% |
[ 5.5% - 6.0% ] 5.97% | 276,185 | 6.8% |
[ 6.0% - 6.5% ] 6.41% | 142,575 | 6.2% |
[ 6.5% - 7.0% ] 6.96% | 31,840 | 12.0% |
[ 7.0% - 7.5% ] 7.39% | 39,710 | 8.0% |
[ 7.5% - 8.0% ] 7.81% | 53,290 | 6.3% |
[ 8.0% - 8.5% ] 8.38% | 1,981 | 2.7% |
[ 8.5% - 9.0% ] 8.78% | 18,050 | 12.9% |
[ 9.0% - 9.5% ] 9.31% | 7,603 | 19.0% |
[ 9.5% - 10.0% ] 9.72% | 11,305 | 8.4% |
[ 10.0% - 10.5% ] 10.26% | 51,774 | 7.9% |
[ 10.5% - 11.0% ] 10.80% | 5,250 | 5.6% |
[ 11.0% - 11.5% ] 11.16% | 14,466 | 6.3% |
[ 11.5% - 12.0% ] 11.91% | 17,529 | 4.2% |
[ 12.0% - 12.5% ] 12.09% | 3,532 | 16.4% |
[ 12.5% - 13.0% ] 12.73% | 2,183 | 17.8% |
[ 13.0% - 13.5% ] 13.19% | 2,662 | 11.5% |
[ 13.5% - 14.0% ] 13.74% | 5,598 | 13.0% |
[ 14.0% - 14.5% ] 14.43% | 4,179 | 6.1% |
[ 15.0% - 15.5% ] 15.05% | 5,894 | 5.6% |
[ 16.0% - 16.5% ] 16.04% | 1,496 | 13.4% |
[ 16.5% - 17.0% ] 16.57% | 2,197 | 37.0% |
[ 17.0% - 17.5% ] 17.27% | 880 | 20.2% |
[ 17.5% - 18.0% ] 17.98% | 3,181 | 5.1% |
[ 18.0% - 18.5% ] 18.27% | 821 | 5.8% |
[ 18.5% - 19.0% ] 18.75% | 10,473 | 3.4% |
[ 19.5% - 20.0% ] 19.75% | 162 | 2.0% |
[ 20.5% - 21.0% ] 20.51% | 156 | 16.0% |
[ 20.5% - 21.0% ] 20.62% | 20,483 | 2.8% |
[ 22.0% - 22.5% ] 22.40% | 2,906 | 0.99% |
[ 22.5% - 23.0% ] 22.60% | 2,456 | 4.7% |
[ 23.0% - 23.5% ] 23.24% | 5,396 | 4.3% |
[ 24.5% - 25.0% ] 24.53% | 428 | 32.4% |
[ 25.5% - 26.0% ] 25.56% | 360 | 14.9% |
[ 26.5% - 27.0% ] 26.65% | 2,165 | 1.3% |
[ 30.5% - 31.0% ] 30.82% | 1,603 | 25.6% |
[ 32.5% - 33.0% ] 32.97% | 185 | 7.4% |
[ 44.0% - 44.5% ] 44.39% | 1,122 | 10.0% |
[ 50.0% - 50.5% ] 50.00% | 82 | 46.9% |