Luxembourger Disability Age 5 to 17

COMPARE

Luxembourger
Race
Ancestry
AfghanAfricanAlaska NativeAlaskan AthabascanAlbanianAleutAlsatianAmericanApacheArabArapahoArgentineanArmenianAssyrian/Chaldean/SyriacAustralianAustrianBahamianBangladeshiBarbadianBasqueBelgianBelizeanBermudanBhutaneseBlackfeetBolivianBrazilianBritishBritish West IndianBulgarianBurmeseCajunCambodianCanadianCape VerdeanCarpatho RusynCelticCentral AmericanCentral American IndianCherokeeCheyenneChickasawChileanChineseChippewaChoctawColombianColvilleComancheCosta RicanCreeCreekCroatianCrowCubanCypriotCzechCzechoslovakianDanishDelawareDominicanDutchDutch West IndianEastern EuropeanEcuadorianEgyptianEnglishEstonianEthiopianEuropeanFijianFilipinoFinnishFrenchFrench American IndianFrench CanadianGermanGerman RussianGhanaianGreekGuamanian/ChamorroGuatemalanGuyaneseHaitianHmongHonduranHopiHoumaHungarianIcelanderIndian (Asian)IndonesianInupiatIranianIraqiIrishIroquoisIsraeliItalianJamaicanJapaneseJordanianKenyanKiowaKoreanLaotianLatvianLebaneseLiberianLithuanianLumbeeLuxembourgerMacedonianMalaysianMalteseMarshalleseMenomineeMexicanMexican American IndianMongolianMoroccanNative HawaiianNavajoNepaleseNew ZealanderNicaraguanNigerianNorthern EuropeanNorwegianOkinawanOsageOttawaPaiutePakistaniPalestinianPanamanianParaguayanPennsylvania GermanPeruvianPimaPolishPortuguesePotawatomiPuebloPuerto RicanPuget Sound SalishRomanianRussianSalvadoranSamoanScandinavianScotch-IrishScottishSeminoleSenegaleseSerbianShoshoneSierra LeoneanSiouxSlavicSlovakSloveneSomaliSouth AfricanSouth AmericanSouth American IndianSoviet UnionSpaniardSpanishSpanish AmericanSpanish American IndianSri LankanSubsaharan AfricanSudaneseSwedishSwissSyrianTaiwaneseThaiTlingit-HaidaTohono O'OdhamTonganTrinidadian and TobagonianTsimshianTurkishU.S. Virgin IslanderUgandanUkrainianUruguayanUteVenezuelanVietnameseWelshWest IndianYakamaYaquiYugoslavianYumanYup'ikZimbabwean
Immigration
NonimmigrantsImmigrantsAfghanistanAfricaAlbaniaArgentinaArmeniaAsiaAustraliaAustriaBahamasBangladeshBarbadosBelarusBelgiumBelizeBoliviaBosnia and HerzegovinaBrazilBulgariaBurma/MyanmarCabo VerdeCambodiaCameroonCanadaCaribbeanCentral AmericaChileChinaColombiaCongoCosta RicaCroatiaCubaCzechoslovakiaDenmarkDominicaDominican RepublicEastern AfricaEastern AsiaEastern EuropeEcuadorEgyptEl SalvadorEnglandEritreaEthiopiaEuropeFijiFranceGermanyGhanaGreeceGrenadaGuatemalaGuyanaHaitiHondurasHong KongHungaryIndiaIndonesiaIranIraqIrelandIsraelItalyJamaicaJapanJordanKazakhstanKenyaKoreaKuwaitLaosLatin AmericaLatviaLebanonLiberiaLithuaniaMalaysiaMexicoMicronesiaMiddle AfricaMoldovaMoroccoNepalNetherlandsNicaraguaNigeriaNorth AmericaNorth MacedoniaNorthern AfricaNorthern EuropeNorwayOceaniaPakistanPanamaPeruPhilippinesPolandPortugalRomaniaRussiaSaudi ArabiaScotlandSenegalSerbiaSierra LeoneSingaporeSomaliaSouth AfricaSouth AmericaSouth Central AsiaSouth Eastern AsiaSouthern EuropeSpainSri LankaSt. Vincent and the GrenadinesSudanSwedenSwitzerlandSyriaTaiwanThailandTrinidad and TobagoTurkeyUgandaUkraineUruguayUzbekistanVenezuelaVietnamWest IndiesWestern AfricaWestern AsiaWestern EuropeYemenZaireZimbabweAzores
Select to Compare
Race
Ancestry
AfghanAfricanAlaska NativeAlaskan AthabascanAlbanianAleutAlsatianAmericanApacheArabArapahoArgentineanArmenianAssyrian/Chaldean/SyriacAustralianAustrianBahamianBangladeshiBarbadianBasqueBelgianBelizeanBermudanBhutaneseBlackfeetBolivianBrazilianBritishBritish West IndianBulgarianBurmeseCajunCambodianCanadianCape VerdeanCarpatho RusynCelticCentral AmericanCentral American IndianCherokeeCheyenneChickasawChileanChineseChippewaChoctawColombianColvilleComancheCosta RicanCreeCreekCroatianCrowCubanCypriotCzechCzechoslovakianDanishDelawareDominicanDutchDutch West IndianEastern EuropeanEcuadorianEgyptianEnglishEstonianEthiopianEuropeanFijianFilipinoFinnishFrenchFrench American IndianFrench CanadianGermanGerman RussianGhanaianGreekGuamanian/ChamorroGuatemalanGuyaneseHaitianHmongHonduranHopiHoumaHungarianIcelanderIndian (Asian)IndonesianInupiatIranianIraqiIrishIroquoisIsraeliItalianJamaicanJapaneseJordanianKenyanKiowaKoreanLaotianLatvianLebaneseLiberianLithuanianLumbeeMacedonianMalaysianMalteseMarshalleseMenomineeMexicanMexican American IndianMongolianMoroccanNative HawaiianNavajoNepaleseNew ZealanderNicaraguanNigerianNorthern EuropeanNorwegianOkinawanOsageOttawaPaiutePakistaniPalestinianPanamanianParaguayanPennsylvania GermanPeruvianPimaPolishPortuguesePotawatomiPuebloPuerto RicanPuget Sound SalishRomanianRussianSalvadoranSamoanScandinavianScotch-IrishScottishSeminoleSenegaleseSerbianShoshoneSierra LeoneanSiouxSlavicSlovakSloveneSomaliSouth AfricanSouth AmericanSouth American IndianSoviet UnionSpaniardSpanishSpanish AmericanSpanish American IndianSri LankanSubsaharan AfricanSudaneseSwedishSwissSyrianTaiwaneseThaiTlingit-HaidaTohono O'OdhamTonganTrinidadian and TobagonianTsimshianTurkishU.S. Virgin IslanderUgandanUkrainianUruguayanUteVenezuelanVietnameseWelshWest IndianYakamaYaquiYugoslavianYumanYup'ikZimbabwean
Immigration
NonimmigrantsImmigrantsAfghanistanAfricaAlbaniaArgentinaArmeniaAsiaAustraliaAustriaBahamasBangladeshBarbadosBelarusBelgiumBelizeBoliviaBosnia and HerzegovinaBrazilBulgariaBurma/MyanmarCabo VerdeCambodiaCameroonCanadaCaribbeanCentral AmericaChileChinaColombiaCongoCosta RicaCroatiaCubaCzechoslovakiaDenmarkDominicaDominican RepublicEastern AfricaEastern AsiaEastern EuropeEcuadorEgyptEl SalvadorEnglandEritreaEthiopiaEuropeFijiFranceGermanyGhanaGreeceGrenadaGuatemalaGuyanaHaitiHondurasHong KongHungaryIndiaIndonesiaIranIraqIrelandIsraelItalyJamaicaJapanJordanKazakhstanKenyaKoreaKuwaitLaosLatin AmericaLatviaLebanonLiberiaLithuaniaMalaysiaMexicoMicronesiaMiddle AfricaMoldovaMoroccoNepalNetherlandsNicaraguaNigeriaNorth AmericaNorth MacedoniaNorthern AfricaNorthern EuropeNorwayOceaniaPakistanPanamaPeruPhilippinesPolandPortugalRomaniaRussiaSaudi ArabiaScotlandSenegalSerbiaSierra LeoneSingaporeSomaliaSouth AfricaSouth AmericaSouth Central AsiaSouth Eastern AsiaSouthern EuropeSpainSri LankaSt. Vincent and the GrenadinesSudanSwedenSwitzerlandSyriaTaiwanThailandTrinidad and TobagoTurkeyUgandaUkraineUruguayUzbekistanVenezuelaVietnamWest IndiesWestern AfricaWestern AsiaWestern EuropeYemenZaireZimbabweAzores
Disability Age 5 to 17
Income
Poverty
Unemployment
Labor Participation
Family Structure
Vehicle Availability
Education Level
Disability

Luxembourger Disability Age 5 to 17
Exceptional

5.3%
DISABILITY | AGE 5 TO 17
99.2/ 100
METRIC RATING
92nd/ 347
METRIC RANK

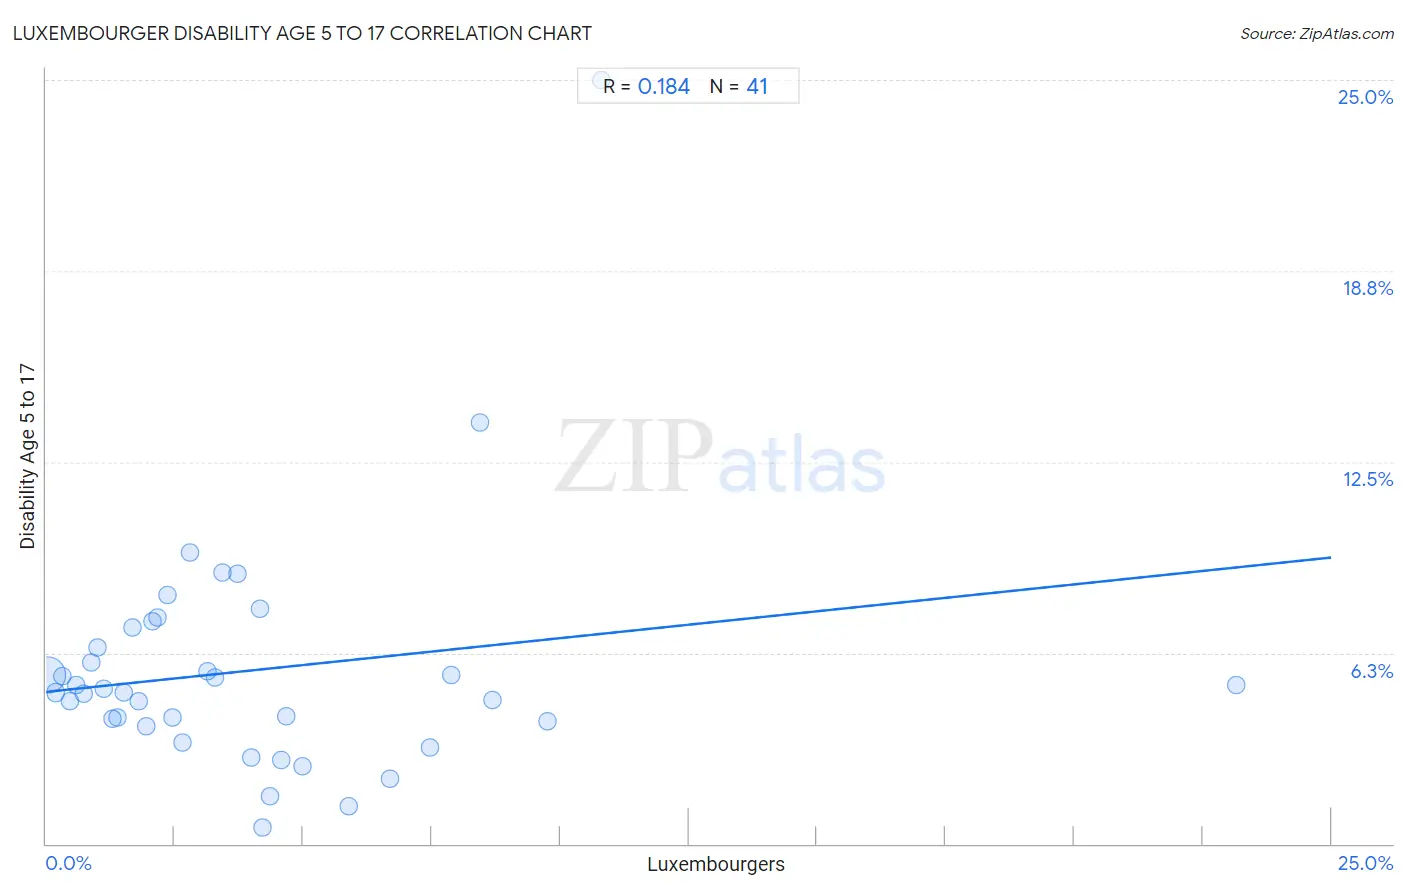
Luxembourger Disability Age 5 to 17 Correlation Chart

The statistical analysis conducted on geographies consisting of 143,736,782 people shows a poor positive correlation between the proportion of Luxembourgers and percentage of population with a disability between the ages 5 and 17 in the United States with a correlation coefficient (R) of 0.184 and weighted average of 5.3%. On average, for every 1% (one percent) increase in Luxembourgers within a typical geography, there is an increase of 0.18% in percentage of population with a disability between the ages 5 and 17.
Luxembourger Disability Age 5 to 17
It is essential to understand that the correlation between the percentage of Luxembourgers and percentage of population with a disability between the ages 5 and 17 does not imply a direct cause-and-effect relationship. It remains uncertain whether the presence of Luxembourgers influences an upward or downward trend in the level of percentage of population with a disability between the ages 5 and 17 within an area, or if Luxembourgers simply ended up residing in those areas with higher or lower levels of percentage of population with a disability between the ages 5 and 17 due to other factors.

Demographics Similar to Luxembourgers by Disability Age 5 to 17

In terms of disability age 5 to 17, the demographic groups most similar to Luxembourgers are Mongolian (5.3%, a difference of 0.010%), Immigrants from Peru (5.3%, a difference of 0.080%), Immigrants from Jordan (5.3%, a difference of 0.14%), Immigrants from Grenada (5.3%, a difference of 0.16%), and Immigrants from Kuwait (5.3%, a difference of 0.30%).
DemographicsRating | RankDisability Age 5 to 17
Bulgarians
99.4
/100
|
#85
Exceptional
5.2%
Immigrants from St. Vincent and the Grenadines
99.4
/100
|
#86
Exceptional
5.2%
Eastern Europeans
99.4
/100
|
#87
Exceptional
5.2%
Immigrants from Croatia
99.4
/100
|
#88
Exceptional
5.2%
Immigrants from Spain
99.4
/100
|
#89
Exceptional
5.2%
Immigrants from Kuwait
99.4
/100
|
#90
Exceptional
5.3%
Mongolians
99.2
/100
|
#91
Exceptional
5.3%
Luxembourgers
99.2
/100
|
#92
Exceptional
5.3%
Immigrants from Peru
99.1
/100
|
#93
Exceptional
5.3%
Immigrants from Jordan
99.1
/100
|
#94
Exceptional
5.3%
Immigrants from Grenada
99.1
/100
|
#95
Exceptional
5.3%
Immigrants from El Salvador
99.0
/100
|
#96
Exceptional
5.3%
Immigrants from Europe
99.0
/100
|
#97
Exceptional
5.3%
Immigrants from Austria
98.9
/100
|
#98
Exceptional
5.3%
Cambodians
98.8
/100
|
#99
Exceptional
5.3%

Luxembourger Disability Age 5 to 17 Correlation Summary

MeasurementLuxembourger DataDisability Age 5 to 17 Data
Minimum0.026%0.53%
Maximum23.2%25.0%
Range23.1%24.5%
Mean4.0%5.7%
Median2.8%5.0%
Interquartile 25% (IQ1)1.3%3.9%
Interquartile 75% (IQ3)4.8%6.8%
Interquartile Range (IQR)3.5%2.8%
Standard Deviation (Sample)4.1%4.0%
Standard Deviation (Population)4.1%3.9%

Correlation Details

Luxembourger PercentileSample SizeDisability Age 5 to 17
[
0.0%
-
0.5%
]
0.026%
132,646,8625.5%
[
0.0%
-
0.5%
]
0.18%
7,477,2174.9%
[
0.0%
-
0.5%
]
0.32%
1,529,8135.5%
[
0.0%
-
0.5%
]
0.46%
832,6104.7%
[
0.5%
-
1.0%
]
0.59%
406,4605.2%
[
0.5%
-
1.0%
]
0.72%
192,6944.9%
[
0.5%
-
1.0%
]
0.88%
164,7015.9%
[
1.0%
-
1.5%
]
1.01%
84,9786.4%
[
1.0%
-
1.5%
]
1.12%
46,8915.1%
[
1.0%
-
1.5%
]
1.28%
40,3204.1%
[
1.0%
-
1.5%
]
1.39%
105,9334.1%
[
1.5%
-
2.0%
]
1.51%
26,6235.0%
[
1.5%
-
2.0%
]
1.68%
6,9197.1%
[
1.5%
-
2.0%
]
1.81%
71,1184.7%
[
1.5%
-
2.0%
]
1.95%
4,8213.8%
[
2.0%
-
2.5%
]
2.06%
18,6627.3%
[
2.0%
-
2.5%
]
2.17%
4,4727.4%
[
2.0%
-
2.5%
]
2.35%
14,9068.2%
[
2.0%
-
2.5%
]
2.45%
4,5794.1%
[
2.5%
-
3.0%
]
2.66%
3,2753.3%
[
2.5%
-
3.0%
]
2.80%
1439.5%
[
3.0%
-
3.5%
]
3.13%
1,9815.7%
[
3.0%
-
3.5%
]
3.27%
6,4815.4%
[
3.0%
-
3.5%
]
3.44%
9608.9%
[
3.5%
-
4.0%
]
3.73%
2,5758.9%
[
3.5%
-
4.0%
]
3.98%
5,0292.8%
[
4.0%
-
4.5%
]
4.16%
5297.7%
[
4.0%
-
4.5%
]
4.21%
2,4460.53%
[
4.0%
-
4.5%
]
4.36%
4,9071.5%
[
4.5%
-
5.0%
]
4.56%
2,4332.7%
[
4.5%
-
5.0%
]
4.67%
7494.2%
[
4.5%
-
5.0%
]
4.99%
3,7262.5%
[
5.5%
-
6.0%
]
5.88%
5,4421.2%
[
6.5%
-
7.0%
]
6.69%
1,1362.1%
[
7.0%
-
7.5%
]
7.46%
3,0433.1%
[
7.5%
-
8.0%
]
7.88%
3,0965.5%
[
8.0%
-
8.5%
]
8.43%
1,28113.8%
[
8.5%
-
9.0%
]
8.69%
2,0954.7%
[
9.5%
-
10.0%
]
9.76%
3,5964.0%
[
10.5%
-
11.0%
]
10.80%
28725.0%
[
23.0%
-
23.5%
]
23.16%
9935.2%