Jordanian Disability Age 5 to 17

COMPARE

Jordanian
Race
Ancestry
AfghanAfricanAlaska NativeAlaskan AthabascanAlbanianAleutAlsatianAmericanApacheArabArapahoArgentineanArmenianAssyrian/Chaldean/SyriacAustralianAustrianBahamianBangladeshiBarbadianBasqueBelgianBelizeanBermudanBhutaneseBlackfeetBolivianBrazilianBritishBritish West IndianBulgarianBurmeseCajunCambodianCanadianCape VerdeanCarpatho RusynCelticCentral AmericanCentral American IndianCherokeeCheyenneChickasawChileanChineseChippewaChoctawColombianColvilleComancheCosta RicanCreeCreekCroatianCrowCubanCypriotCzechCzechoslovakianDanishDelawareDominicanDutchDutch West IndianEastern EuropeanEcuadorianEgyptianEnglishEstonianEthiopianEuropeanFijianFilipinoFinnishFrenchFrench American IndianFrench CanadianGermanGerman RussianGhanaianGreekGuamanian/ChamorroGuatemalanGuyaneseHaitianHmongHonduranHopiHoumaHungarianIcelanderIndian (Asian)IndonesianInupiatIranianIraqiIrishIroquoisIsraeliItalianJamaicanJapaneseJordanianKenyanKiowaKoreanLaotianLatvianLebaneseLiberianLithuanianLumbeeLuxembourgerMacedonianMalaysianMalteseMarshalleseMenomineeMexicanMexican American IndianMongolianMoroccanNative HawaiianNavajoNepaleseNew ZealanderNicaraguanNigerianNorthern EuropeanNorwegianOkinawanOsageOttawaPaiutePakistaniPalestinianPanamanianParaguayanPennsylvania GermanPeruvianPimaPolishPortuguesePotawatomiPuebloPuerto RicanPuget Sound SalishRomanianRussianSalvadoranSamoanScandinavianScotch-IrishScottishSeminoleSenegaleseSerbianShoshoneSierra LeoneanSiouxSlavicSlovakSloveneSomaliSouth AfricanSouth AmericanSouth American IndianSoviet UnionSpaniardSpanishSpanish AmericanSpanish American IndianSri LankanSubsaharan AfricanSudaneseSwedishSwissSyrianTaiwaneseThaiTlingit-HaidaTohono O'OdhamTonganTrinidadian and TobagonianTsimshianTurkishU.S. Virgin IslanderUgandanUkrainianUruguayanUteVenezuelanVietnameseWelshWest IndianYakamaYaquiYugoslavianYumanYup'ikZimbabwean
Immigration
NonimmigrantsImmigrantsAfghanistanAfricaAlbaniaArgentinaArmeniaAsiaAustraliaAustriaBahamasBangladeshBarbadosBelarusBelgiumBelizeBoliviaBosnia and HerzegovinaBrazilBulgariaBurma/MyanmarCabo VerdeCambodiaCameroonCanadaCaribbeanCentral AmericaChileChinaColombiaCongoCosta RicaCroatiaCubaCzechoslovakiaDenmarkDominicaDominican RepublicEastern AfricaEastern AsiaEastern EuropeEcuadorEgyptEl SalvadorEnglandEritreaEthiopiaEuropeFijiFranceGermanyGhanaGreeceGrenadaGuatemalaGuyanaHaitiHondurasHong KongHungaryIndiaIndonesiaIranIraqIrelandIsraelItalyJamaicaJapanJordanKazakhstanKenyaKoreaKuwaitLaosLatin AmericaLatviaLebanonLiberiaLithuaniaMalaysiaMexicoMicronesiaMiddle AfricaMoldovaMoroccoNepalNetherlandsNicaraguaNigeriaNorth AmericaNorth MacedoniaNorthern AfricaNorthern EuropeNorwayOceaniaPakistanPanamaPeruPhilippinesPolandPortugalRomaniaRussiaSaudi ArabiaScotlandSenegalSerbiaSierra LeoneSingaporeSomaliaSouth AfricaSouth AmericaSouth Central AsiaSouth Eastern AsiaSouthern EuropeSpainSri LankaSt. Vincent and the GrenadinesSudanSwedenSwitzerlandSyriaTaiwanThailandTrinidad and TobagoTurkeyUgandaUkraineUruguayUzbekistanVenezuelaVietnamWest IndiesWestern AfricaWestern AsiaWestern EuropeYemenZaireZimbabweAzores
Select to Compare
Race
Ancestry
AfghanAfricanAlaska NativeAlaskan AthabascanAlbanianAleutAlsatianAmericanApacheArabArapahoArgentineanArmenianAssyrian/Chaldean/SyriacAustralianAustrianBahamianBangladeshiBarbadianBasqueBelgianBelizeanBermudanBhutaneseBlackfeetBolivianBrazilianBritishBritish West IndianBulgarianBurmeseCajunCambodianCanadianCape VerdeanCarpatho RusynCelticCentral AmericanCentral American IndianCherokeeCheyenneChickasawChileanChineseChippewaChoctawColombianColvilleComancheCosta RicanCreeCreekCroatianCrowCubanCypriotCzechCzechoslovakianDanishDelawareDominicanDutchDutch West IndianEastern EuropeanEcuadorianEgyptianEnglishEstonianEthiopianEuropeanFijianFilipinoFinnishFrenchFrench American IndianFrench CanadianGermanGerman RussianGhanaianGreekGuamanian/ChamorroGuatemalanGuyaneseHaitianHmongHonduranHopiHoumaHungarianIcelanderIndian (Asian)IndonesianInupiatIranianIraqiIrishIroquoisIsraeliItalianJamaicanJapaneseKenyanKiowaKoreanLaotianLatvianLebaneseLiberianLithuanianLumbeeLuxembourgerMacedonianMalaysianMalteseMarshalleseMenomineeMexicanMexican American IndianMongolianMoroccanNative HawaiianNavajoNepaleseNew ZealanderNicaraguanNigerianNorthern EuropeanNorwegianOkinawanOsageOttawaPaiutePakistaniPalestinianPanamanianParaguayanPennsylvania GermanPeruvianPimaPolishPortuguesePotawatomiPuebloPuerto RicanPuget Sound SalishRomanianRussianSalvadoranSamoanScandinavianScotch-IrishScottishSeminoleSenegaleseSerbianShoshoneSierra LeoneanSiouxSlavicSlovakSloveneSomaliSouth AfricanSouth AmericanSouth American IndianSoviet UnionSpaniardSpanishSpanish AmericanSpanish American IndianSri LankanSubsaharan AfricanSudaneseSwedishSwissSyrianTaiwaneseThaiTlingit-HaidaTohono O'OdhamTonganTrinidadian and TobagonianTsimshianTurkishU.S. Virgin IslanderUgandanUkrainianUruguayanUteVenezuelanVietnameseWelshWest IndianYakamaYaquiYugoslavianYumanYup'ikZimbabwean
Immigration
NonimmigrantsImmigrantsAfghanistanAfricaAlbaniaArgentinaArmeniaAsiaAustraliaAustriaBahamasBangladeshBarbadosBelarusBelgiumBelizeBoliviaBosnia and HerzegovinaBrazilBulgariaBurma/MyanmarCabo VerdeCambodiaCameroonCanadaCaribbeanCentral AmericaChileChinaColombiaCongoCosta RicaCroatiaCubaCzechoslovakiaDenmarkDominicaDominican RepublicEastern AfricaEastern AsiaEastern EuropeEcuadorEgyptEl SalvadorEnglandEritreaEthiopiaEuropeFijiFranceGermanyGhanaGreeceGrenadaGuatemalaGuyanaHaitiHondurasHong KongHungaryIndiaIndonesiaIranIraqIrelandIsraelItalyJamaicaJapanJordanKazakhstanKenyaKoreaKuwaitLaosLatin AmericaLatviaLebanonLiberiaLithuaniaMalaysiaMexicoMicronesiaMiddle AfricaMoldovaMoroccoNepalNetherlandsNicaraguaNigeriaNorth AmericaNorth MacedoniaNorthern AfricaNorthern EuropeNorwayOceaniaPakistanPanamaPeruPhilippinesPolandPortugalRomaniaRussiaSaudi ArabiaScotlandSenegalSerbiaSierra LeoneSingaporeSomaliaSouth AfricaSouth AmericaSouth Central AsiaSouth Eastern AsiaSouthern EuropeSpainSri LankaSt. Vincent and the GrenadinesSudanSwedenSwitzerlandSyriaTaiwanThailandTrinidad and TobagoTurkeyUgandaUkraineUruguayUzbekistanVenezuelaVietnamWest IndiesWestern AfricaWestern AsiaWestern EuropeYemenZaireZimbabweAzores
Disability Age 5 to 17
Income
Poverty
Unemployment
Labor Participation
Family Structure
Vehicle Availability
Education Level
Disability

Jordanian Disability Age 5 to 17
Exceptional

5.2%
DISABILITY | AGE 5 TO 17
99.7/ 100
METRIC RATING
71st/ 347
METRIC RANK

Jordanian Disability Age 5 to 17 Correlation Chart

The statistical analysis conducted on geographies consisting of 165,912,846 people shows a slight positive correlation between the proportion of Jordanians and percentage of population with a disability between the ages 5 and 17 in the United States with a correlation coefficient (R) of 0.074 and weighted average of 5.2%. On average, for every 1% (one percent) increase in Jordanians within a typical geography, there is an increase of 0.082% in percentage of population with a disability between the ages 5 and 17.
Jordanian Disability Age 5 to 17
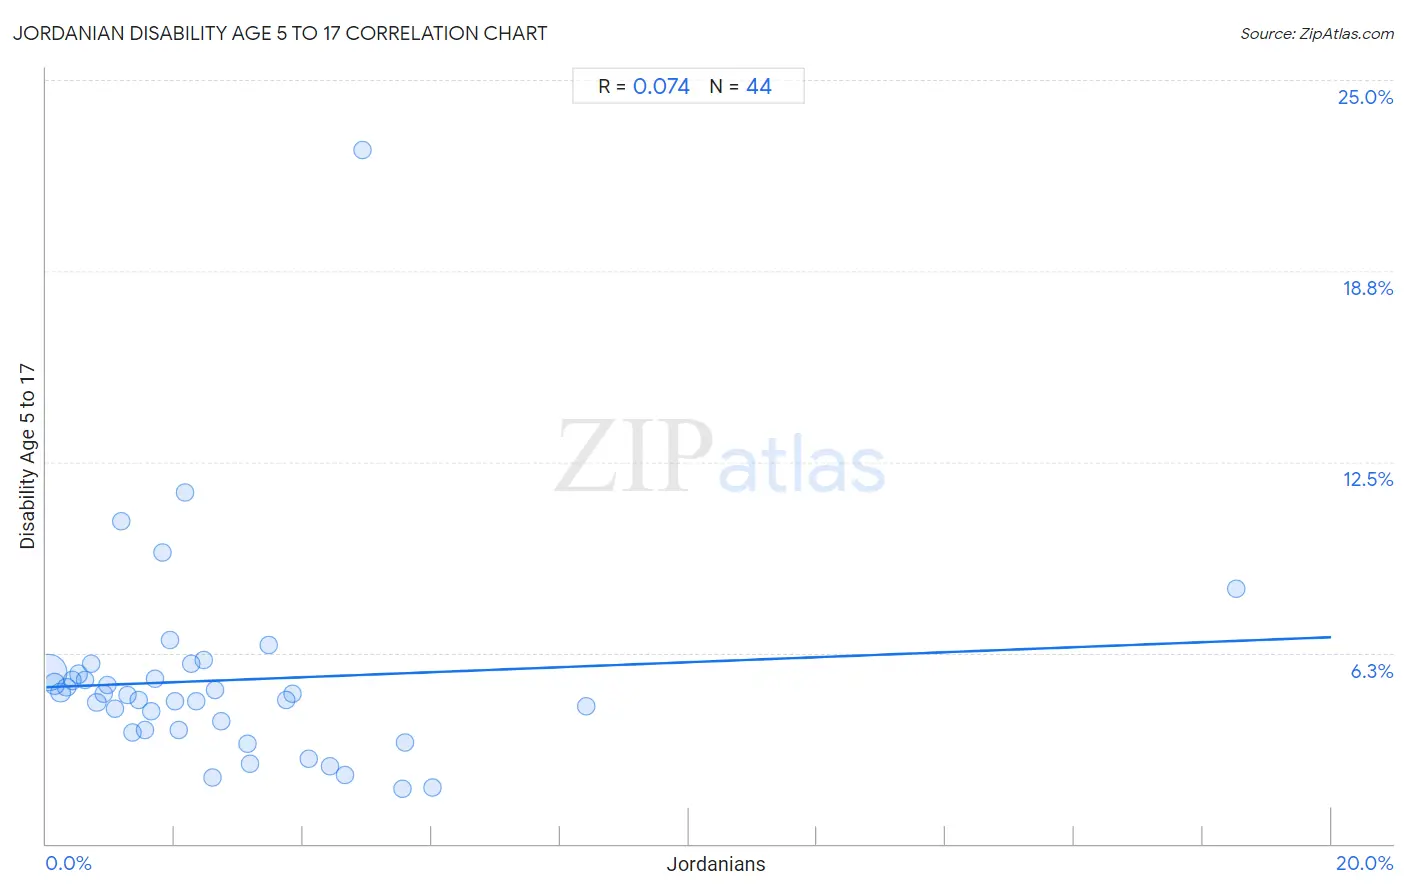
It is essential to understand that the correlation between the percentage of Jordanians and percentage of population with a disability between the ages 5 and 17 does not imply a direct cause-and-effect relationship. It remains uncertain whether the presence of Jordanians influences an upward or downward trend in the level of percentage of population with a disability between the ages 5 and 17 within an area, or if Jordanians simply ended up residing in those areas with higher or lower levels of percentage of population with a disability between the ages 5 and 17 due to other factors.

Demographics Similar to Jordanians by Disability Age 5 to 17

In terms of disability age 5 to 17, the demographic groups most similar to Jordanians are Immigrants from Vietnam (5.2%, a difference of 0.020%), Immigrants from Belgium (5.2%, a difference of 0.050%), Immigrants from Czechoslovakia (5.2%, a difference of 0.050%), Guyanese (5.2%, a difference of 0.080%), and Immigrants from Romania (5.2%, a difference of 0.12%).
DemographicsRating | RankDisability Age 5 to 17
Immigrants from South Eastern Asia
99.8
/100
|
#64
Exceptional
5.2%
Immigrants from Greece
99.8
/100
|
#65
Exceptional
5.2%
Palestinians
99.8
/100
|
#66
Exceptional
5.2%
Macedonians
99.8
/100
|
#67
Exceptional
5.2%
Immigrants from Syria
99.7
/100
|
#68
Exceptional
5.2%
Guyanese
99.7
/100
|
#69
Exceptional
5.2%
Immigrants from Belgium
99.7
/100
|
#70
Exceptional
5.2%
Jordanians
99.7
/100
|
#71
Exceptional
5.2%
Immigrants from Vietnam
99.7
/100
|
#72
Exceptional
5.2%
Immigrants from Czechoslovakia
99.7
/100
|
#73
Exceptional
5.2%
Immigrants from Romania
99.7
/100
|
#74
Exceptional
5.2%
Immigrants from Moldova
99.6
/100
|
#75
Exceptional
5.2%
Immigrants from Guyana
99.6
/100
|
#76
Exceptional
5.2%
Immigrants from Kazakhstan
99.6
/100
|
#77
Exceptional
5.2%
Immigrants from Cuba
99.6
/100
|
#78
Exceptional
5.2%

Jordanian Disability Age 5 to 17 Correlation Summary

MeasurementJordanian DataDisability Age 5 to 17 Data
Minimum0.034%1.8%
Maximum18.5%22.7%
Range18.5%20.9%
Mean2.8%5.3%
Median2.0%4.9%
Interquartile 25% (IQ1)1.0%3.7%
Interquartile 75% (IQ3)3.6%5.6%
Interquartile Range (IQR)2.6%1.9%
Standard Deviation (Sample)3.0%3.4%
Standard Deviation (Population)3.0%3.3%

Correlation Details

Jordanian PercentileSample SizeDisability Age 5 to 17
[
0.0%
-
0.5%
]
0.034%
122,815,0685.6%
[
0.0%
-
0.5%
]
0.13%
22,019,7025.2%
[
0.0%
-
0.5%
]
0.22%
8,376,9784.9%
[
0.0%
-
0.5%
]
0.32%
3,322,2585.1%
[
0.0%
-
0.5%
]
0.41%
2,293,5255.3%
[
0.5%
-
1.0%
]
0.51%
2,319,4985.5%
[
0.5%
-
1.0%
]
0.60%
859,9555.4%
[
0.5%
-
1.0%
]
0.69%
670,6305.9%
[
0.5%
-
1.0%
]
0.79%
642,2154.6%
[
0.5%
-
1.0%
]
0.89%
480,9284.9%
[
0.5%
-
1.0%
]
0.96%
429,8205.2%
[
1.0%
-
1.5%
]
1.06%
443,4614.4%
[
1.0%
-
1.5%
]
1.17%
67,51810.6%
[
1.0%
-
1.5%
]
1.26%
111,2854.9%
[
1.0%
-
1.5%
]
1.34%
154,0503.6%
[
1.0%
-
1.5%
]
1.43%
189,7544.7%
[
1.5%
-
2.0%
]
1.54%
119,2273.7%
[
1.5%
-
2.0%
]
1.63%
105,3174.3%
[
1.5%
-
2.0%
]
1.70%
20,6085.4%
[
1.5%
-
2.0%
]
1.82%
42,8039.5%
[
1.5%
-
2.0%
]
1.92%
39,8616.7%
[
2.0%
-
2.5%
]
2.01%
50,5614.6%
[
2.0%
-
2.5%
]
2.06%
11,1893.7%
[
2.0%
-
2.5%
]
2.16%
1,15511.5%
[
2.0%
-
2.5%
]
2.26%
31,2595.9%
[
2.0%
-
2.5%
]
2.33%
14,9154.7%
[
2.0%
-
2.5%
]
2.46%
55,0256.0%
[
2.5%
-
3.0%
]
2.59%
23,1732.1%
[
2.5%
-
3.0%
]
2.62%
38,1445.0%
[
2.5%
-
3.0%
]
2.71%
17,2804.0%
[
3.0%
-
3.5%
]
3.14%
3,3173.3%
[
3.0%
-
3.5%
]
3.16%
8,5352.6%
[
3.0%
-
3.5%
]
3.46%
7,8046.5%
[
3.5%
-
4.0%
]
3.74%
11,0844.7%
[
3.5%
-
4.0%
]
3.82%
11,9774.9%
[
4.0%
-
4.5%
]
4.09%
38,0102.8%
[
4.0%
-
4.5%
]
4.42%
8,2202.6%
[
4.5%
-
5.0%
]
4.65%
20,5642.2%
[
4.5%
-
5.0%
]
4.92%
1,38122.7%
[
5.5%
-
6.0%
]
5.55%
9,9601.8%
[
5.5%
-
6.0%
]
5.59%
6,4963.3%
[
6.0%
-
6.5%
]
6.01%
8,0241.8%
[
8.0%
-
8.5%
]
8.41%
10,2584.5%
[
18.5%
-
19.0%
]
18.52%
548.3%