Cheyenne Disability Age 5 to 17

COMPARE

Cheyenne
Race
Ancestry
AfghanAfricanAlaska NativeAlaskan AthabascanAlbanianAleutAlsatianAmericanApacheArabArapahoArgentineanArmenianAssyrian/Chaldean/SyriacAustralianAustrianBahamianBangladeshiBarbadianBasqueBelgianBelizeanBermudanBhutaneseBlackfeetBolivianBrazilianBritishBritish West IndianBulgarianBurmeseCajunCambodianCanadianCape VerdeanCarpatho RusynCelticCentral AmericanCentral American IndianCherokeeCheyenneChickasawChileanChineseChippewaChoctawColombianColvilleComancheCosta RicanCreeCreekCroatianCrowCubanCypriotCzechCzechoslovakianDanishDelawareDominicanDutchDutch West IndianEastern EuropeanEcuadorianEgyptianEnglishEstonianEthiopianEuropeanFijianFilipinoFinnishFrenchFrench American IndianFrench CanadianGermanGerman RussianGhanaianGreekGuamanian/ChamorroGuatemalanGuyaneseHaitianHmongHonduranHopiHoumaHungarianIcelanderIndian (Asian)IndonesianInupiatIranianIraqiIrishIroquoisIsraeliItalianJamaicanJapaneseJordanianKenyanKiowaKoreanLaotianLatvianLebaneseLiberianLithuanianLumbeeLuxembourgerMacedonianMalaysianMalteseMarshalleseMenomineeMexicanMexican American IndianMongolianMoroccanNative HawaiianNavajoNepaleseNew ZealanderNicaraguanNigerianNorthern EuropeanNorwegianOkinawanOsageOttawaPaiutePakistaniPalestinianPanamanianParaguayanPennsylvania GermanPeruvianPimaPolishPortuguesePotawatomiPuebloPuerto RicanPuget Sound SalishRomanianRussianSalvadoranSamoanScandinavianScotch-IrishScottishSeminoleSenegaleseSerbianShoshoneSierra LeoneanSiouxSlavicSlovakSloveneSomaliSouth AfricanSouth AmericanSouth American IndianSoviet UnionSpaniardSpanishSpanish AmericanSpanish American IndianSri LankanSubsaharan AfricanSudaneseSwedishSwissSyrianTaiwaneseThaiTlingit-HaidaTohono O'OdhamTonganTrinidadian and TobagonianTsimshianTurkishU.S. Virgin IslanderUgandanUkrainianUruguayanUteVenezuelanVietnameseWelshWest IndianYakamaYaquiYugoslavianYumanYup'ikZimbabwean
Immigration
NonimmigrantsImmigrantsAfghanistanAfricaAlbaniaArgentinaArmeniaAsiaAustraliaAustriaBahamasBangladeshBarbadosBelarusBelgiumBelizeBoliviaBosnia and HerzegovinaBrazilBulgariaBurma/MyanmarCabo VerdeCambodiaCameroonCanadaCaribbeanCentral AmericaChileChinaColombiaCongoCosta RicaCroatiaCubaCzechoslovakiaDenmarkDominicaDominican RepublicEastern AfricaEastern AsiaEastern EuropeEcuadorEgyptEl SalvadorEnglandEritreaEthiopiaEuropeFijiFranceGermanyGhanaGreeceGrenadaGuatemalaGuyanaHaitiHondurasHong KongHungaryIndiaIndonesiaIranIraqIrelandIsraelItalyJamaicaJapanJordanKazakhstanKenyaKoreaKuwaitLaosLatin AmericaLatviaLebanonLiberiaLithuaniaMalaysiaMexicoMicronesiaMiddle AfricaMoldovaMoroccoNepalNetherlandsNicaraguaNigeriaNorth AmericaNorth MacedoniaNorthern AfricaNorthern EuropeNorwayOceaniaPakistanPanamaPeruPhilippinesPolandPortugalRomaniaRussiaSaudi ArabiaScotlandSenegalSerbiaSierra LeoneSingaporeSomaliaSouth AfricaSouth AmericaSouth Central AsiaSouth Eastern AsiaSouthern EuropeSpainSri LankaSt. Vincent and the GrenadinesSudanSwedenSwitzerlandSyriaTaiwanThailandTrinidad and TobagoTurkeyUgandaUkraineUruguayUzbekistanVenezuelaVietnamWest IndiesWestern AfricaWestern AsiaWestern EuropeYemenZaireZimbabweAzores
Select to Compare
Race
Ancestry
AfghanAfricanAlaska NativeAlaskan AthabascanAlbanianAleutAlsatianAmericanApacheArabArapahoArgentineanArmenianAssyrian/Chaldean/SyriacAustralianAustrianBahamianBangladeshiBarbadianBasqueBelgianBelizeanBermudanBhutaneseBlackfeetBolivianBrazilianBritishBritish West IndianBulgarianBurmeseCajunCambodianCanadianCape VerdeanCarpatho RusynCelticCentral AmericanCentral American IndianCherokeeChickasawChileanChineseChippewaChoctawColombianColvilleComancheCosta RicanCreeCreekCroatianCrowCubanCypriotCzechCzechoslovakianDanishDelawareDominicanDutchDutch West IndianEastern EuropeanEcuadorianEgyptianEnglishEstonianEthiopianEuropeanFijianFilipinoFinnishFrenchFrench American IndianFrench CanadianGermanGerman RussianGhanaianGreekGuamanian/ChamorroGuatemalanGuyaneseHaitianHmongHonduranHopiHoumaHungarianIcelanderIndian (Asian)IndonesianInupiatIranianIraqiIrishIroquoisIsraeliItalianJamaicanJapaneseJordanianKenyanKiowaKoreanLaotianLatvianLebaneseLiberianLithuanianLumbeeLuxembourgerMacedonianMalaysianMalteseMarshalleseMenomineeMexicanMexican American IndianMongolianMoroccanNative HawaiianNavajoNepaleseNew ZealanderNicaraguanNigerianNorthern EuropeanNorwegianOkinawanOsageOttawaPaiutePakistaniPalestinianPanamanianParaguayanPennsylvania GermanPeruvianPimaPolishPortuguesePotawatomiPuebloPuerto RicanPuget Sound SalishRomanianRussianSalvadoranSamoanScandinavianScotch-IrishScottishSeminoleSenegaleseSerbianShoshoneSierra LeoneanSiouxSlavicSlovakSloveneSomaliSouth AfricanSouth AmericanSouth American IndianSoviet UnionSpaniardSpanishSpanish AmericanSpanish American IndianSri LankanSubsaharan AfricanSudaneseSwedishSwissSyrianTaiwaneseThaiTlingit-HaidaTohono O'OdhamTonganTrinidadian and TobagonianTsimshianTurkishU.S. Virgin IslanderUgandanUkrainianUruguayanUteVenezuelanVietnameseWelshWest IndianYakamaYaquiYugoslavianYumanYup'ikZimbabwean
Immigration
NonimmigrantsImmigrantsAfghanistanAfricaAlbaniaArgentinaArmeniaAsiaAustraliaAustriaBahamasBangladeshBarbadosBelarusBelgiumBelizeBoliviaBosnia and HerzegovinaBrazilBulgariaBurma/MyanmarCabo VerdeCambodiaCameroonCanadaCaribbeanCentral AmericaChileChinaColombiaCongoCosta RicaCroatiaCubaCzechoslovakiaDenmarkDominicaDominican RepublicEastern AfricaEastern AsiaEastern EuropeEcuadorEgyptEl SalvadorEnglandEritreaEthiopiaEuropeFijiFranceGermanyGhanaGreeceGrenadaGuatemalaGuyanaHaitiHondurasHong KongHungaryIndiaIndonesiaIranIraqIrelandIsraelItalyJamaicaJapanJordanKazakhstanKenyaKoreaKuwaitLaosLatin AmericaLatviaLebanonLiberiaLithuaniaMalaysiaMexicoMicronesiaMiddle AfricaMoldovaMoroccoNepalNetherlandsNicaraguaNigeriaNorth AmericaNorth MacedoniaNorthern AfricaNorthern EuropeNorwayOceaniaPakistanPanamaPeruPhilippinesPolandPortugalRomaniaRussiaSaudi ArabiaScotlandSenegalSerbiaSierra LeoneSingaporeSomaliaSouth AfricaSouth AmericaSouth Central AsiaSouth Eastern AsiaSouthern EuropeSpainSri LankaSt. Vincent and the GrenadinesSudanSwedenSwitzerlandSyriaTaiwanThailandTrinidad and TobagoTurkeyUgandaUkraineUruguayUzbekistanVenezuelaVietnamWest IndiesWestern AfricaWestern AsiaWestern EuropeYemenZaireZimbabweAzores
Disability Age 5 to 17
Income
Poverty
Unemployment
Labor Participation
Family Structure
Vehicle Availability
Education Level
Disability

Cheyenne Disability Age 5 to 17
Tragic

6.0%
DISABILITY | AGE 5 TO 17
0.2/ 100
METRIC RATING
274th/ 347
METRIC RANK

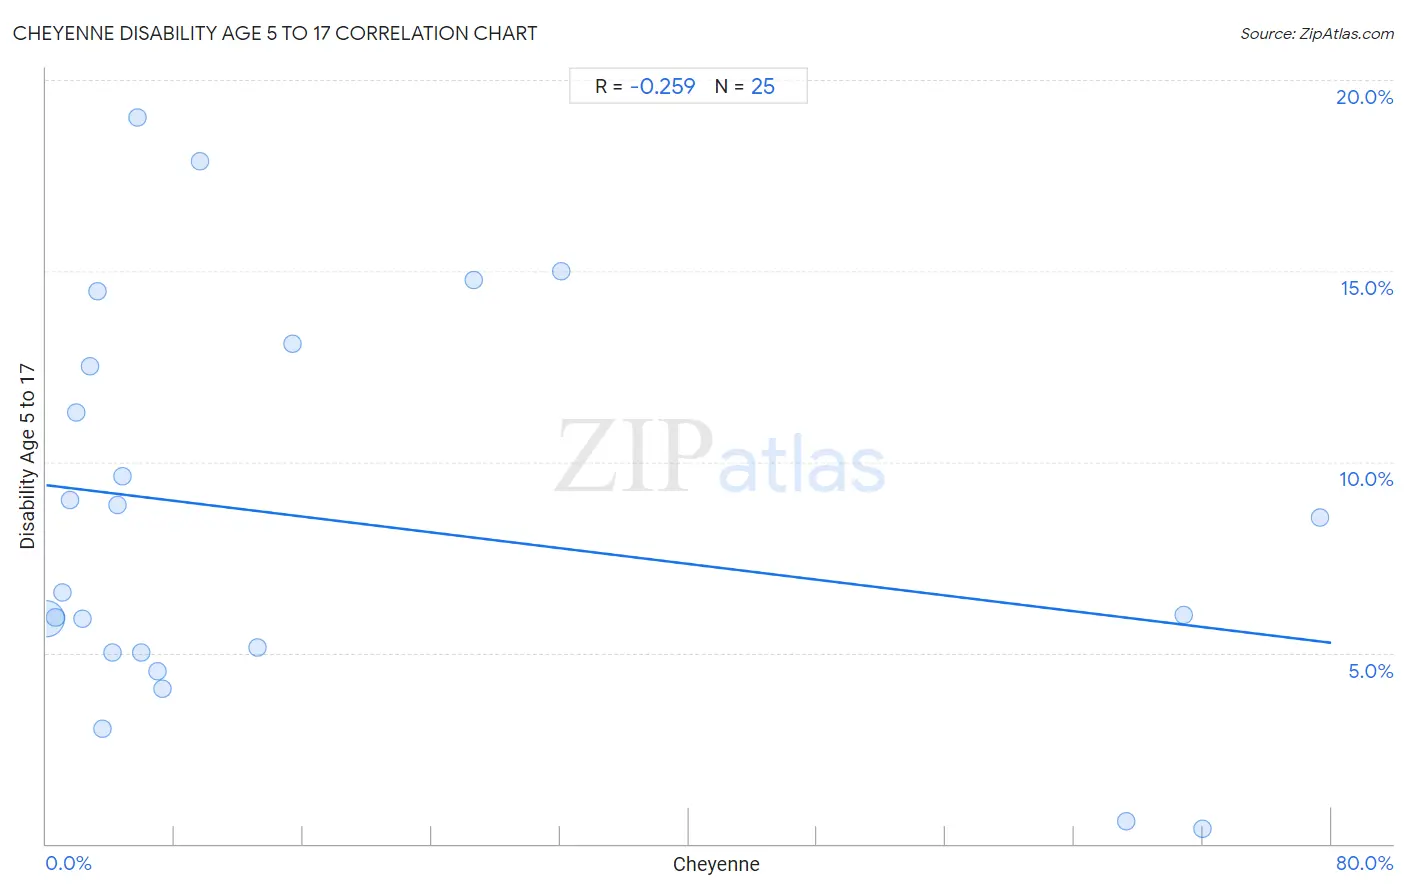
Cheyenne Disability Age 5 to 17 Correlation Chart

The statistical analysis conducted on geographies consisting of 80,502,855 people shows a weak negative correlation between the proportion of Cheyenne and percentage of population with a disability between the ages 5 and 17 in the United States with a correlation coefficient (R) of -0.259 and weighted average of 6.0%. On average, for every 1% (one percent) increase in Cheyenne within a typical geography, there is a decrease of 0.052% in percentage of population with a disability between the ages 5 and 17.
Cheyenne Disability Age 5 to 17
It is essential to understand that the correlation between the percentage of Cheyenne and percentage of population with a disability between the ages 5 and 17 does not imply a direct cause-and-effect relationship. It remains uncertain whether the presence of Cheyenne influences an upward or downward trend in the level of percentage of population with a disability between the ages 5 and 17 within an area, or if Cheyenne simply ended up residing in those areas with higher or lower levels of percentage of population with a disability between the ages 5 and 17 due to other factors.

Demographics Similar to Cheyenne by Disability Age 5 to 17

In terms of disability age 5 to 17, the demographic groups most similar to Cheyenne are Alaska Native (6.0%, a difference of 0.11%), Dutch (6.0%, a difference of 0.11%), Finnish (6.0%, a difference of 0.16%), Immigrants from Zaire (6.0%, a difference of 0.19%), and Japanese (6.1%, a difference of 0.21%).
DemographicsRating | RankDisability Age 5 to 17
Spanish
0.5
/100
|
#267
Tragic
6.0%
Sioux
0.4
/100
|
#268
Tragic
6.0%
Liberians
0.4
/100
|
#269
Tragic
6.0%
Immigrants from Somalia
0.4
/100
|
#270
Tragic
6.0%
Immigrants from Zaire
0.2
/100
|
#271
Tragic
6.0%
Finns
0.2
/100
|
#272
Tragic
6.0%
Alaska Natives
0.2
/100
|
#273
Tragic
6.0%
Cheyenne
0.2
/100
|
#274
Tragic
6.0%
Dutch
0.2
/100
|
#275
Tragic
6.0%
Japanese
0.1
/100
|
#276
Tragic
6.1%
Puget Sound Salish
0.1
/100
|
#277
Tragic
6.1%
Immigrants from Liberia
0.1
/100
|
#278
Tragic
6.1%
Immigrants from Jamaica
0.1
/100
|
#279
Tragic
6.1%
Portuguese
0.1
/100
|
#280
Tragic
6.1%
Scottish
0.0
/100
|
#281
Tragic
6.1%

Cheyenne Disability Age 5 to 17 Correlation Summary

MeasurementCheyenne DataDisability Age 5 to 17 Data
Minimum0.026%0.39%
Maximum79.3%19.0%
Range79.3%18.6%
Mean17.7%8.5%
Median5.7%6.6%
Interquartile 25% (IQ1)2.5%5.0%
Interquartile 75% (IQ3)21.0%12.8%
Interquartile Range (IQR)18.5%7.8%
Standard Deviation (Sample)25.6%5.1%
Standard Deviation (Population)25.1%5.0%

Correlation Details

Cheyenne PercentileSample SizeDisability Age 5 to 17
[
0.0%
-
0.5%
]
0.026%
79,532,9805.9%
[
0.5%
-
1.0%
]
0.58%
489,7505.9%
[
0.5%
-
1.0%
]
1.00%
337,0656.6%
[
1.0%
-
1.5%
]
1.45%
39,9159.0%
[
1.5%
-
2.0%
]
1.87%
41,43011.3%
[
2.0%
-
2.5%
]
2.25%
11,0905.9%
[
2.5%
-
3.0%
]
2.69%
1,44812.5%
[
3.0%
-
3.5%
]
3.18%
9,99214.5%
[
3.0%
-
3.5%
]
3.47%
4,9853.0%
[
4.0%
-
4.5%
]
4.09%
8,7025.0%
[
4.0%
-
4.5%
]
4.47%
2,1278.9%
[
4.5%
-
5.0%
]
4.73%
3,5939.6%
[
5.5%
-
6.0%
]
5.70%
2,65119.0%
[
5.5%
-
6.0%
]
5.88%
855.0%
[
6.5%
-
7.0%
]
6.92%
1,6034.5%
[
7.0%
-
7.5%
]
7.26%
1,5574.1%
[
9.5%
-
10.0%
]
9.58%
4,65417.9%
[
13.0%
-
13.5%
]
13.18%
3875.1%
[
15.0%
-
15.5%
]
15.35%
39113.1%
[
26.5%
-
27.0%
]
26.58%
1,12514.8%
[
32.0%
-
32.5%
]
32.06%
78315.0%
[
67.0%
-
67.5%
]
67.20%
2,0640.60%
[
70.5%
-
71.0%
]
70.81%
9666.0%
[
71.5%
-
72.0%
]
71.99%
3,0380.39%
[
79.0%
-
79.5%
]
79.32%
4748.5%