Spanish Disability Age 5 to 17
COMPARE
Spanish
Select to Compare
Disability Age 5 to 17
Spanish Disability Age 5 to 17
6.0%
DISABILITY | AGE 5 TO 17
0.5/ 100
METRIC RATING
267th/ 347
METRIC RANK
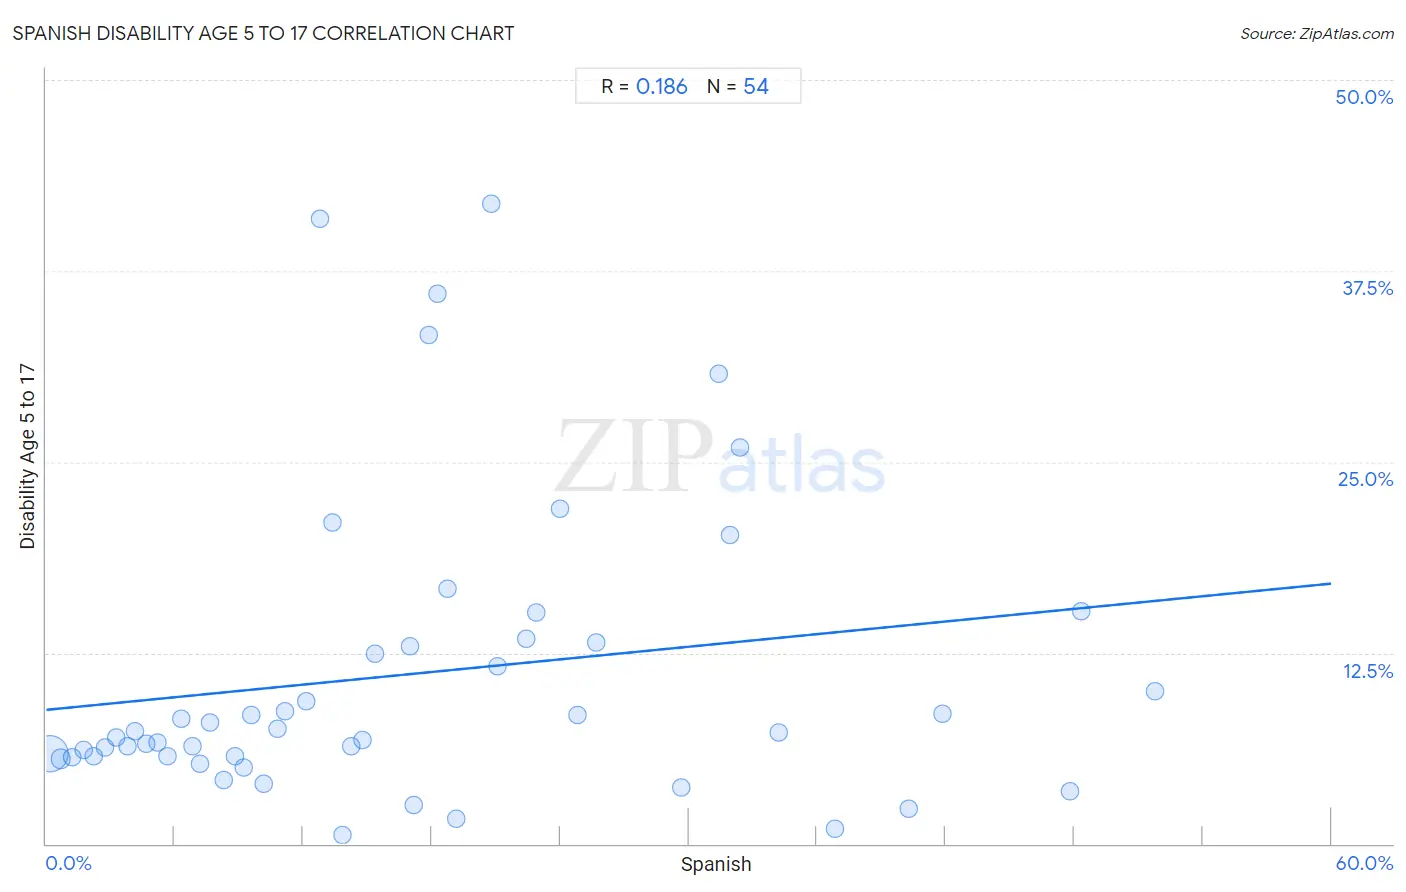
Spanish Disability Age 5 to 17 Correlation Chart
The statistical analysis conducted on geographies consisting of 418,244,761 people shows a poor positive correlation between the proportion of Spanish and percentage of population with a disability between the ages 5 and 17 in the United States with a correlation coefficient (R) of 0.186 and weighted average of 6.0%. On average, for every 1% (one percent) increase in Spanish within a typical geography, there is an increase of 0.14% in percentage of population with a disability between the ages 5 and 17.
It is essential to understand that the correlation between the percentage of Spanish and percentage of population with a disability between the ages 5 and 17 does not imply a direct cause-and-effect relationship. It remains uncertain whether the presence of Spanish influences an upward or downward trend in the level of percentage of population with a disability between the ages 5 and 17 within an area, or if Spanish simply ended up residing in those areas with higher or lower levels of percentage of population with a disability between the ages 5 and 17 due to other factors.
Demographics Similar to Spanish by Disability Age 5 to 17
In terms of disability age 5 to 17, the demographic groups most similar to Spanish are Slovene (6.0%, a difference of 0.11%), Panamanian (6.0%, a difference of 0.13%), Sioux (6.0%, a difference of 0.19%), Canadian (6.0%, a difference of 0.21%), and Liberian (6.0%, a difference of 0.22%).
| Demographics | Rating | Rank | Disability Age 5 to 17 |
| Somalis | 0.8 /100 | #260 | Tragic 5.9% |
| Immigrants from Middle Africa | 0.7 /100 | #261 | Tragic 5.9% |
| Immigrants from Western Africa | 0.7 /100 | #262 | Tragic 5.9% |
| Czechoslovakians | 0.7 /100 | #263 | Tragic 5.9% |
| Canadians | 0.6 /100 | #264 | Tragic 6.0% |
| Panamanians | 0.6 /100 | #265 | Tragic 6.0% |
| Slovenes | 0.6 /100 | #266 | Tragic 6.0% |
| Spanish | 0.5 /100 | #267 | Tragic 6.0% |
| Sioux | 0.4 /100 | #268 | Tragic 6.0% |
| Liberians | 0.4 /100 | #269 | Tragic 6.0% |
| Immigrants from Somalia | 0.4 /100 | #270 | Tragic 6.0% |
| Immigrants from Zaire | 0.2 /100 | #271 | Tragic 6.0% |
| Finns | 0.2 /100 | #272 | Tragic 6.0% |
| Alaska Natives | 0.2 /100 | #273 | Tragic 6.0% |
| Cheyenne | 0.2 /100 | #274 | Tragic 6.0% |
Spanish Disability Age 5 to 17 Correlation Summary
| Measurement | Spanish Data | Disability Age 5 to 17 Data |
| Minimum | 0.18% | 0.61% |
| Maximum | 51.7% | 41.9% |
| Range | 51.6% | 41.3% |
| Mean | 17.1% | 11.1% |
| Median | 14.0% | 7.3% |
| Interquartile 25% (IQ1) | 6.8% | 5.7% |
| Interquartile 75% (IQ3) | 24.0% | 13.2% |
| Interquartile Range (IQR) | 17.2% | 7.5% |
| Standard Deviation (Sample) | 13.3% | 9.8% |
| Standard Deviation (Population) | 13.2% | 9.8% |
Correlation Details
| Spanish Percentile | Sample Size | Disability Age 5 to 17 |
[ 0.0% - 0.5% ] 0.18% | 354,637,980 | 5.9% |
[ 0.5% - 1.0% ] 0.68% | 43,165,040 | 5.5% |
[ 1.0% - 1.5% ] 1.21% | 11,673,357 | 5.7% |
[ 1.5% - 2.0% ] 1.72% | 3,190,417 | 6.1% |
[ 2.0% - 2.5% ] 2.22% | 1,369,093 | 5.7% |
[ 2.5% - 3.0% ] 2.74% | 918,950 | 6.3% |
[ 3.0% - 3.5% ] 3.27% | 353,334 | 7.0% |
[ 3.5% - 4.0% ] 3.77% | 307,348 | 6.4% |
[ 4.0% - 4.5% ] 4.17% | 517,872 | 7.4% |
[ 4.5% - 5.0% ] 4.65% | 890,809 | 6.5% |
[ 5.0% - 5.5% ] 5.18% | 369,881 | 6.7% |
[ 5.5% - 6.0% ] 5.68% | 127,310 | 5.7% |
[ 6.0% - 6.5% ] 6.32% | 106,482 | 8.2% |
[ 6.5% - 7.0% ] 6.80% | 133,656 | 6.3% |
[ 7.0% - 7.5% ] 7.19% | 50,104 | 5.2% |
[ 7.5% - 8.0% ] 7.63% | 125,605 | 7.9% |
[ 8.0% - 8.5% ] 8.27% | 44,461 | 4.2% |
[ 8.5% - 9.0% ] 8.80% | 66,172 | 5.7% |
[ 9.0% - 9.5% ] 9.19% | 25,302 | 5.0% |
[ 9.5% - 10.0% ] 9.58% | 12,016 | 8.4% |
[ 10.0% - 10.5% ] 10.13% | 13,158 | 3.9% |
[ 10.5% - 11.0% ] 10.82% | 13,842 | 7.6% |
[ 11.0% - 11.5% ] 11.13% | 55,199 | 8.7% |
[ 12.0% - 12.5% ] 12.11% | 4,317 | 9.3% |
[ 12.5% - 13.0% ] 12.79% | 5,107 | 40.9% |
[ 13.0% - 13.5% ] 13.36% | 4,931 | 21.0% |
[ 13.5% - 14.0% ] 13.84% | 2,132 | 0.61% |
[ 14.0% - 14.5% ] 14.25% | 5,444 | 6.4% |
[ 14.5% - 15.0% ] 14.76% | 1,423 | 6.8% |
[ 15.0% - 15.5% ] 15.35% | 13,470 | 12.4% |
[ 16.5% - 17.0% ] 16.99% | 618 | 12.9% |
[ 17.0% - 17.5% ] 17.13% | 2,825 | 2.5% |
[ 17.5% - 18.0% ] 17.83% | 886 | 33.3% |
[ 18.0% - 18.5% ] 18.26% | 241 | 36.0% |
[ 18.5% - 19.0% ] 18.76% | 2,783 | 16.7% |
[ 19.0% - 19.5% ] 19.12% | 1,527 | 1.6% |
[ 20.5% - 21.0% ] 20.77% | 1,271 | 41.9% |
[ 21.0% - 21.5% ] 21.06% | 4,369 | 11.6% |
[ 22.0% - 22.5% ] 22.40% | 4,772 | 13.4% |
[ 22.5% - 23.0% ] 22.88% | 4,078 | 15.2% |
[ 23.5% - 24.0% ] 23.99% | 746 | 21.9% |
[ 24.5% - 25.0% ] 24.80% | 512 | 8.4% |
[ 25.5% - 26.0% ] 25.71% | 634 | 13.2% |
[ 29.5% - 30.0% ] 29.63% | 5,367 | 3.7% |
[ 31.0% - 31.5% ] 31.38% | 325 | 30.8% |
[ 31.5% - 32.0% ] 31.93% | 880 | 20.2% |
[ 32.0% - 32.5% ] 32.38% | 667 | 25.9% |
[ 34.0% - 34.5% ] 34.21% | 1,102 | 7.3% |
[ 36.5% - 37.0% ] 36.81% | 1,513 | 0.95% |
[ 40.0% - 40.5% ] 40.26% | 688 | 2.3% |
[ 41.5% - 42.0% ] 41.87% | 1,113 | 8.5% |
[ 47.5% - 48.0% ] 47.82% | 1,583 | 3.5% |
[ 48.0% - 48.5% ] 48.34% | 362 | 15.3% |
[ 51.5% - 52.0% ] 51.75% | 1,687 | 10.0% |