Burmese Disability Age 5 to 17
COMPARE
Burmese
Select to Compare
Disability Age 5 to 17
Burmese Disability Age 5 to 17
4.8%
DISABILITY | AGE 5 TO 17
100.0/ 100
METRIC RATING
20th/ 347
METRIC RANK
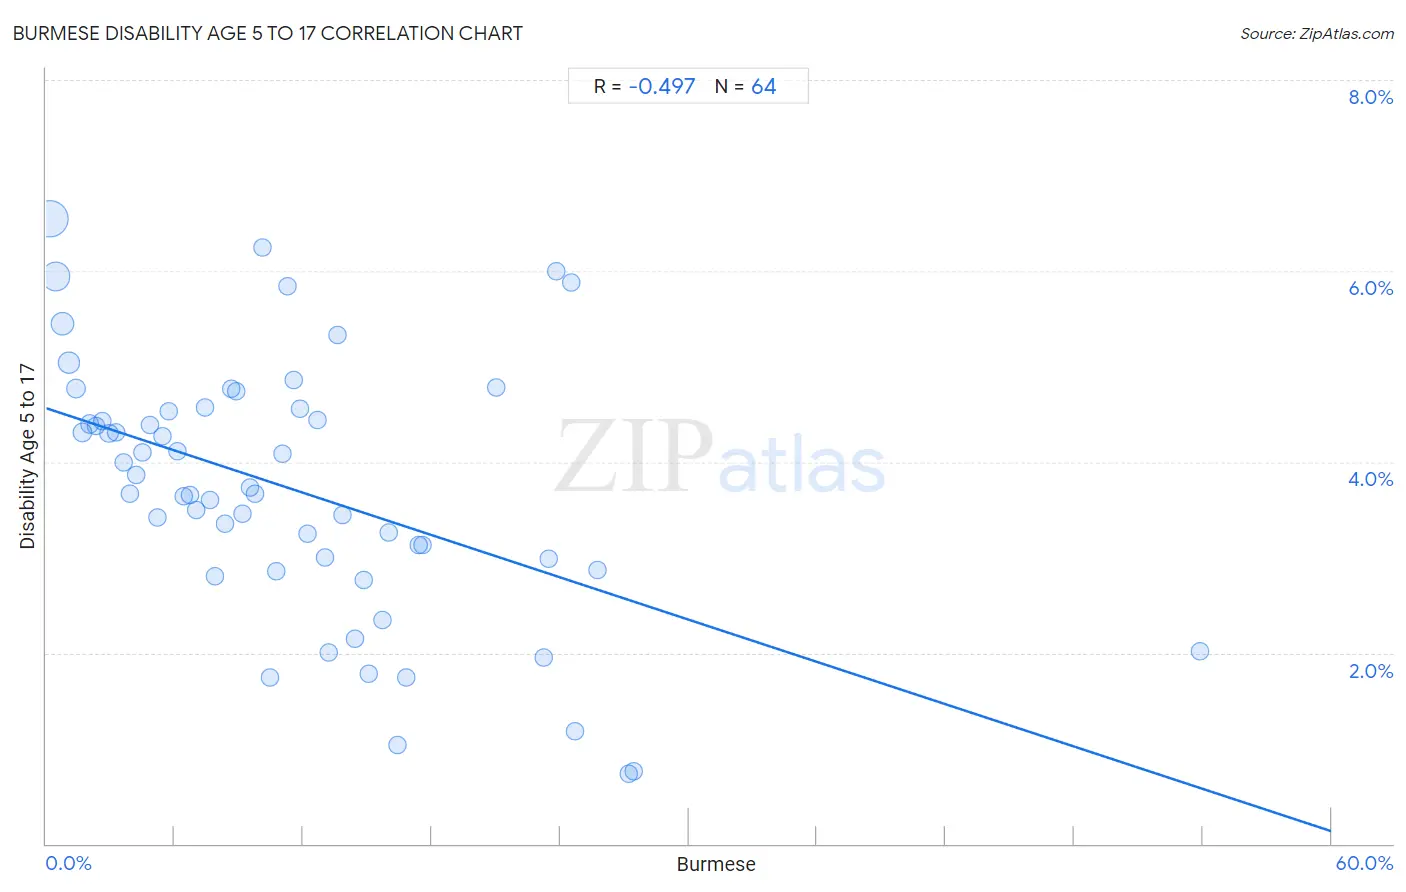
Burmese Disability Age 5 to 17 Correlation Chart
The statistical analysis conducted on geographies consisting of 460,493,605 people shows a moderate negative correlation between the proportion of Burmese and percentage of population with a disability between the ages 5 and 17 in the United States with a correlation coefficient (R) of -0.497 and weighted average of 4.8%. On average, for every 1% (one percent) increase in Burmese within a typical geography, there is a decrease of 0.074% in percentage of population with a disability between the ages 5 and 17.
It is essential to understand that the correlation between the percentage of Burmese and percentage of population with a disability between the ages 5 and 17 does not imply a direct cause-and-effect relationship. It remains uncertain whether the presence of Burmese influences an upward or downward trend in the level of percentage of population with a disability between the ages 5 and 17 within an area, or if Burmese simply ended up residing in those areas with higher or lower levels of percentage of population with a disability between the ages 5 and 17 due to other factors.
Demographics Similar to Burmese by Disability Age 5 to 17
In terms of disability age 5 to 17, the demographic groups most similar to Burmese are Yup'ik (4.8%, a difference of 0.22%), Immigrants from Uzbekistan (4.8%, a difference of 0.38%), Asian (4.8%, a difference of 0.56%), Immigrants from South Central Asia (4.7%, a difference of 0.87%), and Arapaho (4.7%, a difference of 0.89%).
| Demographics | Rating | Rank | Disability Age 5 to 17 |
| Thais | 100.0 /100 | #13 | Exceptional 4.7% |
| Immigrants from Korea | 100.0 /100 | #14 | Exceptional 4.7% |
| Chinese | 100.0 /100 | #15 | Exceptional 4.7% |
| Immigrants from Singapore | 100.0 /100 | #16 | Exceptional 4.7% |
| Arapaho | 100.0 /100 | #17 | Exceptional 4.7% |
| Immigrants from South Central Asia | 100.0 /100 | #18 | Exceptional 4.7% |
| Immigrants from Uzbekistan | 100.0 /100 | #19 | Exceptional 4.8% |
| Burmese | 100.0 /100 | #20 | Exceptional 4.8% |
| Yup'ik | 100.0 /100 | #21 | Exceptional 4.8% |
| Asians | 100.0 /100 | #22 | Exceptional 4.8% |
| Immigrants from Bolivia | 100.0 /100 | #23 | Exceptional 4.8% |
| Immigrants from Lebanon | 100.0 /100 | #24 | Exceptional 4.8% |
| Immigrants from Asia | 100.0 /100 | #25 | Exceptional 4.8% |
| Bhutanese | 100.0 /100 | #26 | Exceptional 4.9% |
| Taiwanese | 100.0 /100 | #27 | Exceptional 4.9% |
Burmese Disability Age 5 to 17 Correlation Summary
| Measurement | Burmese Data | Disability Age 5 to 17 Data |
| Minimum | 0.15% | 0.73% |
| Maximum | 53.9% | 6.5% |
| Range | 53.7% | 5.8% |
| Mean | 11.5% | 3.7% |
| Median | 9.9% | 3.7% |
| Interquartile 25% (IQ1) | 5.0% | 2.9% |
| Interquartile 75% (IQ3) | 15.4% | 4.5% |
| Interquartile Range (IQR) | 10.4% | 1.6% |
| Standard Deviation (Sample) | 9.1% | 1.4% |
| Standard Deviation (Population) | 9.0% | 1.3% |
Correlation Details
| Burmese Percentile | Sample Size | Disability Age 5 to 17 |
[ 0.0% - 0.5% ] 0.15% | 192,188,030 | 6.5% |
[ 0.0% - 0.5% ] 0.45% | 110,212,066 | 5.9% |
[ 0.5% - 1.0% ] 0.76% | 51,960,781 | 5.4% |
[ 1.0% - 1.5% ] 1.07% | 34,655,006 | 5.0% |
[ 1.0% - 1.5% ] 1.39% | 17,423,500 | 4.8% |
[ 1.5% - 2.0% ] 1.70% | 13,630,090 | 4.3% |
[ 2.0% - 2.5% ] 2.02% | 8,348,215 | 4.4% |
[ 2.0% - 2.5% ] 2.32% | 5,365,349 | 4.4% |
[ 2.5% - 3.0% ] 2.63% | 3,764,260 | 4.4% |
[ 2.5% - 3.0% ] 2.94% | 7,128,660 | 4.3% |
[ 3.0% - 3.5% ] 3.28% | 2,293,767 | 4.3% |
[ 3.5% - 4.0% ] 3.60% | 1,720,326 | 4.0% |
[ 3.5% - 4.0% ] 3.89% | 1,492,133 | 3.7% |
[ 4.0% - 4.5% ] 4.20% | 1,180,433 | 3.9% |
[ 4.0% - 4.5% ] 4.50% | 993,747 | 4.1% |
[ 4.5% - 5.0% ] 4.83% | 633,923 | 4.4% |
[ 5.0% - 5.5% ] 5.17% | 975,761 | 3.4% |
[ 5.0% - 5.5% ] 5.43% | 757,165 | 4.3% |
[ 5.5% - 6.0% ] 5.73% | 296,925 | 4.5% |
[ 6.0% - 6.5% ] 6.11% | 783,323 | 4.1% |
[ 6.0% - 6.5% ] 6.39% | 285,167 | 3.6% |
[ 6.5% - 7.0% ] 6.73% | 225,597 | 3.6% |
[ 6.5% - 7.0% ] 6.99% | 238,506 | 3.5% |
[ 7.0% - 7.5% ] 7.38% | 246,933 | 4.6% |
[ 7.5% - 8.0% ] 7.67% | 117,286 | 3.6% |
[ 7.5% - 8.0% ] 7.86% | 470,149 | 2.8% |
[ 8.0% - 8.5% ] 8.35% | 87,377 | 3.4% |
[ 8.5% - 9.0% ] 8.61% | 134,653 | 4.8% |
[ 8.5% - 9.0% ] 8.87% | 262,866 | 4.7% |
[ 9.0% - 9.5% ] 9.19% | 98,026 | 3.5% |
[ 9.5% - 10.0% ] 9.52% | 142,320 | 3.7% |
[ 9.5% - 10.0% ] 9.75% | 125,919 | 3.7% |
[ 10.0% - 10.5% ] 10.12% | 115,479 | 6.2% |
[ 10.0% - 10.5% ] 10.47% | 35,220 | 1.7% |
[ 10.5% - 11.0% ] 10.76% | 199,829 | 2.9% |
[ 11.0% - 11.5% ] 11.03% | 282,578 | 4.1% |
[ 11.0% - 11.5% ] 11.27% | 40,914 | 5.8% |
[ 11.5% - 12.0% ] 11.58% | 59,410 | 4.9% |
[ 11.5% - 12.0% ] 11.85% | 51,367 | 4.6% |
[ 12.0% - 12.5% ] 12.22% | 27,774 | 3.2% |
[ 12.5% - 13.0% ] 12.68% | 253,938 | 4.4% |
[ 13.0% - 13.5% ] 13.04% | 49,955 | 3.0% |
[ 13.0% - 13.5% ] 13.19% | 233,250 | 2.0% |
[ 13.5% - 14.0% ] 13.57% | 72,859 | 5.3% |
[ 13.5% - 14.0% ] 13.81% | 93,823 | 3.4% |
[ 14.0% - 14.5% ] 14.44% | 22,723 | 2.1% |
[ 14.5% - 15.0% ] 14.80% | 151,681 | 2.8% |
[ 15.0% - 15.5% ] 15.04% | 50,419 | 1.8% |
[ 15.5% - 16.0% ] 15.71% | 25,382 | 2.3% |
[ 16.0% - 16.5% ] 16.02% | 24,044 | 3.3% |
[ 16.0% - 16.5% ] 16.41% | 20,092 | 1.0% |
[ 16.5% - 17.0% ] 16.79% | 32,344 | 1.7% |
[ 17.0% - 17.5% ] 17.38% | 30,598 | 3.1% |
[ 17.5% - 18.0% ] 17.58% | 5,495 | 3.1% |
[ 21.0% - 21.5% ] 21.01% | 39,049 | 4.8% |
[ 23.0% - 23.5% ] 23.21% | 18,210 | 2.0% |
[ 23.0% - 23.5% ] 23.48% | 132,379 | 3.0% |
[ 23.5% - 24.0% ] 23.80% | 22,930 | 6.0% |
[ 24.5% - 25.0% ] 24.51% | 17,110 | 5.9% |
[ 24.5% - 25.0% ] 24.71% | 37,754 | 1.2% |
[ 25.5% - 26.0% ] 25.74% | 38,400 | 2.9% |
[ 27.0% - 27.5% ] 27.19% | 18,564 | 0.73% |
[ 27.0% - 27.5% ] 27.45% | 11,314 | 0.76% |
[ 53.5% - 54.0% ] 53.89% | 40,462 | 2.0% |