Immigrants from Zimbabwe Disability Age 5 to 17

COMPARE

Immigrants from Zimbabwe
Race
Ancestry
AfghanAfricanAlaska NativeAlaskan AthabascanAlbanianAleutAlsatianAmericanApacheArabArapahoArgentineanArmenianAssyrian/Chaldean/SyriacAustralianAustrianBahamianBangladeshiBarbadianBasqueBelgianBelizeanBermudanBhutaneseBlackfeetBolivianBrazilianBritishBritish West IndianBulgarianBurmeseCajunCambodianCanadianCape VerdeanCarpatho RusynCelticCentral AmericanCentral American IndianCherokeeCheyenneChickasawChileanChineseChippewaChoctawColombianColvilleComancheCosta RicanCreeCreekCroatianCrowCubanCypriotCzechCzechoslovakianDanishDelawareDominicanDutchDutch West IndianEastern EuropeanEcuadorianEgyptianEnglishEstonianEthiopianEuropeanFijianFilipinoFinnishFrenchFrench American IndianFrench CanadianGermanGerman RussianGhanaianGreekGuamanian/ChamorroGuatemalanGuyaneseHaitianHmongHonduranHopiHoumaHungarianIcelanderIndian (Asian)IndonesianInupiatIranianIraqiIrishIroquoisIsraeliItalianJamaicanJapaneseJordanianKenyanKiowaKoreanLaotianLatvianLebaneseLiberianLithuanianLumbeeLuxembourgerMacedonianMalaysianMalteseMarshalleseMenomineeMexicanMexican American IndianMongolianMoroccanNative HawaiianNavajoNepaleseNew ZealanderNicaraguanNigerianNorthern EuropeanNorwegianOkinawanOsageOttawaPaiutePakistaniPalestinianPanamanianParaguayanPennsylvania GermanPeruvianPimaPolishPortuguesePotawatomiPuebloPuerto RicanPuget Sound SalishRomanianRussianSalvadoranSamoanScandinavianScotch-IrishScottishSeminoleSenegaleseSerbianShoshoneSierra LeoneanSiouxSlavicSlovakSloveneSomaliSouth AfricanSouth AmericanSouth American IndianSoviet UnionSpaniardSpanishSpanish AmericanSpanish American IndianSri LankanSubsaharan AfricanSudaneseSwedishSwissSyrianTaiwaneseThaiTlingit-HaidaTohono O'OdhamTonganTrinidadian and TobagonianTsimshianTurkishU.S. Virgin IslanderUgandanUkrainianUruguayanUteVenezuelanVietnameseWelshWest IndianYakamaYaquiYugoslavianYumanYup'ikZimbabwean
Immigration
NonimmigrantsImmigrantsAfghanistanAfricaAlbaniaArgentinaArmeniaAsiaAustraliaAustriaBahamasBangladeshBarbadosBelarusBelgiumBelizeBoliviaBosnia and HerzegovinaBrazilBulgariaBurma/MyanmarCabo VerdeCambodiaCameroonCanadaCaribbeanCentral AmericaChileChinaColombiaCongoCosta RicaCroatiaCubaCzechoslovakiaDenmarkDominicaDominican RepublicEastern AfricaEastern AsiaEastern EuropeEcuadorEgyptEl SalvadorEnglandEritreaEthiopiaEuropeFijiFranceGermanyGhanaGreeceGrenadaGuatemalaGuyanaHaitiHondurasHong KongHungaryIndiaIndonesiaIranIraqIrelandIsraelItalyJamaicaJapanJordanKazakhstanKenyaKoreaKuwaitLaosLatin AmericaLatviaLebanonLiberiaLithuaniaMalaysiaMexicoMicronesiaMiddle AfricaMoldovaMoroccoNepalNetherlandsNicaraguaNigeriaNorth AmericaNorth MacedoniaNorthern AfricaNorthern EuropeNorwayOceaniaPakistanPanamaPeruPhilippinesPolandPortugalRomaniaRussiaSaudi ArabiaScotlandSenegalSerbiaSierra LeoneSingaporeSomaliaSouth AfricaSouth AmericaSouth Central AsiaSouth Eastern AsiaSouthern EuropeSpainSri LankaSt. Vincent and the GrenadinesSudanSwedenSwitzerlandSyriaTaiwanThailandTrinidad and TobagoTurkeyUgandaUkraineUruguayUzbekistanVenezuelaVietnamWest IndiesWestern AfricaWestern AsiaWestern EuropeYemenZaireZimbabweAzores
Select to Compare
Race
Ancestry
AfghanAfricanAlaska NativeAlaskan AthabascanAlbanianAleutAlsatianAmericanApacheArabArapahoArgentineanArmenianAssyrian/Chaldean/SyriacAustralianAustrianBahamianBangladeshiBarbadianBasqueBelgianBelizeanBermudanBhutaneseBlackfeetBolivianBrazilianBritishBritish West IndianBulgarianBurmeseCajunCambodianCanadianCape VerdeanCarpatho RusynCelticCentral AmericanCentral American IndianCherokeeCheyenneChickasawChileanChineseChippewaChoctawColombianColvilleComancheCosta RicanCreeCreekCroatianCrowCubanCypriotCzechCzechoslovakianDanishDelawareDominicanDutchDutch West IndianEastern EuropeanEcuadorianEgyptianEnglishEstonianEthiopianEuropeanFijianFilipinoFinnishFrenchFrench American IndianFrench CanadianGermanGerman RussianGhanaianGreekGuamanian/ChamorroGuatemalanGuyaneseHaitianHmongHonduranHopiHoumaHungarianIcelanderIndian (Asian)IndonesianInupiatIranianIraqiIrishIroquoisIsraeliItalianJamaicanJapaneseJordanianKenyanKiowaKoreanLaotianLatvianLebaneseLiberianLithuanianLumbeeLuxembourgerMacedonianMalaysianMalteseMarshalleseMenomineeMexicanMexican American IndianMongolianMoroccanNative HawaiianNavajoNepaleseNew ZealanderNicaraguanNigerianNorthern EuropeanNorwegianOkinawanOsageOttawaPaiutePakistaniPalestinianPanamanianParaguayanPennsylvania GermanPeruvianPimaPolishPortuguesePotawatomiPuebloPuerto RicanPuget Sound SalishRomanianRussianSalvadoranSamoanScandinavianScotch-IrishScottishSeminoleSenegaleseSerbianShoshoneSierra LeoneanSiouxSlavicSlovakSloveneSomaliSouth AfricanSouth AmericanSouth American IndianSoviet UnionSpaniardSpanishSpanish AmericanSpanish American IndianSri LankanSubsaharan AfricanSudaneseSwedishSwissSyrianTaiwaneseThaiTlingit-HaidaTohono O'OdhamTonganTrinidadian and TobagonianTsimshianTurkishU.S. Virgin IslanderUgandanUkrainianUruguayanUteVenezuelanVietnameseWelshWest IndianYakamaYaquiYugoslavianYumanYup'ikZimbabwean
Immigration
NonimmigrantsImmigrantsAfghanistanAfricaAlbaniaArgentinaArmeniaAsiaAustraliaAustriaBahamasBangladeshBarbadosBelarusBelgiumBelizeBoliviaBosnia and HerzegovinaBrazilBulgariaBurma/MyanmarCabo VerdeCambodiaCameroonCanadaCaribbeanCentral AmericaChileChinaColombiaCongoCosta RicaCroatiaCubaCzechoslovakiaDenmarkDominicaDominican RepublicEastern AfricaEastern AsiaEastern EuropeEcuadorEgyptEl SalvadorEnglandEritreaEthiopiaEuropeFijiFranceGermanyGhanaGreeceGrenadaGuatemalaGuyanaHaitiHondurasHong KongHungaryIndiaIndonesiaIranIraqIrelandIsraelItalyJamaicaJapanJordanKazakhstanKenyaKoreaKuwaitLaosLatin AmericaLatviaLebanonLiberiaLithuaniaMalaysiaMexicoMicronesiaMiddle AfricaMoldovaMoroccoNepalNetherlandsNicaraguaNigeriaNorth AmericaNorth MacedoniaNorthern AfricaNorthern EuropeNorwayOceaniaPakistanPanamaPeruPhilippinesPolandPortugalRomaniaRussiaSaudi ArabiaScotlandSenegalSerbiaSierra LeoneSingaporeSomaliaSouth AfricaSouth AmericaSouth Central AsiaSouth Eastern AsiaSouthern EuropeSpainSri LankaSt. Vincent and the GrenadinesSudanSwedenSwitzerlandSyriaTaiwanThailandTrinidad and TobagoTurkeyUgandaUkraineUruguayUzbekistanVenezuelaVietnamWest IndiesWestern AfricaWestern AsiaWestern EuropeYemenZaireAzores
Disability Age 5 to 17
Income
Poverty
Unemployment
Labor Participation
Family Structure
Vehicle Availability
Education Level
Disability

Immigrants from Zimbabwe Disability Age 5 to 17
Good

5.5%
DISABILITY | AGE 5 TO 17
75.3/ 100
METRIC RATING
159th/ 347
METRIC RANK

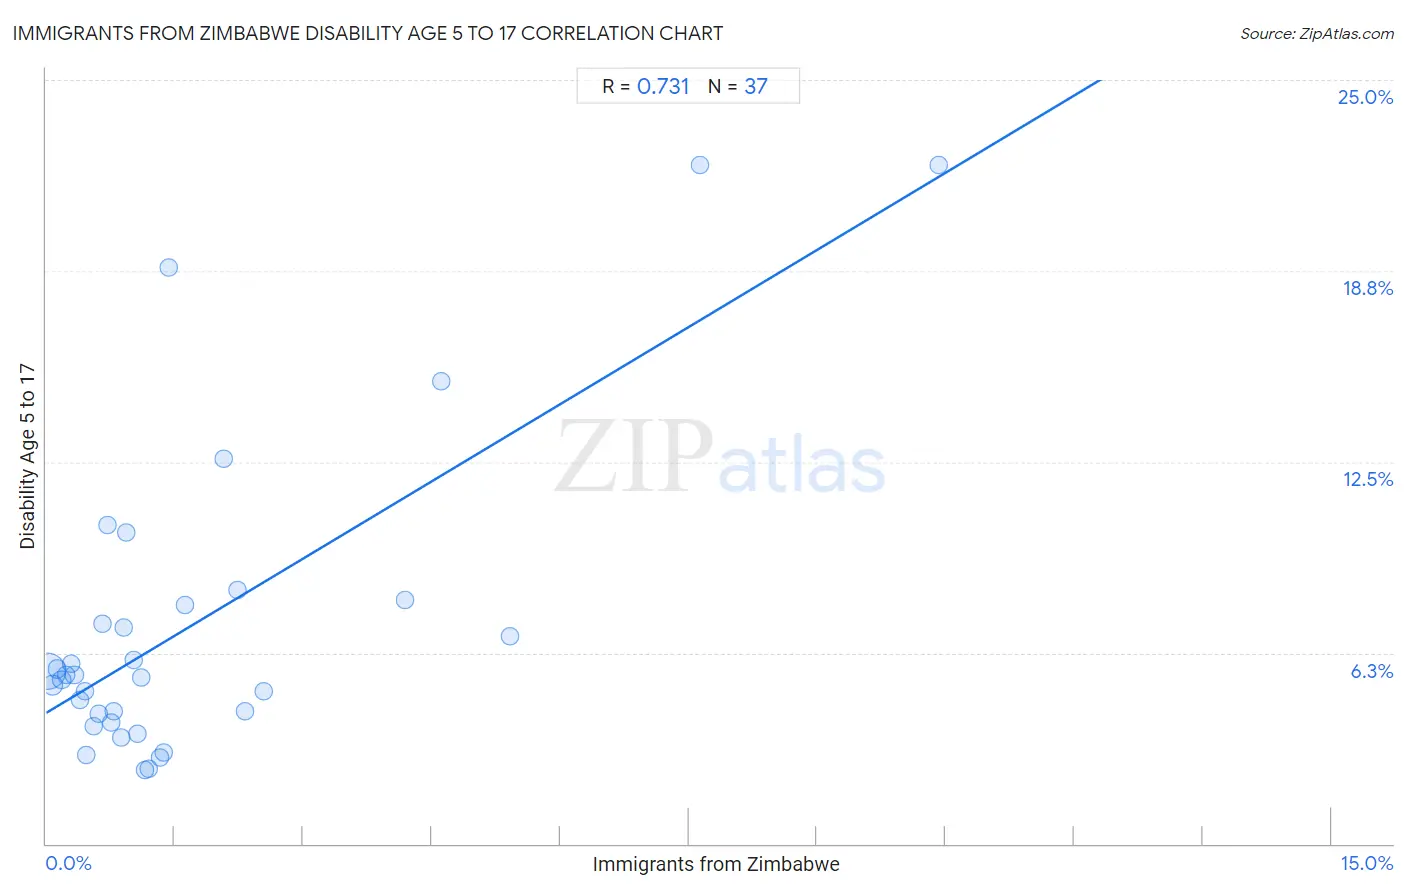
Immigrants from Zimbabwe Disability Age 5 to 17 Correlation Chart

The statistical analysis conducted on geographies consisting of 117,554,818 people shows a strong positive correlation between the proportion of Immigrants from Zimbabwe and percentage of population with a disability between the ages 5 and 17 in the United States with a correlation coefficient (R) of 0.731 and weighted average of 5.5%. On average, for every 1% (one percent) increase in Immigrants from Zimbabwe within a typical geography, there is an increase of 1.7% in percentage of population with a disability between the ages 5 and 17.
Immigrants from Zimbabwe Disability Age 5 to 17
It is essential to understand that the correlation between the percentage of Immigrants from Zimbabwe and percentage of population with a disability between the ages 5 and 17 does not imply a direct cause-and-effect relationship. It remains uncertain whether the presence of Immigrants from Zimbabwe influences an upward or downward trend in the level of percentage of population with a disability between the ages 5 and 17 within an area, or if Immigrants from Zimbabwe simply ended up residing in those areas with higher or lower levels of percentage of population with a disability between the ages 5 and 17 due to other factors.

Demographics Similar to Immigrants from Zimbabwe by Disability Age 5 to 17

In terms of disability age 5 to 17, the demographic groups most similar to Immigrants from Zimbabwe are Immigrants from Nepal (5.5%, a difference of 0.13%), South African (5.5%, a difference of 0.13%), Immigrants from Costa Rica (5.5%, a difference of 0.18%), Hawaiian (5.5%, a difference of 0.19%), and Immigrants from Ecuador (5.5%, a difference of 0.21%).
DemographicsRating | RankDisability Age 5 to 17
Ute
80.6
/100
|
#152
Excellent
5.5%
Ecuadorians
79.7
/100
|
#153
Good
5.5%
Australians
78.8
/100
|
#154
Good
5.5%
Immigrants from Ecuador
78.3
/100
|
#155
Good
5.5%
Hawaiians
78.0
/100
|
#156
Good
5.5%
Immigrants from Costa Rica
77.9
/100
|
#157
Good
5.5%
Immigrants from Nepal
77.1
/100
|
#158
Good
5.5%
Immigrants from Zimbabwe
75.3
/100
|
#159
Good
5.5%
South Africans
73.3
/100
|
#160
Good
5.5%
Immigrants from Saudi Arabia
69.1
/100
|
#161
Good
5.5%
Zimbabweans
67.2
/100
|
#162
Good
5.5%
Immigrants from Southern Europe
64.0
/100
|
#163
Good
5.6%
Immigrants from Scotland
61.9
/100
|
#164
Good
5.6%
Lebanese
61.4
/100
|
#165
Good
5.6%
Greeks
60.6
/100
|
#166
Good
5.6%

Immigrants from Zimbabwe Disability Age 5 to 17 Correlation Summary

MeasurementImmigrants from Zimbabwe DataDisability Age 5 to 17 Data
Minimum0.017%2.4%
Maximum10.4%22.2%
Range10.4%19.8%
Mean1.7%7.1%
Median0.94%5.5%
Interquartile 25% (IQ1)0.46%4.1%
Interquartile 75% (IQ3)1.8%7.9%
Interquartile Range (IQR)1.4%3.8%
Standard Deviation (Sample)2.2%5.0%
Standard Deviation (Population)2.2%5.0%

Correlation Details

Immigrants from Zimbabwe PercentileSample SizeDisability Age 5 to 17
[
0.0%
-
0.5%
]
0.017%
96,515,1735.7%
[
0.0%
-
0.5%
]
0.074%
11,510,7405.2%
[
0.0%
-
0.5%
]
0.13%
3,954,9775.7%
[
0.0%
-
0.5%
]
0.18%
2,073,3205.4%
[
0.0%
-
0.5%
]
0.23%
876,5985.5%
[
0.0%
-
0.5%
]
0.29%
660,2025.9%
[
0.0%
-
0.5%
]
0.33%
469,2165.5%
[
0.0%
-
0.5%
]
0.39%
327,1404.7%
[
0.0%
-
0.5%
]
0.45%
346,0165.0%
[
0.0%
-
0.5%
]
0.47%
90,1632.9%
[
0.5%
-
1.0%
]
0.55%
233,0293.8%
[
0.5%
-
1.0%
]
0.61%
83,8054.3%
[
0.5%
-
1.0%
]
0.65%
16,6577.2%
[
0.5%
-
1.0%
]
0.71%
39,52310.4%
[
0.5%
-
1.0%
]
0.77%
74,7064.0%
[
0.5%
-
1.0%
]
0.79%
45,8024.3%
[
0.5%
-
1.0%
]
0.88%
9,7643.5%
[
0.5%
-
1.0%
]
0.91%
55,9957.1%
[
0.5%
-
1.0%
]
0.94%
3,93510.2%
[
1.0%
-
1.5%
]
1.02%
32,1146.0%
[
1.0%
-
1.5%
]
1.06%
4,7903.6%
[
1.0%
-
1.5%
]
1.11%
31,2265.4%
[
1.0%
-
1.5%
]
1.16%
2,5892.4%
[
1.0%
-
1.5%
]
1.20%
9162.5%
[
1.0%
-
1.5%
]
1.33%
15,2842.8%
[
1.0%
-
1.5%
]
1.38%
3,9173.0%
[
1.0%
-
1.5%
]
1.43%
3,57218.9%
[
1.5%
-
2.0%
]
1.62%
26,6077.8%
[
2.0%
-
2.5%
]
2.08%
3,80112.6%
[
2.0%
-
2.5%
]
2.24%
18,4418.3%
[
2.0%
-
2.5%
]
2.32%
18,0774.3%
[
2.5%
-
3.0%
]
2.54%
1975.0%
[
4.0%
-
4.5%
]
4.19%
2,9618.0%
[
4.5%
-
5.0%
]
4.62%
1,47315.2%
[
5.0%
-
5.5%
]
5.42%
1,3666.8%
[
7.5%
-
8.0%
]
7.64%
41922.2%
[
10.0%
-
10.5%
]
10.42%
30722.2%