Immigrants from Peru Disability Age 5 to 17
COMPARE
Immigrants from Peru
Select to Compare
Disability Age 5 to 17
Immigrants from Peru Disability Age 5 to 17
5.3%
DISABILITY | AGE 5 TO 17
99.1/ 100
METRIC RATING
93rd/ 347
METRIC RANK
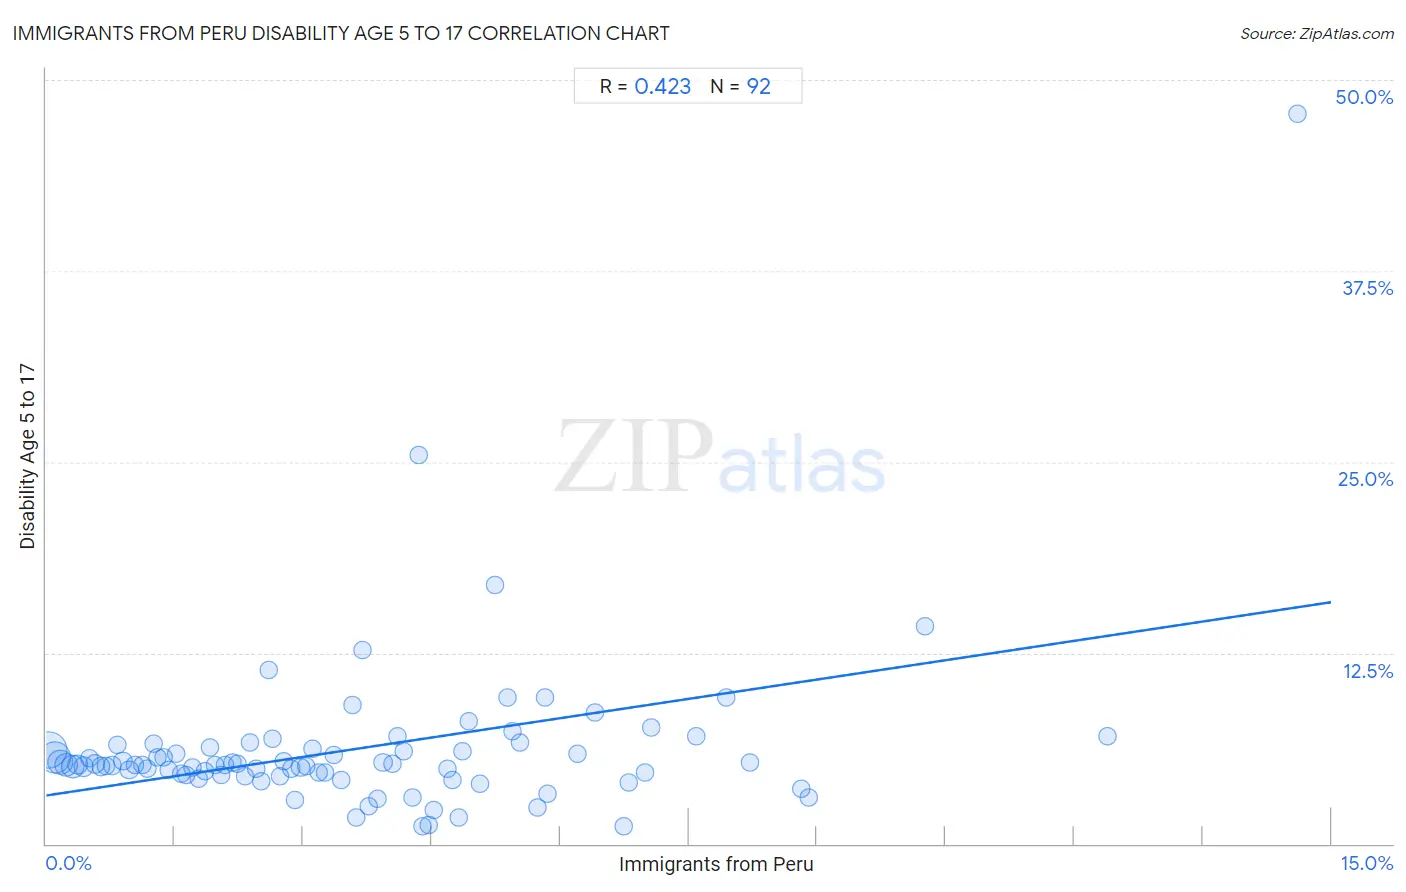
Immigrants from Peru Disability Age 5 to 17 Correlation Chart
The statistical analysis conducted on geographies consisting of 326,866,883 people shows a moderate positive correlation between the proportion of Immigrants from Peru and percentage of population with a disability between the ages 5 and 17 in the United States with a correlation coefficient (R) of 0.423 and weighted average of 5.3%. On average, for every 1% (one percent) increase in Immigrants from Peru within a typical geography, there is an increase of 0.84% in percentage of population with a disability between the ages 5 and 17.
It is essential to understand that the correlation between the percentage of Immigrants from Peru and percentage of population with a disability between the ages 5 and 17 does not imply a direct cause-and-effect relationship. It remains uncertain whether the presence of Immigrants from Peru influences an upward or downward trend in the level of percentage of population with a disability between the ages 5 and 17 within an area, or if Immigrants from Peru simply ended up residing in those areas with higher or lower levels of percentage of population with a disability between the ages 5 and 17 due to other factors.
Demographics Similar to Immigrants from Peru by Disability Age 5 to 17
In terms of disability age 5 to 17, the demographic groups most similar to Immigrants from Peru are Immigrants from Jordan (5.3%, a difference of 0.070%), Luxembourger (5.3%, a difference of 0.080%), Mongolian (5.3%, a difference of 0.090%), Immigrants from Grenada (5.3%, a difference of 0.090%), and Immigrants from El Salvador (5.3%, a difference of 0.25%).
| Demographics | Rating | Rank | Disability Age 5 to 17 |
| Immigrants from St. Vincent and the Grenadines | 99.4 /100 | #86 | Exceptional 5.2% |
| Eastern Europeans | 99.4 /100 | #87 | Exceptional 5.2% |
| Immigrants from Croatia | 99.4 /100 | #88 | Exceptional 5.2% |
| Immigrants from Spain | 99.4 /100 | #89 | Exceptional 5.2% |
| Immigrants from Kuwait | 99.4 /100 | #90 | Exceptional 5.3% |
| Mongolians | 99.2 /100 | #91 | Exceptional 5.3% |
| Luxembourgers | 99.2 /100 | #92 | Exceptional 5.3% |
| Immigrants from Peru | 99.1 /100 | #93 | Exceptional 5.3% |
| Immigrants from Jordan | 99.1 /100 | #94 | Exceptional 5.3% |
| Immigrants from Grenada | 99.1 /100 | #95 | Exceptional 5.3% |
| Immigrants from El Salvador | 99.0 /100 | #96 | Exceptional 5.3% |
| Immigrants from Europe | 99.0 /100 | #97 | Exceptional 5.3% |
| Immigrants from Austria | 98.9 /100 | #98 | Exceptional 5.3% |
| Cambodians | 98.8 /100 | #99 | Exceptional 5.3% |
| Nepalese | 98.7 /100 | #100 | Exceptional 5.3% |
Immigrants from Peru Disability Age 5 to 17 Correlation Summary
| Measurement | Immigrants from Peru Data | Disability Age 5 to 17 Data |
| Minimum | 0.036% | 1.2% |
| Maximum | 14.6% | 47.8% |
| Range | 14.6% | 46.7% |
| Mean | 3.6% | 6.2% |
| Median | 3.1% | 5.1% |
| Interquartile 25% (IQ1) | 1.5% | 4.5% |
| Interquartile 75% (IQ3) | 4.9% | 6.3% |
| Interquartile Range (IQR) | 3.3% | 1.8% |
| Standard Deviation (Sample) | 2.7% | 5.5% |
| Standard Deviation (Population) | 2.7% | 5.4% |
Correlation Details
| Immigrants from Peru Percentile | Sample Size | Disability Age 5 to 17 |
[ 0.0% - 0.5% ] 0.036% | 101,401,485 | 6.2% |
[ 0.0% - 0.5% ] 0.097% | 74,859,703 | 5.6% |
[ 0.0% - 0.5% ] 0.17% | 37,097,724 | 5.3% |
[ 0.0% - 0.5% ] 0.23% | 28,466,197 | 5.2% |
[ 0.0% - 0.5% ] 0.31% | 23,697,652 | 5.0% |
[ 0.0% - 0.5% ] 0.37% | 11,445,207 | 5.2% |
[ 0.0% - 0.5% ] 0.44% | 8,709,168 | 5.1% |
[ 0.5% - 1.0% ] 0.50% | 6,153,061 | 5.6% |
[ 0.5% - 1.0% ] 0.57% | 5,265,968 | 5.2% |
[ 0.5% - 1.0% ] 0.64% | 3,604,957 | 5.1% |
[ 0.5% - 1.0% ] 0.70% | 2,942,255 | 5.1% |
[ 0.5% - 1.0% ] 0.77% | 1,781,881 | 5.1% |
[ 0.5% - 1.0% ] 0.83% | 1,665,964 | 6.5% |
[ 0.5% - 1.0% ] 0.90% | 2,497,835 | 5.4% |
[ 0.5% - 1.0% ] 0.97% | 1,472,656 | 4.8% |
[ 1.0% - 1.5% ] 1.04% | 1,212,434 | 5.1% |
[ 1.0% - 1.5% ] 1.12% | 1,040,531 | 5.1% |
[ 1.0% - 1.5% ] 1.18% | 1,190,324 | 4.9% |
[ 1.0% - 1.5% ] 1.25% | 1,230,770 | 6.5% |
[ 1.0% - 1.5% ] 1.30% | 616,686 | 5.6% |
[ 1.0% - 1.5% ] 1.37% | 1,373,545 | 5.7% |
[ 1.0% - 1.5% ] 1.44% | 606,866 | 4.8% |
[ 1.5% - 2.0% ] 1.51% | 662,515 | 5.9% |
[ 1.5% - 2.0% ] 1.58% | 621,489 | 4.5% |
[ 1.5% - 2.0% ] 1.64% | 551,553 | 4.5% |
[ 1.5% - 2.0% ] 1.71% | 492,062 | 5.0% |
[ 1.5% - 2.0% ] 1.78% | 505,117 | 4.2% |
[ 1.5% - 2.0% ] 1.85% | 613,341 | 4.7% |
[ 1.5% - 2.0% ] 1.91% | 447,901 | 6.3% |
[ 1.5% - 2.0% ] 1.97% | 310,333 | 5.1% |
[ 2.0% - 2.5% ] 2.04% | 247,603 | 4.5% |
[ 2.0% - 2.5% ] 2.08% | 265,295 | 5.1% |
[ 2.0% - 2.5% ] 2.18% | 351,471 | 5.3% |
[ 2.0% - 2.5% ] 2.24% | 422,672 | 5.2% |
[ 2.0% - 2.5% ] 2.32% | 195,551 | 4.4% |
[ 2.0% - 2.5% ] 2.38% | 190,121 | 6.7% |
[ 2.0% - 2.5% ] 2.45% | 64,627 | 4.9% |
[ 2.5% - 3.0% ] 2.51% | 201,458 | 4.1% |
[ 2.5% - 3.0% ] 2.59% | 8,802 | 11.4% |
[ 2.5% - 3.0% ] 2.63% | 224,978 | 6.9% |
[ 2.5% - 3.0% ] 2.73% | 299,267 | 4.4% |
[ 2.5% - 3.0% ] 2.77% | 9,863 | 5.4% |
[ 2.5% - 3.0% ] 2.85% | 62,529 | 4.9% |
[ 2.5% - 3.0% ] 2.91% | 94,252 | 2.8% |
[ 2.5% - 3.0% ] 2.97% | 235,497 | 5.0% |
[ 3.0% - 3.5% ] 3.04% | 155,207 | 5.1% |
[ 3.0% - 3.5% ] 3.11% | 11,881 | 6.2% |
[ 3.0% - 3.5% ] 3.18% | 125,057 | 4.6% |
[ 3.0% - 3.5% ] 3.26% | 48,470 | 4.7% |
[ 3.0% - 3.5% ] 3.36% | 19,482 | 5.8% |
[ 3.0% - 3.5% ] 3.44% | 88,575 | 4.1% |
[ 3.5% - 4.0% ] 3.58% | 26,077 | 9.1% |
[ 3.5% - 4.0% ] 3.62% | 856 | 1.7% |
[ 3.5% - 4.0% ] 3.69% | 217 | 12.7% |
[ 3.5% - 4.0% ] 3.77% | 41,139 | 2.4% |
[ 3.5% - 4.0% ] 3.86% | 14,570 | 2.9% |
[ 3.5% - 4.0% ] 3.93% | 174,684 | 5.3% |
[ 4.0% - 4.5% ] 4.04% | 1,534 | 5.2% |
[ 4.0% - 4.5% ] 4.10% | 38,178 | 7.1% |
[ 4.0% - 4.5% ] 4.18% | 16,429 | 6.0% |
[ 4.0% - 4.5% ] 4.27% | 202,257 | 3.0% |
[ 4.0% - 4.5% ] 4.34% | 2,302 | 25.5% |
[ 4.0% - 4.5% ] 4.40% | 15,139 | 1.2% |
[ 4.0% - 4.5% ] 4.46% | 38,163 | 1.2% |
[ 4.5% - 5.0% ] 4.53% | 16,596 | 2.2% |
[ 4.5% - 5.0% ] 4.69% | 43,269 | 4.9% |
[ 4.5% - 5.0% ] 4.74% | 33,691 | 4.2% |
[ 4.5% - 5.0% ] 4.81% | 31,288 | 1.7% |
[ 4.5% - 5.0% ] 4.86% | 7,598 | 6.0% |
[ 4.5% - 5.0% ] 4.93% | 345 | 8.0% |
[ 5.0% - 5.5% ] 5.07% | 25,988 | 3.9% |
[ 5.0% - 5.5% ] 5.24% | 687 | 16.9% |
[ 5.0% - 5.5% ] 5.38% | 2,025 | 9.6% |
[ 5.0% - 5.5% ] 5.44% | 7,185 | 7.4% |
[ 5.5% - 6.0% ] 5.52% | 62,419 | 6.7% |
[ 5.5% - 6.0% ] 5.73% | 20,409 | 2.4% |
[ 5.5% - 6.0% ] 5.82% | 8,104 | 9.6% |
[ 5.5% - 6.0% ] 5.85% | 6,601 | 3.3% |
[ 6.0% - 6.5% ] 6.20% | 43,423 | 5.9% |
[ 6.0% - 6.5% ] 6.41% | 2,217 | 8.6% |
[ 6.5% - 7.0% ] 6.74% | 5,285 | 1.2% |
[ 6.5% - 7.0% ] 6.79% | 2,753 | 4.0% |
[ 6.5% - 7.0% ] 6.99% | 8,373 | 4.6% |
[ 7.0% - 7.5% ] 7.06% | 82,314 | 7.6% |
[ 7.5% - 8.0% ] 7.58% | 963 | 7.0% |
[ 7.5% - 8.0% ] 7.94% | 2,910 | 9.6% |
[ 8.0% - 8.5% ] 8.22% | 11,069 | 5.3% |
[ 8.5% - 9.0% ] 8.81% | 4,947 | 3.6% |
[ 8.5% - 9.0% ] 8.90% | 2,101 | 3.0% |
[ 10.0% - 10.5% ] 10.26% | 1,277 | 14.2% |
[ 12.0% - 12.5% ] 12.39% | 1,574 | 7.1% |
[ 14.5% - 15.0% ] 14.61% | 89 | 47.8% |