Vermont Map & Demographics
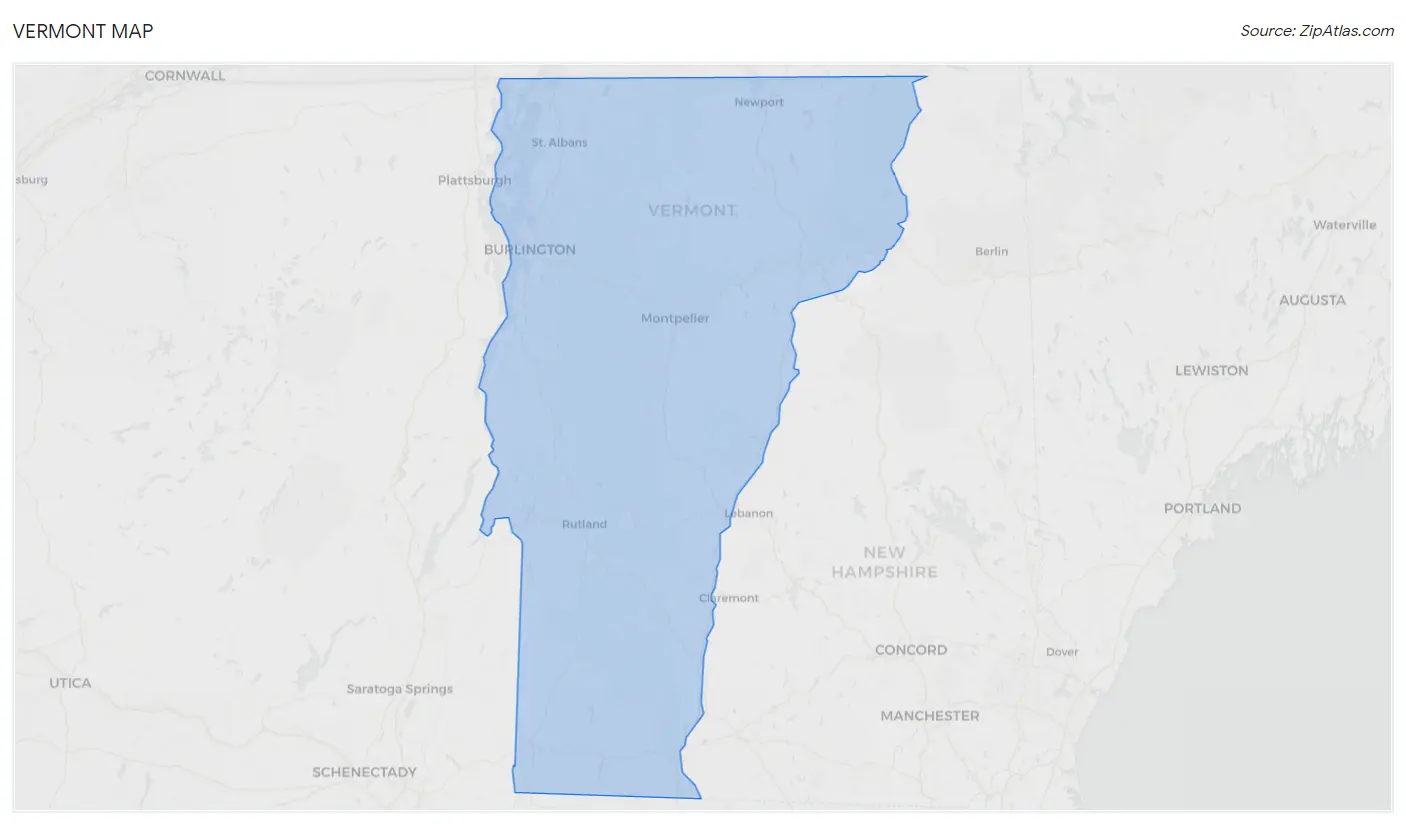
Vermont Map
Vermont Overview
Mar 4, 1791
INCORPORATED
9,616
TOTAL AREA [ SQ MI ]
9,217
LAND AREA [ SQ MI ]
400
WATER AREA [ SQ MI ]
1,000
ELEVATION AVG [ FT ]
4,393
ELEVATION HIGH [ FT ]
95
ELEVATION LOW [ FT ]
69.8
POP DENSITY [ PPL / SQ MI ]
$41,680
PER CAPITA INCOME
$97,153
AVG FAMILY INCOME
$74,014
AVG HOUSEHOLD INCOME
18.3%
WAGE / INCOME GAP [ % ]
81.7¢/ $1
WAGE / INCOME GAP [ $ ]
$10,207
FAMILY INCOME DEFICIT
0.45
INEQUALITY / GINI INDEX
05401
LARGEST ZIP CODE
Burlington
LARGEST CITY
Chittenden County
LARGEST COUNTY
643,816
TOTAL POPULATION
320,339
MALE POPULATION
323,477
FEMALE POPULATION
99.03
MALES / 100 FEMALES
100.98
FEMALES / 100 MALES
42.9
MEDIAN AGE
2.9
AVG FAMILY SIZE
2.3
AVG HOUSEHOLD SIZE
351,725
LABOR FORCE [ PEOPLE ]
64.9%
PERCENT IN LABOR FORCE
3.8%
UNEMPLOYMENT RATE
Vermont Area Codes
Income in Vermont
Income Overview in Vermont
Per Capita Income in Vermont is $41,680, while median incomes of families and households are $97,153 and $74,014 respectively.
| Characteristic | Number | Measure |
| Per Capita Income | 643,816 | $41,680 |
| Median Family Income | 157,518 | $97,153 |
| Mean Family Income | 157,518 | $119,414 |
| Median Household Income | 265,858 | $74,014 |
| Mean Household Income | 265,858 | $97,810 |
| Income Deficit | 157,518 | $10,207 |
| Wage / Income Gap (%) | 643,816 | 18.35% |
| Wage / Income Gap ($) | 643,816 | 81.65¢ per $1 |
| Gini / Inequality Index | 643,816 | 0.45 |
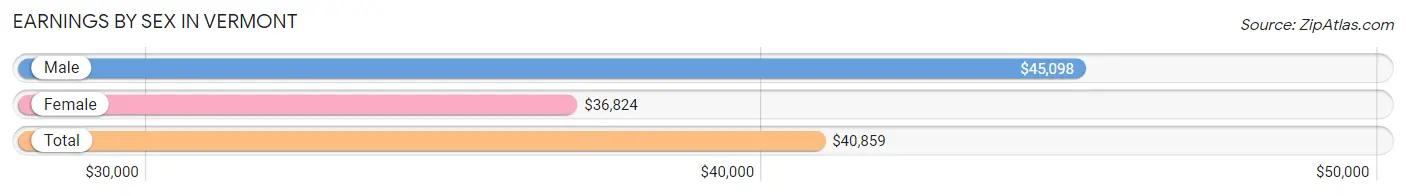
Earnings by Sex in Vermont
Average Earnings in Vermont are $40,859, $45,098 for men and $36,824 for women, a difference of 18.3%.
| Sex | Number | Average Earnings |
| Male | 194,097 (51.1%) | $45,098 |
| Female | 185,501 (48.9%) | $36,824 |
| Total | 379,598 (100.0%) | $40,859 |
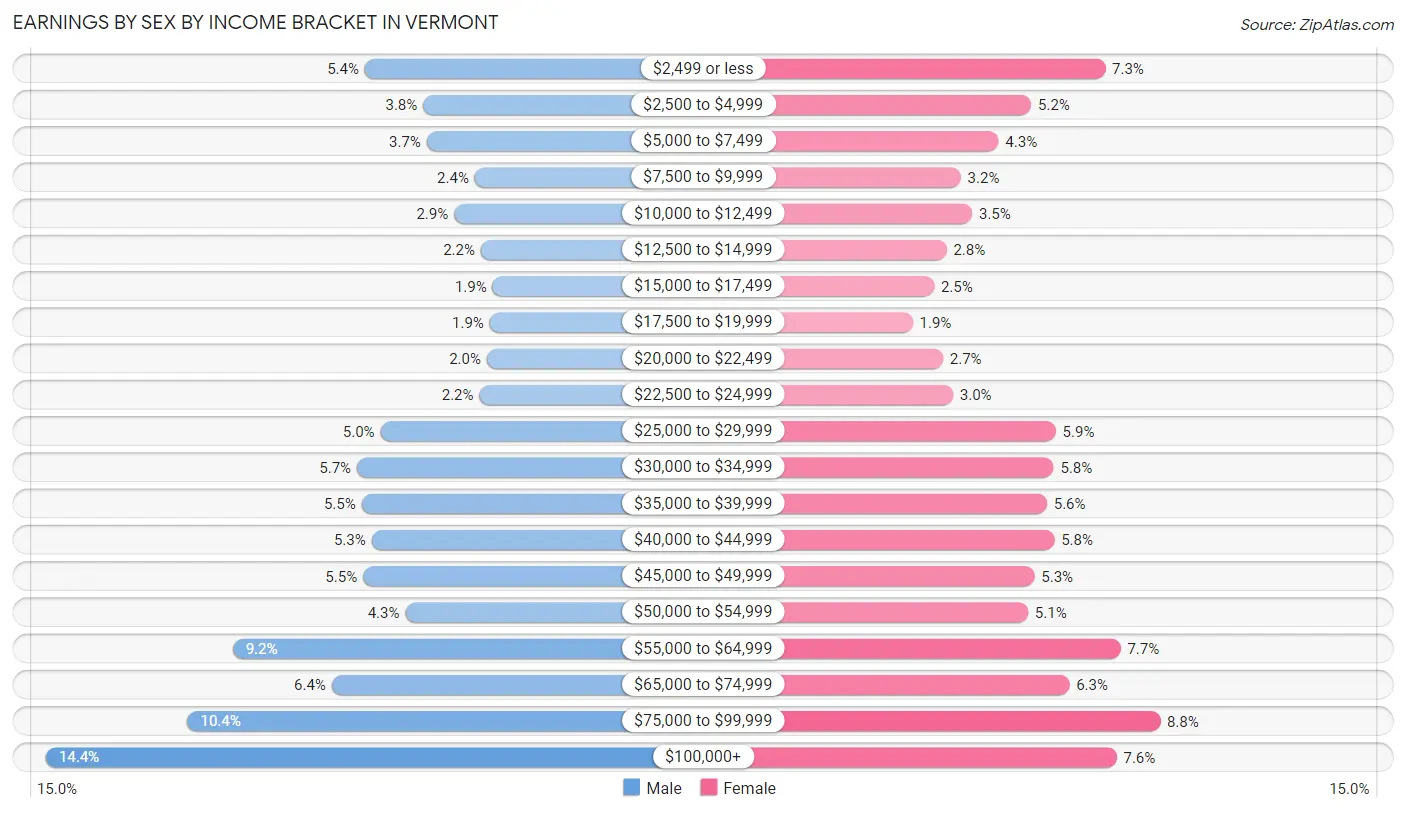
Earnings by Sex by Income Bracket in Vermont
The most common earnings brackets in Vermont are $100,000+ for men (27,941 | 14.4%) and $75,000 to $99,999 for women (16,318 | 8.8%).
| Income | Male | Female |
| $2,499 or less | 10,550 (5.4%) | 13,470 (7.3%) |
| $2,500 to $4,999 | 7,382 (3.8%) | 9,605 (5.2%) |
| $5,000 to $7,499 | 7,184 (3.7%) | 7,907 (4.3%) |
| $7,500 to $9,999 | 4,559 (2.4%) | 5,940 (3.2%) |
| $10,000 to $12,499 | 5,689 (2.9%) | 6,529 (3.5%) |
| $12,500 to $14,999 | 4,239 (2.2%) | 5,197 (2.8%) |
| $15,000 to $17,499 | 3,600 (1.8%) | 4,537 (2.5%) |
| $17,500 to $19,999 | 3,745 (1.9%) | 3,440 (1.8%) |
| $20,000 to $22,499 | 3,902 (2.0%) | 5,007 (2.7%) |
| $22,500 to $24,999 | 4,317 (2.2%) | 5,528 (3.0%) |
| $25,000 to $29,999 | 9,712 (5.0%) | 10,881 (5.9%) |
| $30,000 to $34,999 | 10,978 (5.7%) | 10,772 (5.8%) |
| $35,000 to $39,999 | 10,731 (5.5%) | 10,425 (5.6%) |
| $40,000 to $44,999 | 10,197 (5.2%) | 10,814 (5.8%) |
| $45,000 to $49,999 | 10,658 (5.5%) | 9,782 (5.3%) |
| $50,000 to $54,999 | 8,355 (4.3%) | 9,433 (5.1%) |
| $55,000 to $64,999 | 17,762 (9.1%) | 14,259 (7.7%) |
| $65,000 to $74,999 | 12,364 (6.4%) | 11,599 (6.2%) |
| $75,000 to $99,999 | 20,232 (10.4%) | 16,318 (8.8%) |
| $100,000+ | 27,941 (14.4%) | 14,058 (7.6%) |
| Total | 194,097 (100.0%) | 185,501 (100.0%) |
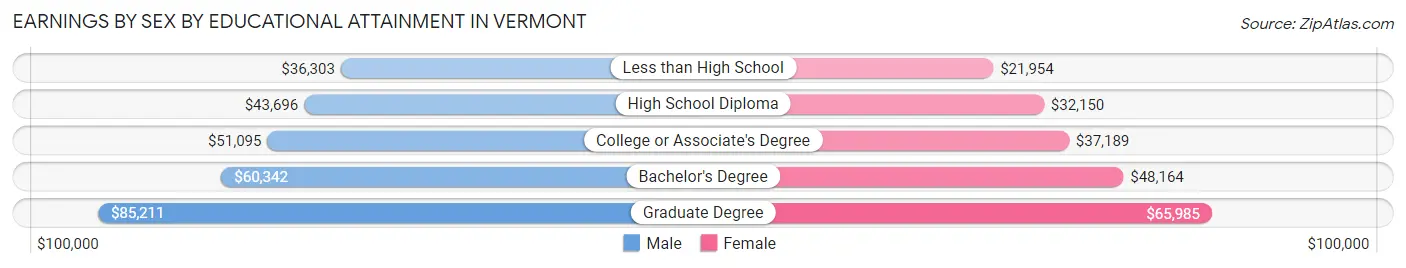
Earnings by Sex by Educational Attainment in Vermont
Average earnings in Vermont are $52,674 for men and $43,832 for women, a difference of 16.8%. Men with an educational attainment of graduate degree enjoy the highest average annual earnings of $85,211, while those with less than high school education earn the least with $36,303. Women with an educational attainment of graduate degree earn the most with the average annual earnings of $65,985, while those with less than high school education have the smallest earnings of $21,954.
| Educational Attainment | Male Income | Female Income |
| Less than High School | $36,303 | $21,954 |
| High School Diploma | $43,696 | $32,150 |
| College or Associate's Degree | $51,095 | $37,189 |
| Bachelor's Degree | $60,342 | $48,164 |
| Graduate Degree | $85,211 | $65,985 |
| Total | $52,674 | $43,832 |
Family Income in Vermont
Family Income Brackets in Vermont
According to the Vermont family income data, there are 37,332 families falling into the $100,000 to $149,999 income range, which is the most common income bracket and makes up 23.7% of all families. Conversely, the $10,000 to $14,999 income bracket is the least frequent group with only 2,205 families (1.4%) belonging to this category.
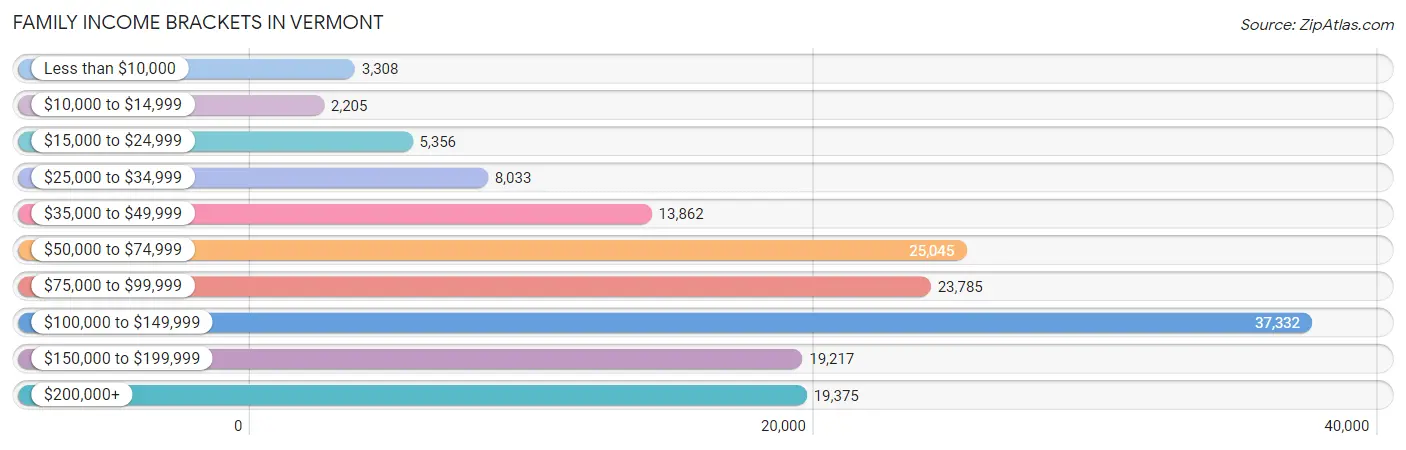
| Income Bracket | # Families | % Families |
| Less than $10,000 | 3,308 | 2.1% |
| $10,000 to $14,999 | 2,205 | 1.4% |
| $15,000 to $24,999 | 5,356 | 3.4% |
| $25,000 to $34,999 | 8,033 | 5.1% |
| $35,000 to $49,999 | 13,862 | 8.8% |
| $50,000 to $74,999 | 25,045 | 15.9% |
| $75,000 to $99,999 | 23,785 | 15.1% |
| $100,000 to $149,999 | 37,332 | 23.7% |
| $150,000 to $199,999 | 19,217 | 12.2% |
| $200,000+ | 19,375 | 12.3% |
Family Income by Famaliy Size in Vermont
4-person families (24,133 | 15.3%) account for the highest median family income in Vermont with $125,336 per family, while 2-person families (88,896 | 56.4%) have the highest median income of $42,950 per family member.
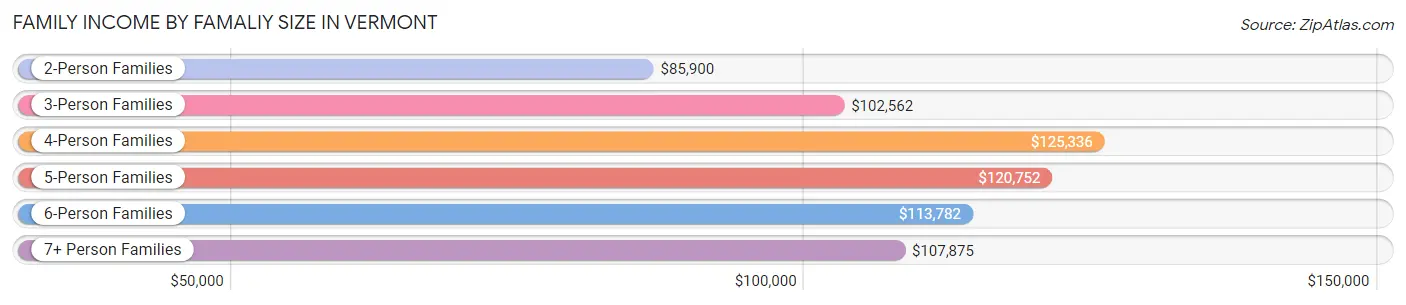
| Income Bracket | # Families | Median Income |
| 2-Person Families | 88,896 (56.4%) | $85,900 |
| 3-Person Families | 32,848 (20.8%) | $102,562 |
| 4-Person Families | 24,133 (15.3%) | $125,336 |
| 5-Person Families | 8,027 (5.1%) | $120,752 |
| 6-Person Families | 2,652 (1.7%) | $113,782 |
| 7+ Person Families | 962 (0.6%) | $107,875 |
| Total | 157,518 (100.0%) | $97,153 |
Family Income by Number of Earners in Vermont
The median family income in Vermont is $97,153, with families comprising 3+ earners (16,471) having the highest median family income of $148,626, while families with no earners (24,024) have the lowest median family income of $53,474, accounting for 10.5% and 15.2% of families, respectively.
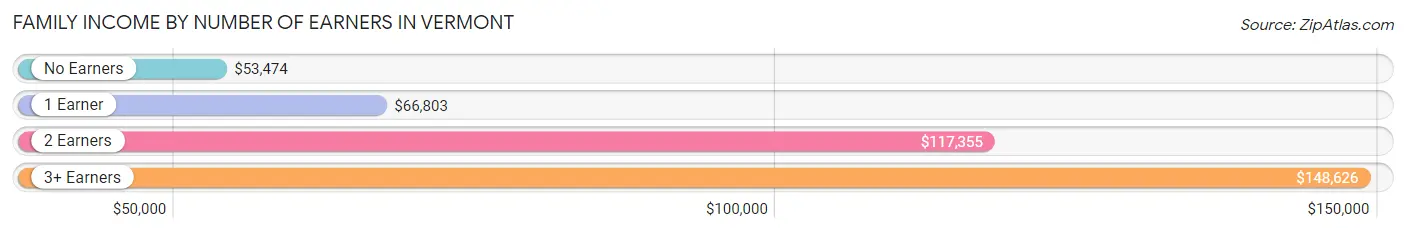
| Number of Earners | # Families | Median Income |
| No Earners | 24,024 (15.2%) | $53,474 |
| 1 Earner | 43,212 (27.4%) | $66,803 |
| 2 Earners | 73,811 (46.9%) | $117,355 |
| 3+ Earners | 16,471 (10.5%) | $148,626 |
| Total | 157,518 (100.0%) | $97,153 |
Household Income in Vermont
Household Income Brackets in Vermont
With 48,918 households falling in the category, the $100,000 to $149,999 income range is the most frequent in Vermont, accounting for 18.4% of all households. In contrast, only 10,368 households (3.9%) fall into the less than $10,000 income bracket, making it the least populous group.
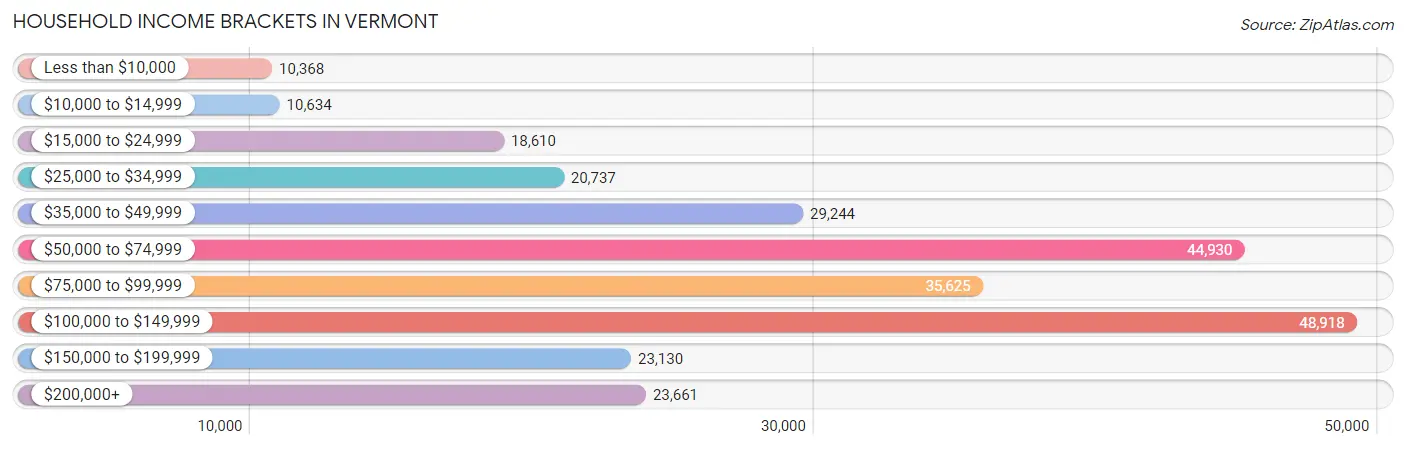
| Income Bracket | # Households | % Households |
| Less than $10,000 | 10,368 | 3.9% |
| $10,000 to $14,999 | 10,634 | 4.0% |
| $15,000 to $24,999 | 18,610 | 7.0% |
| $25,000 to $34,999 | 20,737 | 7.8% |
| $35,000 to $49,999 | 29,244 | 11.0% |
| $50,000 to $74,999 | 44,930 | 16.9% |
| $75,000 to $99,999 | 35,625 | 13.4% |
| $100,000 to $149,999 | 48,918 | 18.4% |
| $150,000 to $199,999 | 23,130 | 8.7% |
| $200,000+ | 23,661 | 8.9% |
Household Income by Householder Age in Vermont
The median household income in Vermont is $74,014, with the highest median household income of $88,017 found in the 45 to 64 years age bracket for the primary householder. A total of 100,095 households (37.7%) fall into this category. Meanwhile, the 15 to 24 years age bracket for the primary householder has the lowest median household income of $40,031, with 10,079 households (3.8%) in this group.
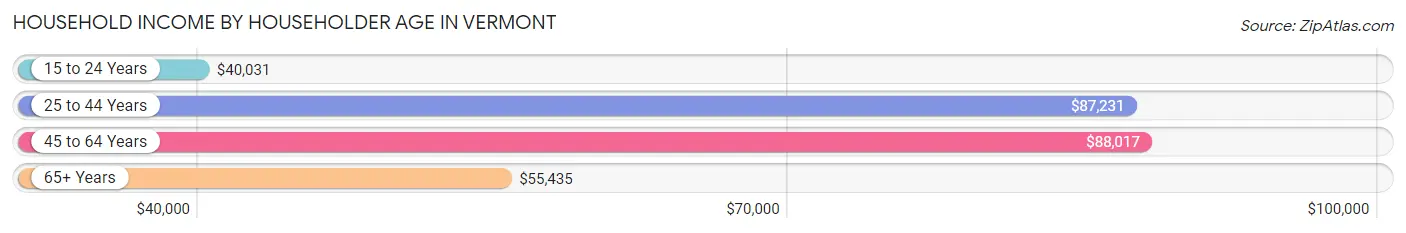
| Income Bracket | # Households | Median Income |
| 15 to 24 Years | 10,079 (3.8%) | $40,031 |
| 25 to 44 Years | 72,658 (27.3%) | $87,231 |
| 45 to 64 Years | 100,095 (37.7%) | $88,017 |
| 65+ Years | 83,026 (31.2%) | $55,435 |
| Total | 265,858 (100.0%) | $74,014 |
Poverty in Vermont
Income Below Poverty by Sex and Age in Vermont
With 9.3% poverty level for males and 11.5% for females among the residents of Vermont, 18 to 24 year old males and 18 to 24 year old females are the most vulnerable to poverty, with 4,614 males (16.9%) and 7,044 females (28.4%) in their respective age groups living below the poverty level.
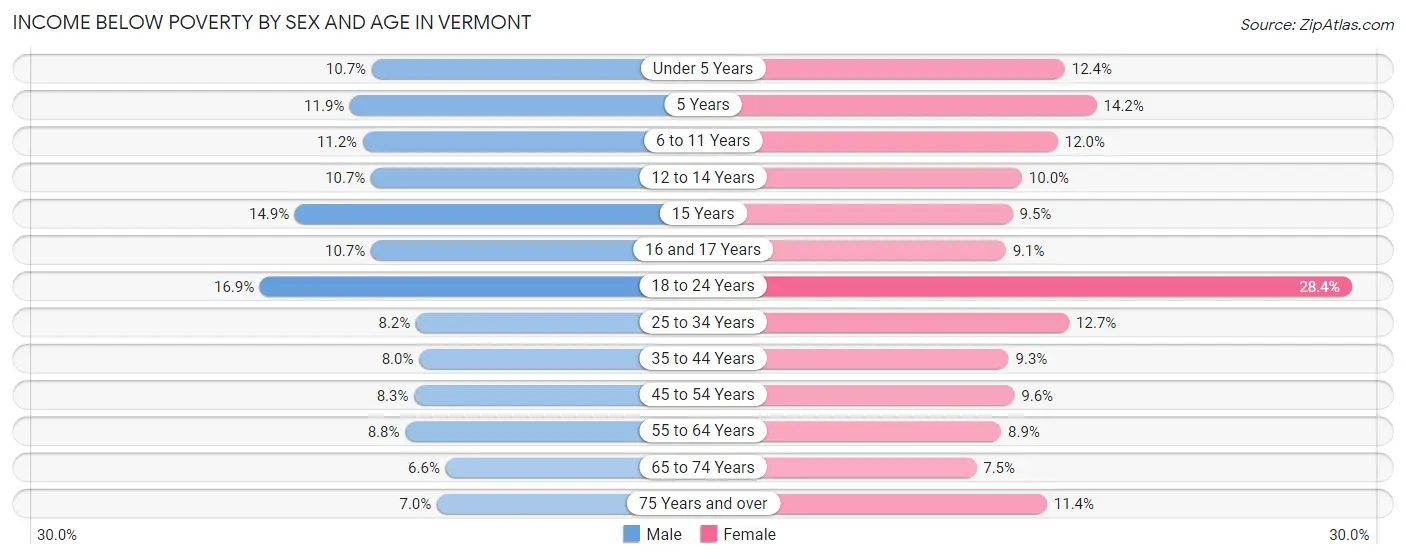
| Age Bracket | Male | Female |
| Under 5 Years | 1,512 (10.7%) | 1,672 (12.4%) |
| 5 Years | 355 (11.9%) | 415 (14.2%) |
| 6 to 11 Years | 2,303 (11.2%) | 2,168 (12.0%) |
| 12 to 14 Years | 1,140 (10.7%) | 1,033 (10.0%) |
| 15 Years | 564 (14.9%) | 299 (9.5%) |
| 16 and 17 Years | 814 (10.7%) | 657 (9.1%) |
| 18 to 24 Years | 4,614 (16.9%) | 7,044 (28.4%) |
| 25 to 34 Years | 3,142 (8.2%) | 4,714 (12.7%) |
| 35 to 44 Years | 2,985 (8.0%) | 3,536 (9.3%) |
| 45 to 54 Years | 3,290 (8.3%) | 3,798 (9.6%) |
| 55 to 64 Years | 4,177 (8.8%) | 4,353 (8.9%) |
| 65 to 74 Years | 2,527 (6.6%) | 3,024 (7.5%) |
| 75 Years and over | 1,487 (7.0%) | 3,116 (11.4%) |
| Total | 28,910 (9.3%) | 35,829 (11.5%) |
Income Above Poverty by Sex and Age in Vermont
According to the poverty statistics in Vermont, males aged 65 to 74 years and females aged 65 to 74 years are the age groups that are most secure financially, with 93.4% of males and 92.5% of females in these age groups living above the poverty line.
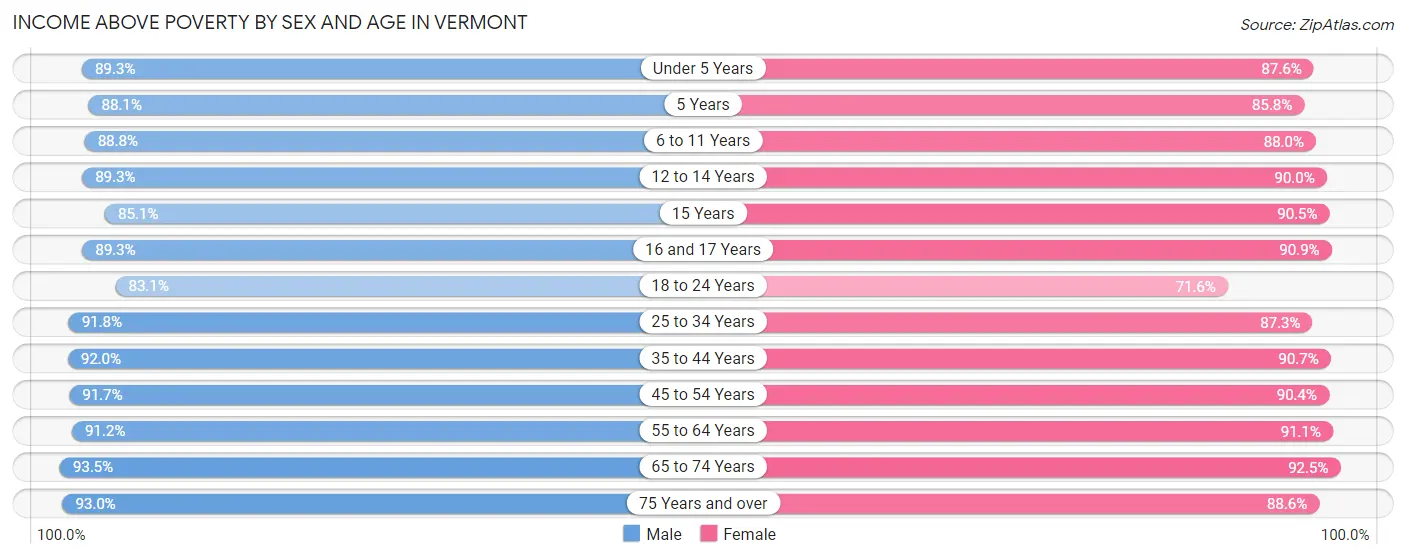
| Age Bracket | Male | Female |
| Under 5 Years | 12,669 (89.3%) | 11,792 (87.6%) |
| 5 Years | 2,635 (88.1%) | 2,509 (85.8%) |
| 6 to 11 Years | 18,341 (88.8%) | 15,850 (88.0%) |
| 12 to 14 Years | 9,516 (89.3%) | 9,265 (90.0%) |
| 15 Years | 3,211 (85.1%) | 2,844 (90.5%) |
| 16 and 17 Years | 6,788 (89.3%) | 6,538 (90.9%) |
| 18 to 24 Years | 22,700 (83.1%) | 17,774 (71.6%) |
| 25 to 34 Years | 35,166 (91.8%) | 32,515 (87.3%) |
| 35 to 44 Years | 34,246 (92.0%) | 34,516 (90.7%) |
| 45 to 54 Years | 36,353 (91.7%) | 35,715 (90.4%) |
| 55 to 64 Years | 43,271 (91.2%) | 44,716 (91.1%) |
| 65 to 74 Years | 36,024 (93.4%) | 37,358 (92.5%) |
| 75 Years and over | 19,667 (93.0%) | 24,159 (88.6%) |
| Total | 280,587 (90.7%) | 275,551 (88.5%) |
Income Below Poverty Among Married-Couple Families in Vermont
The poverty statistics for married-couple families in Vermont show that 2.8% or 3,453 of the total 124,656 families live below the poverty line. Families with 5 or more children have the highest poverty rate of 33.8%, comprising of 102 families. On the other hand, families with no children have the lowest poverty rate of 2.5%, which includes 2,081 families.
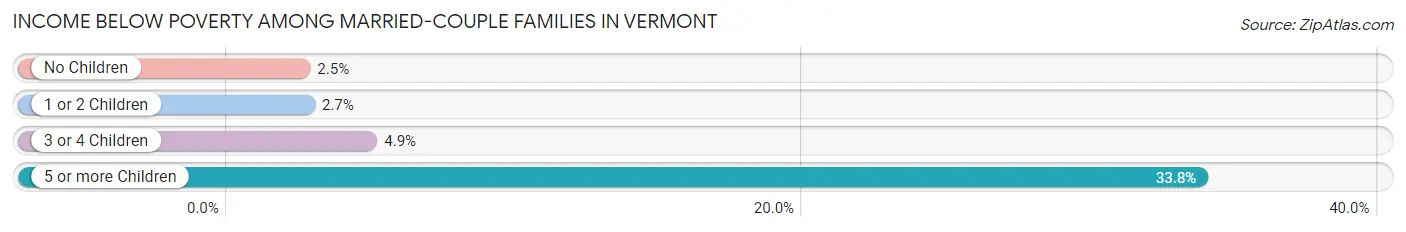
| Children | Above Poverty | Below Poverty |
| No Children | 80,431 (97.5%) | 2,081 (2.5%) |
| 1 or 2 Children | 34,055 (97.3%) | 938 (2.7%) |
| 3 or 4 Children | 6,517 (95.2%) | 332 (4.9%) |
| 5 or more Children | 200 (66.2%) | 102 (33.8%) |
| Total | 121,203 (97.2%) | 3,453 (2.8%) |
Income Below Poverty Among Single-Parent Households in Vermont
According to the poverty data in Vermont, 12.4% or 1,321 single-father households and 20.1% or 4,455 single-mother households are living below the poverty line. Among single-father households, those with 5 or more children have the highest poverty rate, with 58 households (51.3%) experiencing poverty. Likewise, among single-mother households, those with 5 or more children have the highest poverty rate, with 42 households (64.6%) falling below the poverty line.
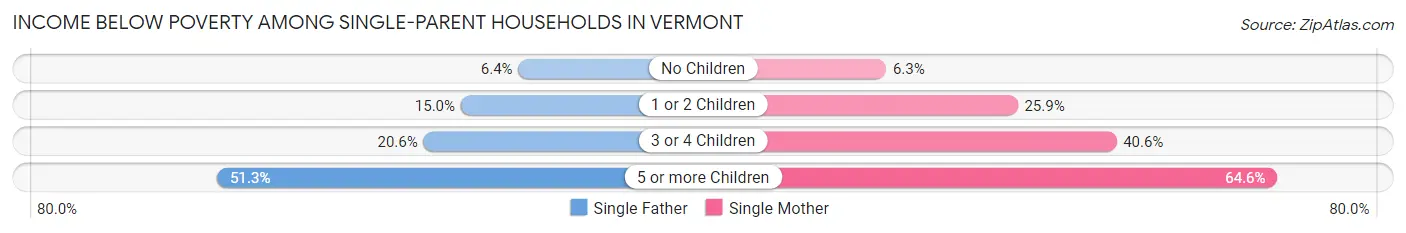
| Children | Single Father | Single Mother |
| No Children | 261 (6.4%) | 496 (6.3%) |
| 1 or 2 Children | 890 (15.0%) | 3,301 (25.9%) |
| 3 or 4 Children | 112 (20.5%) | 616 (40.6%) |
| 5 or more Children | 58 (51.3%) | 42 (64.6%) |
| Total | 1,321 (12.4%) | 4,455 (20.1%) |
Income Below Poverty Among Married-Couple vs Single-Parent Households in Vermont
The poverty data for Vermont shows that 3,453 of the married-couple family households (2.8%) and 5,776 of the single-parent households (17.6%) are living below the poverty level. Within the married-couple family households, those with 5 or more children have the highest poverty rate, with 102 households (33.8%) falling below the poverty line. Among the single-parent households, those with 5 or more children have the highest poverty rate, with 100 household (56.2%) living below poverty.
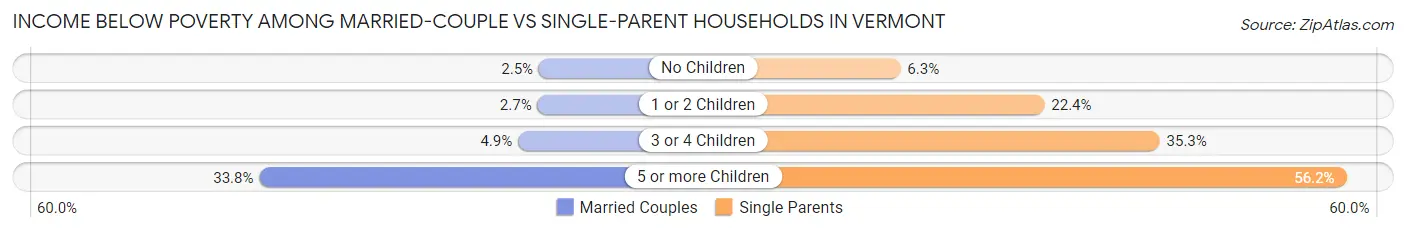
| Children | Married-Couple Families | Single-Parent Households |
| No Children | 2,081 (2.5%) | 757 (6.3%) |
| 1 or 2 Children | 938 (2.7%) | 4,191 (22.4%) |
| 3 or 4 Children | 332 (4.9%) | 728 (35.3%) |
| 5 or more Children | 102 (33.8%) | 100 (56.2%) |
| Total | 3,453 (2.8%) | 5,776 (17.6%) |
Largest Zip Codes by Population in Vermont
The largest zip codes in Vermont by population are 05401 (32,019), 05452 (22,338), 05701 (20,469), 05403 (20,177), and 05641 (16,860).
1.05401
32,019 (4.97%)
2.05452
22,338 (3.47%)
3.05701
20,469 (3.18%)
4.05403
20,177 (3.13%)
5.05641
16,860 (2.62%)
6.05301
16,673 (2.59%)
7.05446
16,292 (2.53%)
8.05478
16,034 (2.49%)
9.05201
14,901 (2.31%)
10.05468
13,254 (2.06%)
11.05602
12,572 (1.95%)
12.05753
10,927 (1.70%)
13.05495
10,888 (1.69%)
14.05408
10,067 (1.56%)
15.05001
9,644 (1.50%)
16.05819
9,383 (1.46%)
17.05156
9,307 (1.45%)
18.05404
8,082 (1.26%)
19.05488
7,984 (1.24%)
20.05482
7,800 (1.21%)
21.05855
7,638 (1.19%)
22.05663
6,727 (1.04%)
23.05443
6,360 (0.99%)
24.05661
6,081 (0.94%)
25.05733
6,038 (0.94%)
26.05851
5,933 (0.92%)
27.05491
5,880 (0.91%)
28.05465
5,589 (0.87%)
29.05450
5,306 (0.82%)
30.05346
5,262 (0.82%)
Largest Cities by Population in Vermont
The largest cities in Vermont by population are Burlington (44,646), South Burlington (20,241), Rutland (15,819), Essex Junction (10,646), and Bennington (8,753).
44,646 (6.93%)
20,241 (3.14%)
3.Rutland
15,819 (2.46%)
10,646 (1.65%)
8,753 (1.36%)
6.Barre
8,488 (1.32%)
7.Winooski
8,122 (1.26%)
8,030 (1.25%)
7,543 (1.17%)
10.Middlebury
6,913 (1.07%)
11.St Albans
6,891 (1.07%)
12.Shelburne
6,195 (0.96%)
13.St Johnsbury
5,963 (0.93%)
14.Newport
4,431 (0.69%)
15.Northfield
4,390 (0.68%)
16.Springfield
3,946 (0.61%)
17.Milton
3,712 (0.58%)
18.Wilder
3,634 (0.56%)
2,824 (0.44%)
2,817 (0.44%)
2,766 (0.43%)
22.Morrisville
2,576 (0.40%)
23.Vergennes
2,561 (0.40%)
24.Swanton
2,428 (0.38%)
25.Fair Haven
2,422 (0.38%)
26.West Rutland
2,222 (0.35%)
27.Windsor
2,138 (0.33%)
28.Randolph
2,010 (0.31%)
29.Bristol
1,956 (0.30%)
30.Brandon
1,858 (0.29%)
Largest Counties by Population in Vermont
The largest counties in Vermont by population are Chittenden County (168,309), Rutland County (60,585), Washington County (59,768), Windsor County (57,832), and Franklin County (50,101).
168,309 (26.14%)
60,585 (9.41%)
59,768 (9.28%)
57,832 (8.98%)
50,101 (7.78%)
45,857 (7.12%)
37,434 (5.81%)
37,326 (5.80%)
30,418 (4.72%)
29,439 (4.57%)
27,459 (4.27%)
25,977 (4.03%)
7,335 (1.14%)
14.Essex County
5,976 (0.93%)
Race in Vermont
The most populous races in Vermont are White / Caucasian (594,131 | 92.3%), Two or more Races (25,809 | 4.0%), and Hispanic or Latino (13,793 | 2.1%).
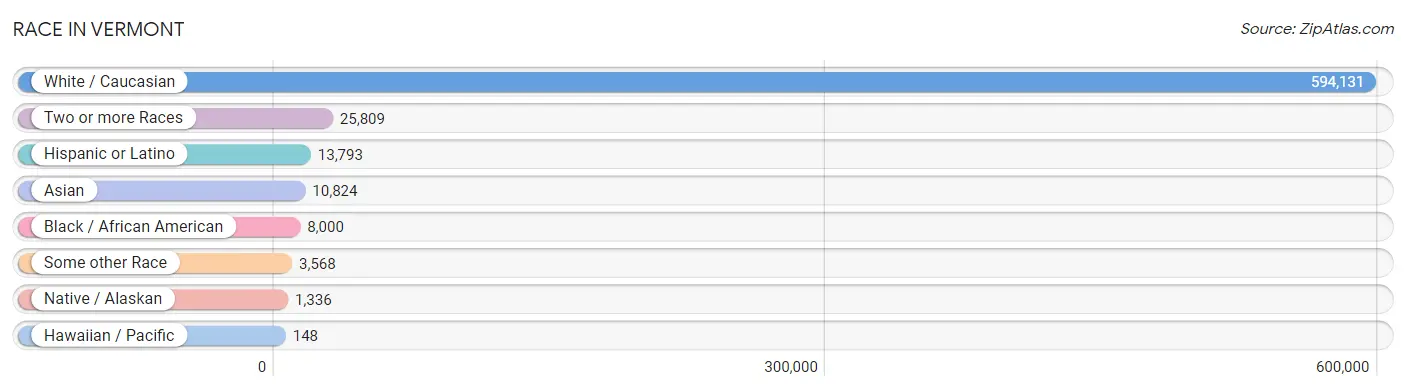
| Race | # Population | % Population |
| Asian | 10,824 | 1.7% |
| Black / African American | 8,000 | 1.2% |
| Hawaiian / Pacific | 148 | 0.0% |
| Hispanic or Latino | 13,793 | 2.1% |
| Native / Alaskan | 1,336 | 0.2% |
| White / Caucasian | 594,131 | 92.3% |
| Two or more Races | 25,809 | 4.0% |
| Some other Race | 3,568 | 0.5% |
| Total | 643,816 | 100.0% |
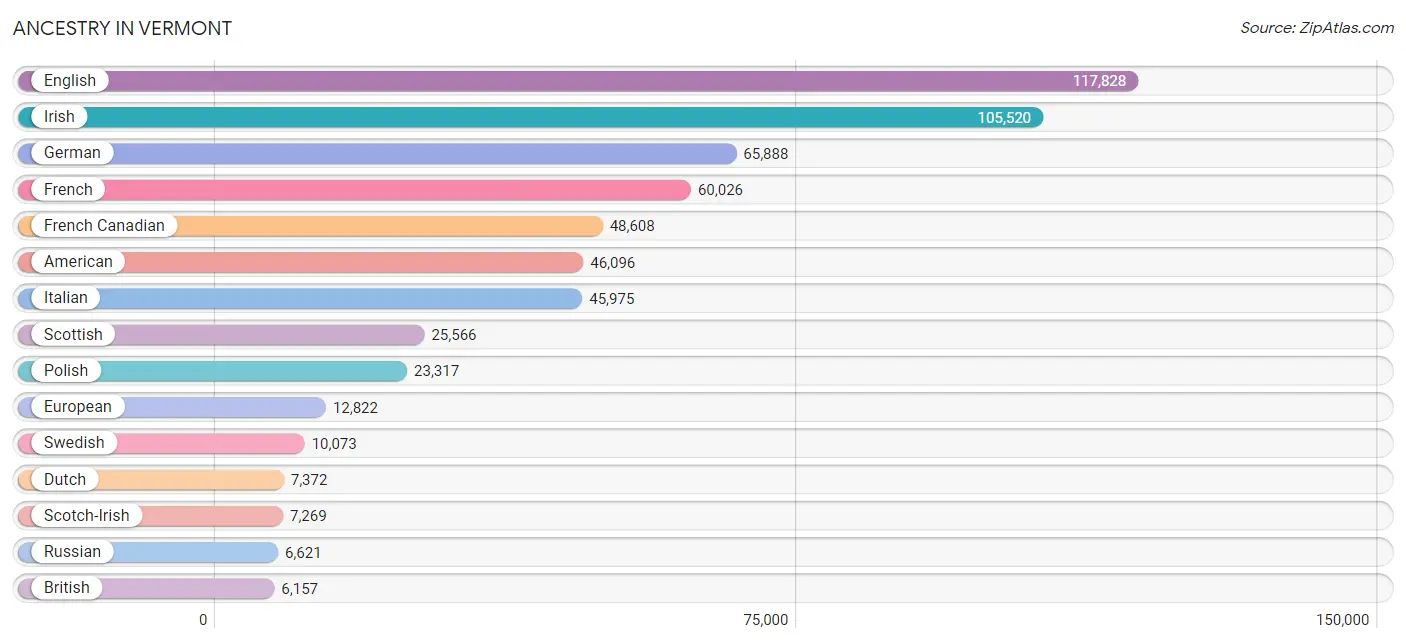
Ancestry in Vermont
The most populous ancestries reported in Vermont are English (117,828 | 18.3%), Irish (105,520 | 16.4%), German (65,888 | 10.2%), French (60,026 | 9.3%), and French Canadian (48,608 | 7.5%), together accounting for 61.8% of all Vermont residents.
| Ancestry | # Population | % Population |
| African | 896 | 0.1% |
| Alaska Native | 9 | 0.0% |
| Albanian | 93 | 0.0% |
| Aleut | 11 | 0.0% |
| Alsatian | 25 | 0.0% |
| American | 46,096 | 7.2% |
| Apache | 54 | 0.0% |
| Arab | 2,051 | 0.3% |
| Argentinean | 289 | 0.0% |
| Armenian | 640 | 0.1% |
| Assyrian / Chaldean / Syriac | 7 | 0.0% |
| Australian | 99 | 0.0% |
| Austrian | 1,885 | 0.3% |
| Bahamian | 2 | 0.0% |
| Barbadian | 59 | 0.0% |
| Basque | 30 | 0.0% |
| Belgian | 417 | 0.1% |
| Bhutanese | 1,089 | 0.2% |
| Blackfeet | 449 | 0.1% |
| Bolivian | 108 | 0.0% |
| Brazilian | 375 | 0.1% |
| British | 6,157 | 1.0% |
| British West Indian | 32 | 0.0% |
| Bulgarian | 56 | 0.0% |
| Burmese | 1,828 | 0.3% |
| Cajun | 51 | 0.0% |
| Cambodian | 14 | 0.0% |
| Canadian | 5,117 | 0.8% |
| Cape Verdean | 58 | 0.0% |
| Carpatho Rusyn | 7 | 0.0% |
| Celtic | 350 | 0.1% |
| Central American | 999 | 0.2% |
| Central American Indian | 357 | 0.1% |
| Cherokee | 762 | 0.1% |
| Cheyenne | 17 | 0.0% |
| Chickasaw | 54 | 0.0% |
| Chilean | 221 | 0.0% |
| Chippewa | 62 | 0.0% |
| Choctaw | 72 | 0.0% |
| Colombian | 585 | 0.1% |
| Costa Rican | 122 | 0.0% |
| Cree | 57 | 0.0% |
| Creek | 26 | 0.0% |
| Croatian | 363 | 0.1% |
| Crow | 4 | 0.0% |
| Cuban | 823 | 0.1% |
| Cypriot | 2 | 0.0% |
| Czech | 1,808 | 0.3% |
| Czechoslovakian | 384 | 0.1% |
| Danish | 2,217 | 0.3% |
| Delaware | 14 | 0.0% |
| Dominican | 691 | 0.1% |
| Dutch | 7,372 | 1.1% |
| Eastern European | 3,628 | 0.6% |
| Ecuadorian | 186 | 0.0% |
| Egyptian | 19 | 0.0% |
| English | 117,828 | 18.3% |
| Estonian | 44 | 0.0% |
| Ethiopian | 73 | 0.0% |
| European | 12,822 | 2.0% |
| Filipino | 76 | 0.0% |
| Finnish | 2,080 | 0.3% |
| French | 60,026 | 9.3% |
| French American Indian | 531 | 0.1% |
| French Canadian | 48,608 | 7.5% |
| German | 65,888 | 10.2% |
| German Russian | 38 | 0.0% |
| Ghanaian | 119 | 0.0% |
| Greek | 2,844 | 0.4% |
| Guamanian / Chamorro | 123 | 0.0% |
| Guatemalan | 314 | 0.1% |
| Guyanese | 35 | 0.0% |
| Haitian | 235 | 0.0% |
| Honduran | 36 | 0.0% |
| Hopi | 10 | 0.0% |
| Hungarian | 2,940 | 0.5% |
| Icelander | 119 | 0.0% |
| Indian (Asian) | 3,315 | 0.5% |
| Indonesian | 590 | 0.1% |
| Inupiat | 12 | 0.0% |
| Iranian | 421 | 0.1% |
| Iraqi | 73 | 0.0% |
| Irish | 105,520 | 16.4% |
| Iroquois | 370 | 0.1% |
| Israeli | 288 | 0.0% |
| Italian | 45,975 | 7.1% |
| Jamaican | 1,054 | 0.2% |
| Japanese | 132 | 0.0% |
| Jordanian | 29 | 0.0% |
| Kenyan | 126 | 0.0% |
| Korean | 2,407 | 0.4% |
| Laotian | 175 | 0.0% |
| Latvian | 296 | 0.1% |
| Lebanese | 1,171 | 0.2% |
| Lithuanian | 2,398 | 0.4% |
| Luxembourger | 63 | 0.0% |
| Macedonian | 82 | 0.0% |
| Malaysian | 124 | 0.0% |
| Maltese | 64 | 0.0% |
| Menominee | 12 | 0.0% |
| Mexican | 3,607 | 0.6% |
| Mexican American Indian | 27 | 0.0% |
| Mongolian | 54 | 0.0% |
| Moroccan | 27 | 0.0% |
| Native Hawaiian | 179 | 0.0% |
| Navajo | 139 | 0.0% |
| New Zealander | 78 | 0.0% |
| Nicaraguan | 216 | 0.0% |
| Nigerian | 541 | 0.1% |
| Northern European | 2,696 | 0.4% |
| Norwegian | 5,976 | 0.9% |
| Okinawan | 21 | 0.0% |
| Osage | 8 | 0.0% |
| Ottawa | 12 | 0.0% |
| Pakistani | 339 | 0.1% |
| Palestinian | 66 | 0.0% |
| Panamanian | 47 | 0.0% |
| Paraguayan | 45 | 0.0% |
| Pennsylvania German | 172 | 0.0% |
| Peruvian | 359 | 0.1% |
| Pima | 1 | 0.0% |
| Polish | 23,317 | 3.6% |
| Portuguese | 2,842 | 0.4% |
| Potawatomi | 5 | 0.0% |
| Pueblo | 25 | 0.0% |
| Puerto Rican | 2,488 | 0.4% |
| Romanian | 790 | 0.1% |
| Russian | 6,621 | 1.0% |
| Salvadoran | 264 | 0.0% |
| Samoan | 159 | 0.0% |
| Scandinavian | 2,097 | 0.3% |
| Scotch-Irish | 7,269 | 1.1% |
| Scottish | 25,566 | 4.0% |
| Seminole | 8 | 0.0% |
| Senegalese | 71 | 0.0% |
| Serbian | 242 | 0.0% |
| Shoshone | 40 | 0.0% |
| Sioux | 169 | 0.0% |
| Slavic | 204 | 0.0% |
| Slovak | 1,498 | 0.2% |
| Slovene | 274 | 0.0% |
| Somali | 489 | 0.1% |
| South African | 45 | 0.0% |
| South American | 2,331 | 0.4% |
| South American Indian | 131 | 0.0% |
| Spaniard | 946 | 0.2% |
| Spanish | 780 | 0.1% |
| Sri Lankan | 1,148 | 0.2% |
| Subsaharan African | 3,170 | 0.5% |
| Sudanese | 18 | 0.0% |
| Swedish | 10,073 | 1.6% |
| Swiss | 1,816 | 0.3% |
| Syrian | 349 | 0.1% |
| Thai | 2,404 | 0.4% |
| Trinidadian and Tobagonian | 74 | 0.0% |
| Turkish | 260 | 0.0% |
| U.S. Virgin Islander | 2 | 0.0% |
| Ugandan | 17 | 0.0% |
| Ukrainian | 2,124 | 0.3% |
| Uruguayan | 187 | 0.0% |
| Venezuelan | 351 | 0.1% |
| Vietnamese | 12 | 0.0% |
| Welsh | 6,152 | 1.0% |
| West Indian | 42 | 0.0% |
| Yaqui | 42 | 0.0% |
| Yugoslavian | 1,025 | 0.2% |
| Zimbabwean | 16 | 0.0% | View All 167 Rows |
Immigrants in Vermont
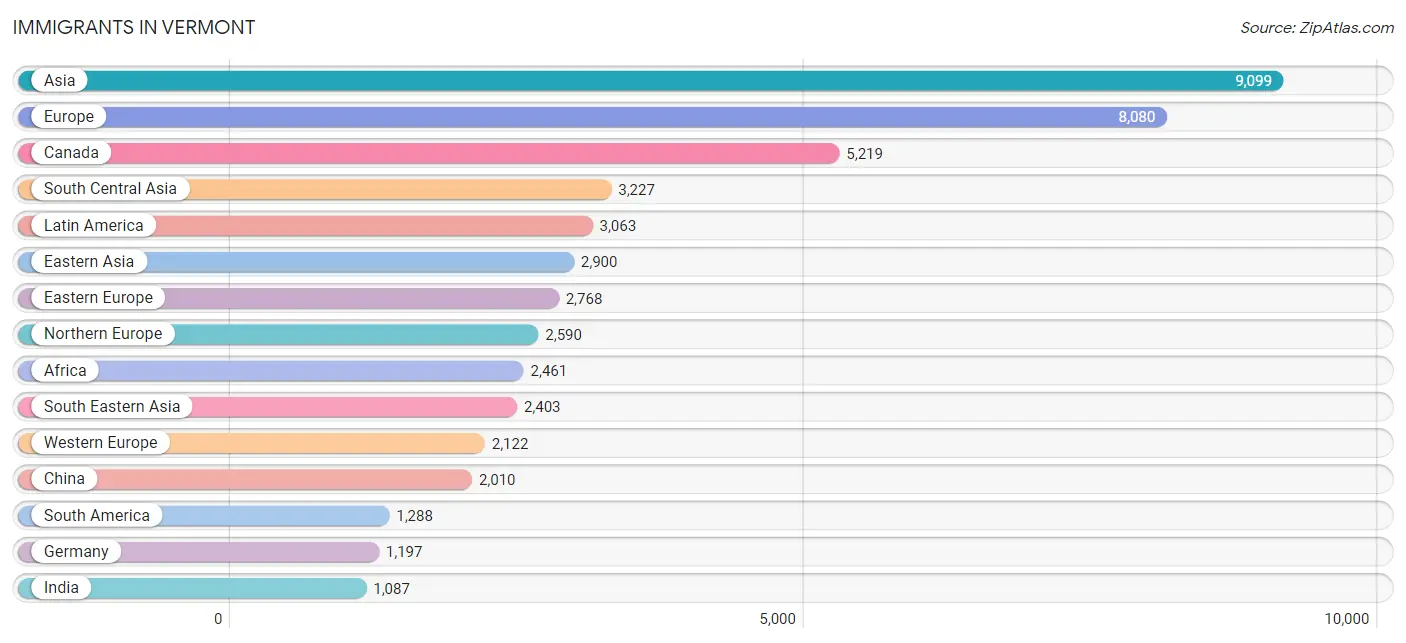
The most numerous immigrant groups reported in Vermont came from Asia (9,099 | 1.4%), Europe (8,080 | 1.3%), Canada (5,219 | 0.8%), South Central Asia (3,227 | 0.5%), and Latin America (3,063 | 0.5%), together accounting for 4.5% of all Vermont residents.
| Immigration Origin | # Population | % Population |
| Afghanistan | 1 | 0.0% |
| Africa | 2,461 | 0.4% |
| Albania | 41 | 0.0% |
| Argentina | 89 | 0.0% |
| Armenia | 6 | 0.0% |
| Asia | 9,099 | 1.4% |
| Australia | 268 | 0.0% |
| Austria | 130 | 0.0% |
| Bahamas | 21 | 0.0% |
| Bangladesh | 62 | 0.0% |
| Barbados | 25 | 0.0% |
| Belarus | 28 | 0.0% |
| Belgium | 82 | 0.0% |
| Bolivia | 26 | 0.0% |
| Bosnia and Herzegovina | 866 | 0.1% |
| Brazil | 335 | 0.1% |
| Bulgaria | 35 | 0.0% |
| Cambodia | 77 | 0.0% |
| Canada | 5,219 | 0.8% |
| Caribbean | 954 | 0.2% |
| Central America | 821 | 0.1% |
| Chile | 62 | 0.0% |
| China | 2,010 | 0.3% |
| Colombia | 138 | 0.0% |
| Congo | 26 | 0.0% |
| Costa Rica | 3 | 0.0% |
| Croatia | 17 | 0.0% |
| Cuba | 31 | 0.0% |
| Czechoslovakia | 93 | 0.0% |
| Denmark | 37 | 0.0% |
| Dominica | 31 | 0.0% |
| Dominican Republic | 102 | 0.0% |
| Eastern Africa | 685 | 0.1% |
| Eastern Asia | 2,900 | 0.4% |
| Eastern Europe | 2,768 | 0.4% |
| Ecuador | 96 | 0.0% |
| Egypt | 8 | 0.0% |
| El Salvador | 40 | 0.0% |
| England | 886 | 0.1% |
| Ethiopia | 33 | 0.0% |
| Europe | 8,080 | 1.3% |
| France | 315 | 0.1% |
| Germany | 1,197 | 0.2% |
| Ghana | 269 | 0.0% |
| Greece | 136 | 0.0% |
| Guatemala | 215 | 0.0% |
| Guyana | 8 | 0.0% |
| Haiti | 151 | 0.0% |
| Honduras | 14 | 0.0% |
| Hong Kong | 105 | 0.0% |
| Hungary | 57 | 0.0% |
| India | 1,087 | 0.2% |
| Indonesia | 40 | 0.0% |
| Iran | 170 | 0.0% |
| Iraq | 132 | 0.0% |
| Ireland | 242 | 0.0% |
| Israel | 97 | 0.0% |
| Italy | 308 | 0.1% |
| Jamaica | 520 | 0.1% |
| Japan | 150 | 0.0% |
| Jordan | 21 | 0.0% |
| Kazakhstan | 49 | 0.0% |
| Kenya | 194 | 0.0% |
| Korea | 740 | 0.1% |
| Laos | 141 | 0.0% |
| Latin America | 3,063 | 0.5% |
| Latvia | 3 | 0.0% |
| Lebanon | 26 | 0.0% |
| Liberia | 19 | 0.0% |
| Lithuania | 55 | 0.0% |
| Malaysia | 37 | 0.0% |
| Mexico | 483 | 0.1% |
| Middle Africa | 374 | 0.1% |
| Moldova | 157 | 0.0% |
| Morocco | 68 | 0.0% |
| Nepal | 902 | 0.1% |
| Netherlands | 283 | 0.0% |
| Nicaragua | 20 | 0.0% |
| Nigeria | 300 | 0.1% |
| North Macedonia | 36 | 0.0% |
| Northern Africa | 235 | 0.0% |
| Northern Europe | 2,590 | 0.4% |
| Norway | 11 | 0.0% |
| Oceania | 307 | 0.1% |
| Pakistan | 95 | 0.0% |
| Panama | 46 | 0.0% |
| Peru | 197 | 0.0% |
| Philippines | 881 | 0.1% |
| Poland | 307 | 0.1% |
| Portugal | 43 | 0.0% |
| Romania | 106 | 0.0% |
| Russia | 548 | 0.1% |
| Scotland | 158 | 0.0% |
| Senegal | 65 | 0.0% |
| Serbia | 38 | 0.0% |
| Sierra Leone | 6 | 0.0% |
| Singapore | 32 | 0.0% |
| Somalia | 235 | 0.0% |
| South Africa | 189 | 0.0% |
| South America | 1,288 | 0.2% |
| South Central Asia | 3,227 | 0.5% |
| South Eastern Asia | 2,403 | 0.4% |
| Southern Europe | 600 | 0.1% |
| Spain | 106 | 0.0% |
| Sri Lanka | 82 | 0.0% |
| Sudan | 159 | 0.0% |
| Sweden | 131 | 0.0% |
| Switzerland | 106 | 0.0% |
| Syria | 1 | 0.0% |
| Taiwan | 199 | 0.0% |
| Thailand | 309 | 0.1% |
| Trinidad and Tobago | 49 | 0.0% |
| Turkey | 197 | 0.0% |
| Uganda | 23 | 0.0% |
| Ukraine | 158 | 0.0% |
| Uruguay | 131 | 0.0% |
| Uzbekistan | 37 | 0.0% |
| Venezuela | 188 | 0.0% |
| Vietnam | 504 | 0.1% |
| Western Africa | 949 | 0.2% |
| Western Asia | 569 | 0.1% |
| Western Europe | 2,122 | 0.3% |
| Yemen | 12 | 0.0% |
| Zaire | 333 | 0.1% |
| Zimbabwe | 80 | 0.0% | View All 125 Rows |
Sex and Age in Vermont
Sex and Age in Vermont
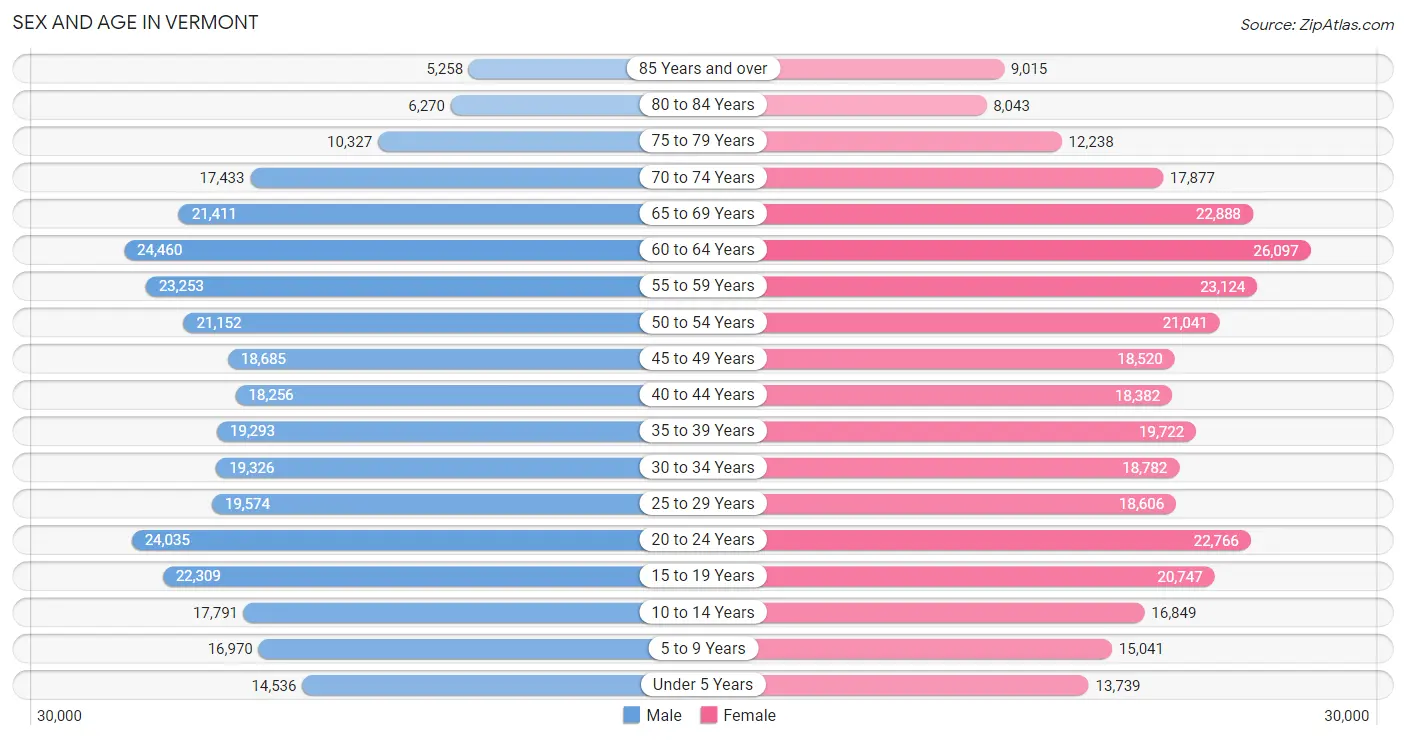
The most populous age groups in Vermont are 60 to 64 Years (24,460 | 7.6%) for men and 60 to 64 Years (26,097 | 8.1%) for women.
| Age Bracket | Male | Female |
| Under 5 Years | 14,536 (4.5%) | 13,739 (4.3%) |
| 5 to 9 Years | 16,970 (5.3%) | 15,041 (4.6%) |
| 10 to 14 Years | 17,791 (5.6%) | 16,849 (5.2%) |
| 15 to 19 Years | 22,309 (7.0%) | 20,747 (6.4%) |
| 20 to 24 Years | 24,035 (7.5%) | 22,766 (7.0%) |
| 25 to 29 Years | 19,574 (6.1%) | 18,606 (5.8%) |
| 30 to 34 Years | 19,326 (6.0%) | 18,782 (5.8%) |
| 35 to 39 Years | 19,293 (6.0%) | 19,722 (6.1%) |
| 40 to 44 Years | 18,256 (5.7%) | 18,382 (5.7%) |
| 45 to 49 Years | 18,685 (5.8%) | 18,520 (5.7%) |
| 50 to 54 Years | 21,152 (6.6%) | 21,041 (6.5%) |
| 55 to 59 Years | 23,253 (7.3%) | 23,124 (7.1%) |
| 60 to 64 Years | 24,460 (7.6%) | 26,097 (8.1%) |
| 65 to 69 Years | 21,411 (6.7%) | 22,888 (7.1%) |
| 70 to 74 Years | 17,433 (5.4%) | 17,877 (5.5%) |
| 75 to 79 Years | 10,327 (3.2%) | 12,238 (3.8%) |
| 80 to 84 Years | 6,270 (2.0%) | 8,043 (2.5%) |
| 85 Years and over | 5,258 (1.6%) | 9,015 (2.8%) |
| Total | 320,339 (100.0%) | 323,477 (100.0%) |
Families and Households in Vermont
Median Family Size in Vermont
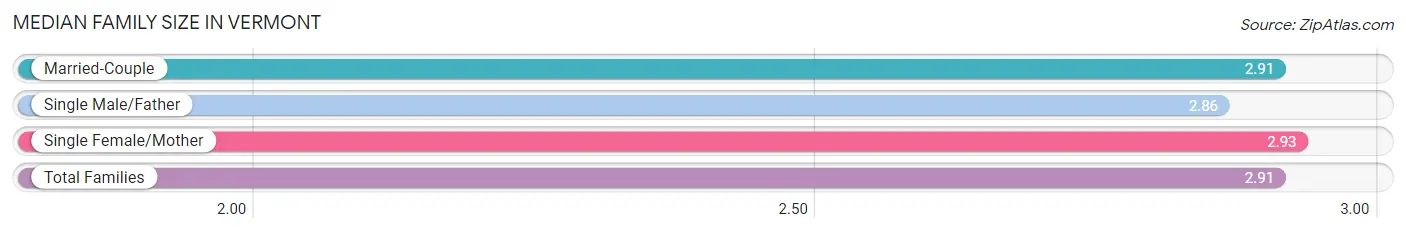
The median family size in Vermont is 2.91 persons per family, with single female/mother families (22,199 | 14.1%) accounting for the largest median family size of 2.93 persons per family. On the other hand, single male/father families (10,663 | 6.8%) represent the smallest median family size with 2.86 persons per family.
| Family Type | # Families | Family Size |
| Married-Couple | 124,656 (79.1%) | 2.91 |
| Single Male/Father | 10,663 (6.8%) | 2.86 |
| Single Female/Mother | 22,199 (14.1%) | 2.93 |
| Total Families | 157,518 (100.0%) | 2.91 |
Median Household Size in Vermont
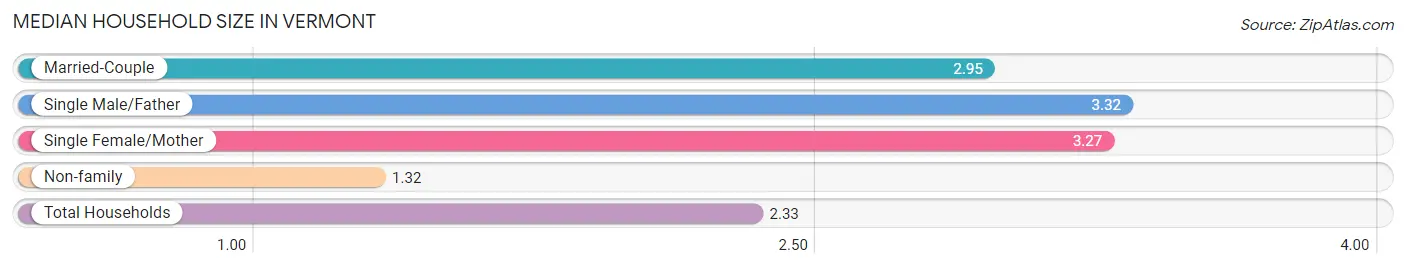
The median household size in Vermont is 2.33 persons per household, with single male/father households (10,663 | 4.0%) accounting for the largest median household size of 3.32 persons per household. non-family households (108,340 | 40.7%) represent the smallest median household size with 1.32 persons per household.
| Household Type | # Households | Household Size |
| Married-Couple | 124,656 (46.9%) | 2.95 |
| Single Male/Father | 10,663 (4.0%) | 3.32 |
| Single Female/Mother | 22,199 (8.4%) | 3.27 |
| Non-family | 108,340 (40.7%) | 1.32 |
| Total Households | 265,858 (100.0%) | 2.33 |
Household Size by Marriage Status in Vermont
Out of a total of 265,858 households in Vermont, 157,518 (59.3%) are family households, while 108,340 (40.7%) are nonfamily households. The most numerous type of family households are 2-person households, comprising 83,055, and the most common type of nonfamily households are 1-person households, comprising 82,446.
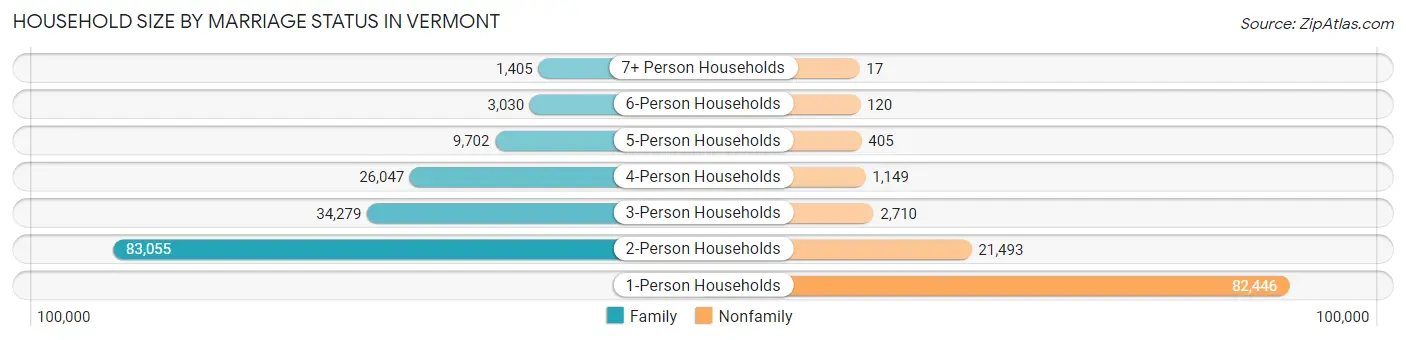
| Household Size | Family Households | Nonfamily Households |
| 1-Person Households | - | 82,446 (31.0%) |
| 2-Person Households | 83,055 (31.2%) | 21,493 (8.1%) |
| 3-Person Households | 34,279 (12.9%) | 2,710 (1.0%) |
| 4-Person Households | 26,047 (9.8%) | 1,149 (0.4%) |
| 5-Person Households | 9,702 (3.6%) | 405 (0.2%) |
| 6-Person Households | 3,030 (1.1%) | 120 (0.1%) |
| 7+ Person Households | 1,405 (0.5%) | 17 (0.0%) |
| Total | 157,518 (59.3%) | 108,340 (40.7%) |
Female Fertility in Vermont
Fertility by Age in Vermont
Average fertility rate in Vermont is 42.0 births per 1,000 women. Women in the age bracket of 20 to 34 years have the highest fertility rate with 71.0 births per 1,000 women. Women in the age bracket of 20 to 34 years acount for 71.3% of all women with births.
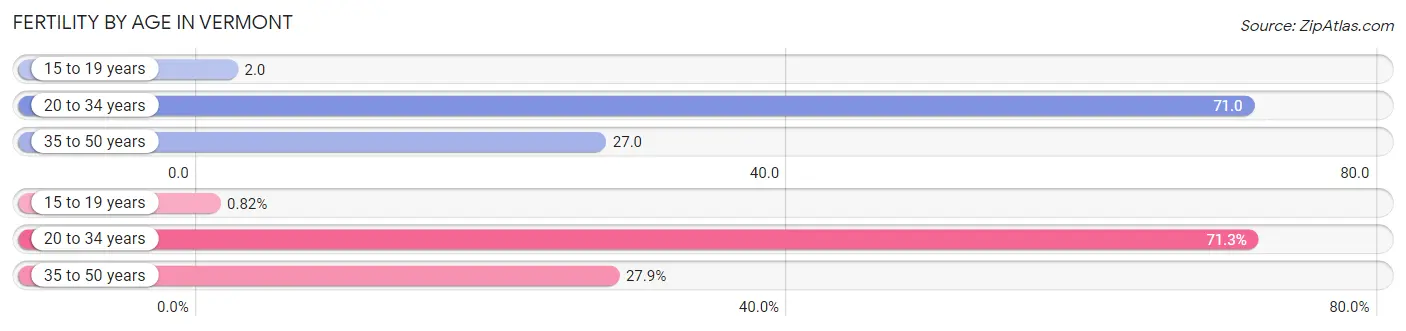
| Age Bracket | Women with Births | Births / 1,000 Women |
| 15 to 19 years | 49 (0.8%) | 2.0 |
| 20 to 34 years | 4,249 (71.3%) | 71.0 |
| 35 to 50 years | 1,662 (27.9%) | 27.0 |
| Total | 5,960 (100.0%) | 42.0 |
Fertility by Age by Marriage Status in Vermont
72.2% of women with births (5,960) in Vermont are married. The highest percentage of unmarried women with births falls into 15 to 19 years age bracket with 100.0% of them unmarried at the time of birth, while the lowest percentage of unmarried women with births belong to 35 to 50 years age bracket with 17.6% of them unmarried.
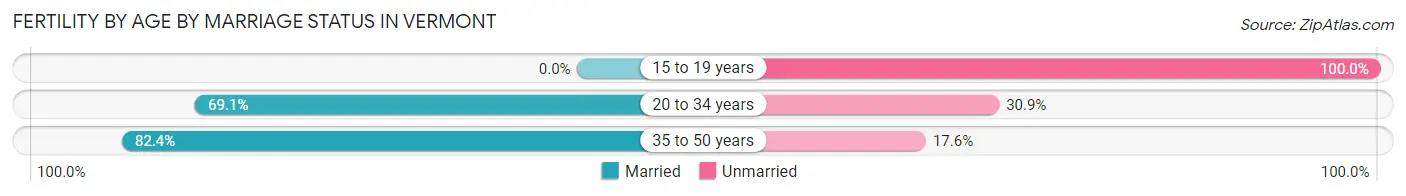
| Age Bracket | Married | Unmarried |
| 15 to 19 years | 0 (0.0%) | 49 (100.0%) |
| 20 to 34 years | 2,936 (69.1%) | 1,313 (30.9%) |
| 35 to 50 years | 1,369 (82.4%) | 293 (17.6%) |
| Total | 4,303 (72.2%) | 1,657 (27.8%) |
Fertility by Education in Vermont
Average fertility rate in Vermont is 42.0 births per 1,000 women. Women with the education attainment of high school diploma have the highest fertility rate of 54.0 births per 1,000 women, while women with the education attainment of less than high school have the lowest fertility at 23.0 births per 1,000 women. Women with the education attainment of bachelor's degree represent 27.8% of all women with births.
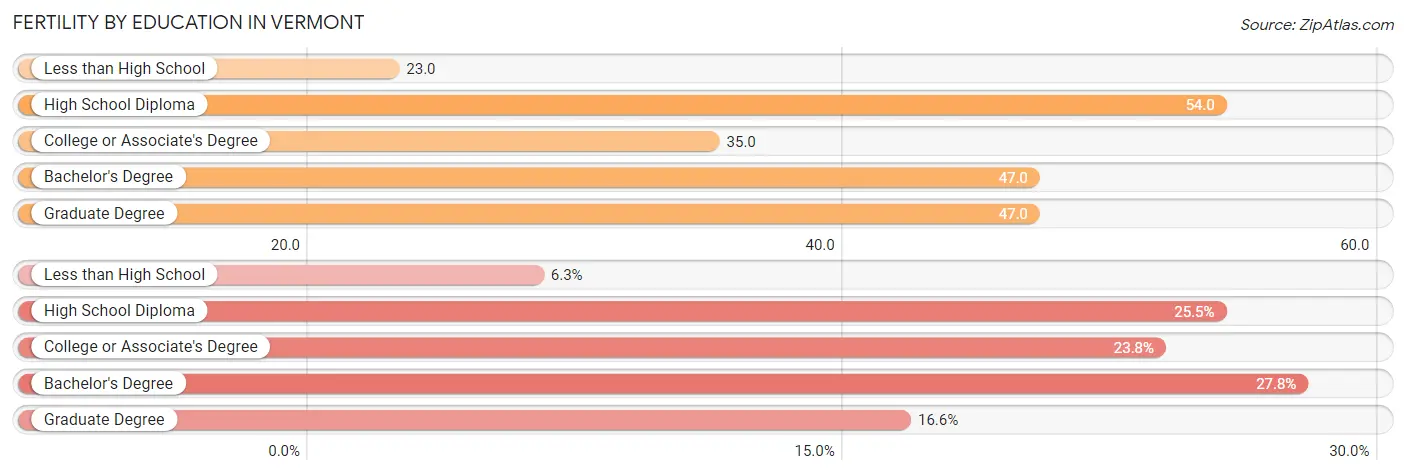
| Educational Attainment | Women with Births | Births / 1,000 Women |
| Less than High School | 376 (6.3%) | 23.0 |
| High School Diploma | 1,519 (25.5%) | 54.0 |
| College or Associate's Degree | 1,418 (23.8%) | 35.0 |
| Bachelor's Degree | 1,656 (27.8%) | 47.0 |
| Graduate Degree | 991 (16.6%) | 47.0 |
| Total | 5,960 (100.0%) | 42.0 |
Fertility by Education by Marriage Status in Vermont
27.8% of women with births in Vermont are unmarried. Women with the educational attainment of bachelor's degree are most likely to be married with 93.7% of them married at childbirth, while women with the educational attainment of high school diploma are least likely to be married with 57.1% of them unmarried at childbirth.
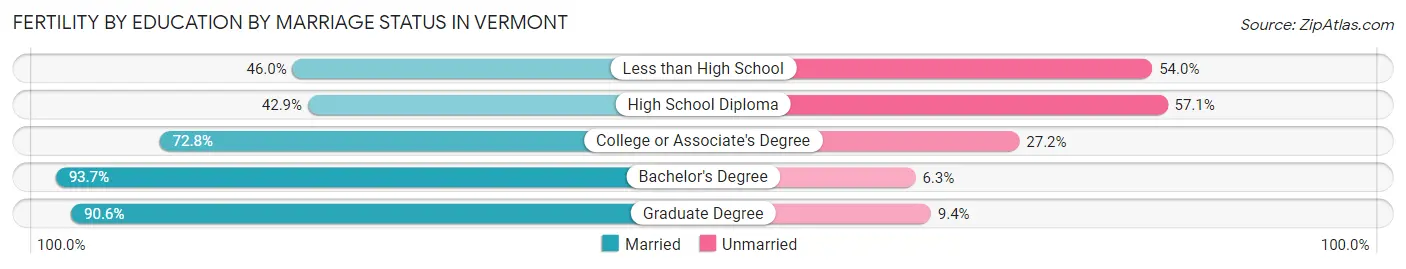
| Educational Attainment | Married | Unmarried |
| Less than High School | 173 (46.0%) | 203 (54.0%) |
| High School Diploma | 652 (42.9%) | 867 (57.1%) |
| College or Associate's Degree | 1,032 (72.8%) | 386 (27.2%) |
| Bachelor's Degree | 1,552 (93.7%) | 104 (6.3%) |
| Graduate Degree | 898 (90.6%) | 93 (9.4%) |
| Total | 4,303 (72.2%) | 1,657 (27.8%) |
Employment Characteristics in Vermont
Employment by Class of Employer in Vermont
Among the 330,614 employed individuals in Vermont, private company employees (183,138 | 55.4%), not-for-profit organizations (53,949 | 16.3%), and self-employed (not incorporated) (27,525 | 8.3%) make up the most common classes of employment.
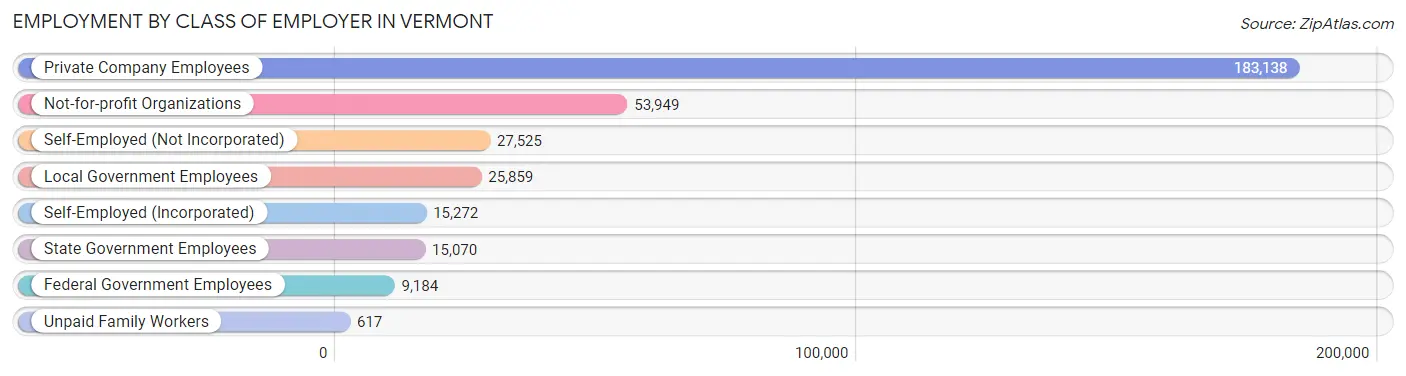
| Employer Class | # Employees | % Employees |
| Private Company Employees | 183,138 | 55.4% |
| Self-Employed (Incorporated) | 15,272 | 4.6% |
| Self-Employed (Not Incorporated) | 27,525 | 8.3% |
| Not-for-profit Organizations | 53,949 | 16.3% |
| Local Government Employees | 25,859 | 7.8% |
| State Government Employees | 15,070 | 4.6% |
| Federal Government Employees | 9,184 | 2.8% |
| Unpaid Family Workers | 617 | 0.2% |
| Total | 330,614 | 100.0% |
Employment Status by Age in Vermont
According to the labor force statistics for Vermont, out of the total population over 16 years of age (541,949), 64.9% or 351,725 individuals are in the labor force, with 3.8% or 13,366 of them unemployed. The age group with the highest labor force participation rate is 25 to 29 years, with 86.6% or 33,064 individuals in the labor force. Within the labor force, the 16 to 19 years age range has the highest percentage of unemployed individuals, with 9.5% or 1,561 of them being unemployed.
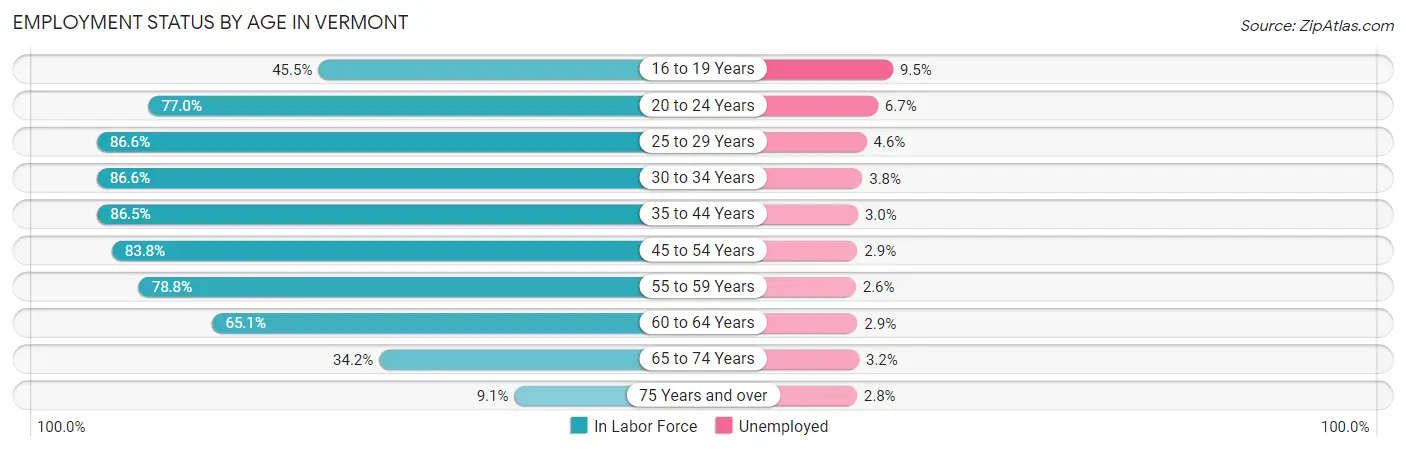
| Age Bracket | In Labor Force | Unemployed |
| 16 to 19 Years | 16,432 (45.5%) | 1,561 (9.5%) |
| 20 to 24 Years | 36,037 (77.0%) | 2,414 (6.7%) |
| 25 to 29 Years | 33,064 (86.6%) | 1,521 (4.6%) |
| 30 to 34 Years | 33,002 (86.6%) | 1,254 (3.8%) |
| 35 to 44 Years | 65,440 (86.5%) | 1,963 (3.0%) |
| 45 to 54 Years | 66,536 (83.8%) | 1,930 (2.9%) |
| 55 to 59 Years | 36,545 (78.8%) | 950 (2.6%) |
| 60 to 64 Years | 32,913 (65.1%) | 954 (2.9%) |
| 65 to 74 Years | 27,226 (34.2%) | 871 (3.2%) |
| 75 Years and over | 4,655 (9.1%) | 130 (2.8%) |
| Total | 351,725 (64.9%) | 13,366 (3.8%) |
Employment Status by Educational Attainment in Vermont
According to labor force statistics for Vermont, 81.5% of individuals (267,542) out of the total population between 25 and 64 years of age (328,273) are in the labor force, with 3.2% or 8,561 of them being unemployed. The group with the highest labor force participation rate are those with the educational attainment of bachelor's degree or higher, with 89.0% or 124,645 individuals in the labor force. Within the labor force, individuals with less than high school education have the highest percentage of unemployment, with 10.2% or 987 of them being unemployed.
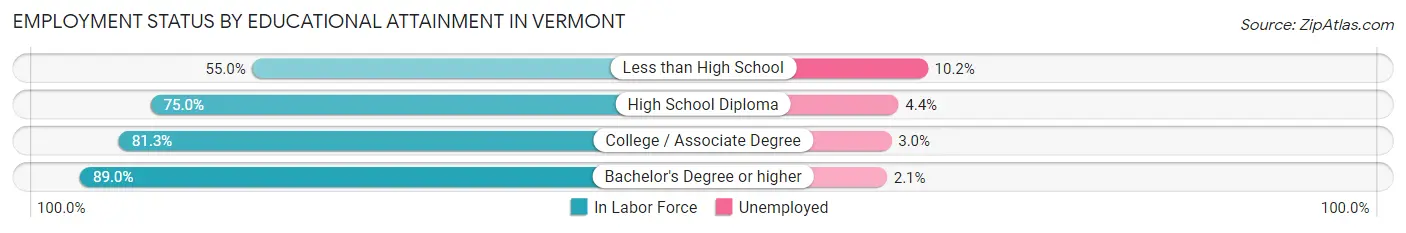
| Educational Attainment | In Labor Force | Unemployed |
| Less than High School | 9,677 (55.0%) | 1,795 (10.2%) |
| High School Diploma | 66,254 (75.0%) | 3,887 (4.4%) |
| College / Associate Degree | 66,902 (81.3%) | 2,469 (3.0%) |
| Bachelor's Degree or higher | 124,645 (89.0%) | 2,941 (2.1%) |
| Total | 267,542 (81.5%) | 10,505 (3.2%) |
Employment Occupations by Sex in Vermont
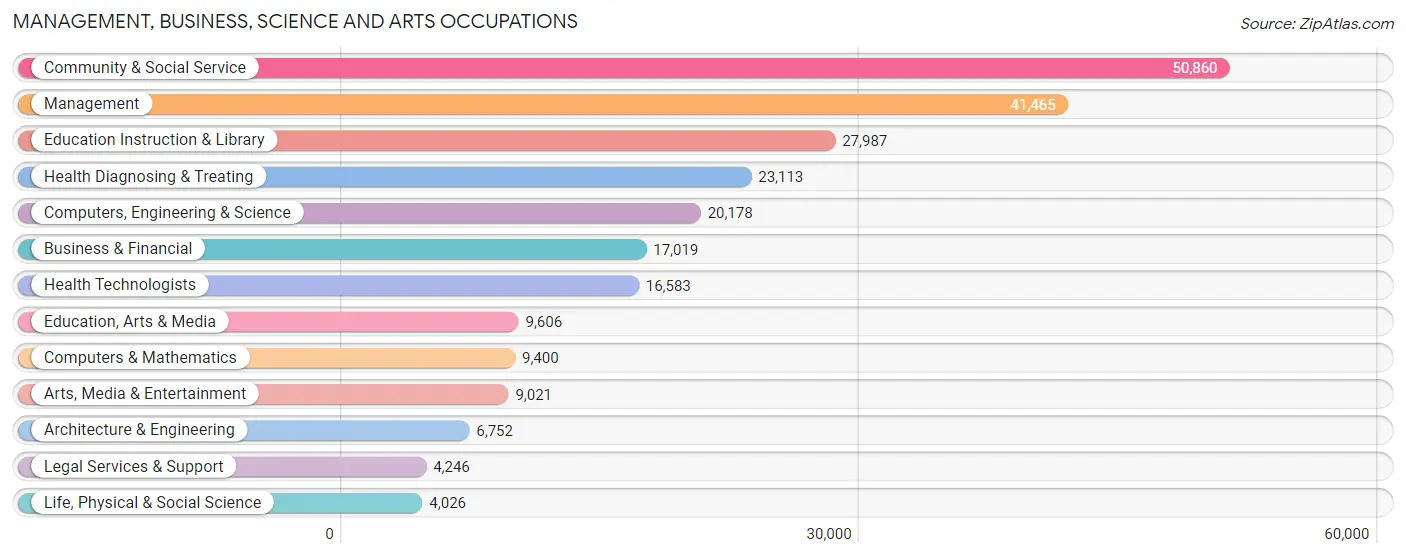
Management, Business, Science and Arts Occupations
The most common Management, Business, Science and Arts occupations in Vermont are Community & Social Service (50,860 | 15.1%), Management (41,465 | 12.3%), Education Instruction & Library (27,987 | 8.3%), Health Diagnosing & Treating (23,113 | 6.9%), and Computers, Engineering & Science (20,178 | 6.0%).
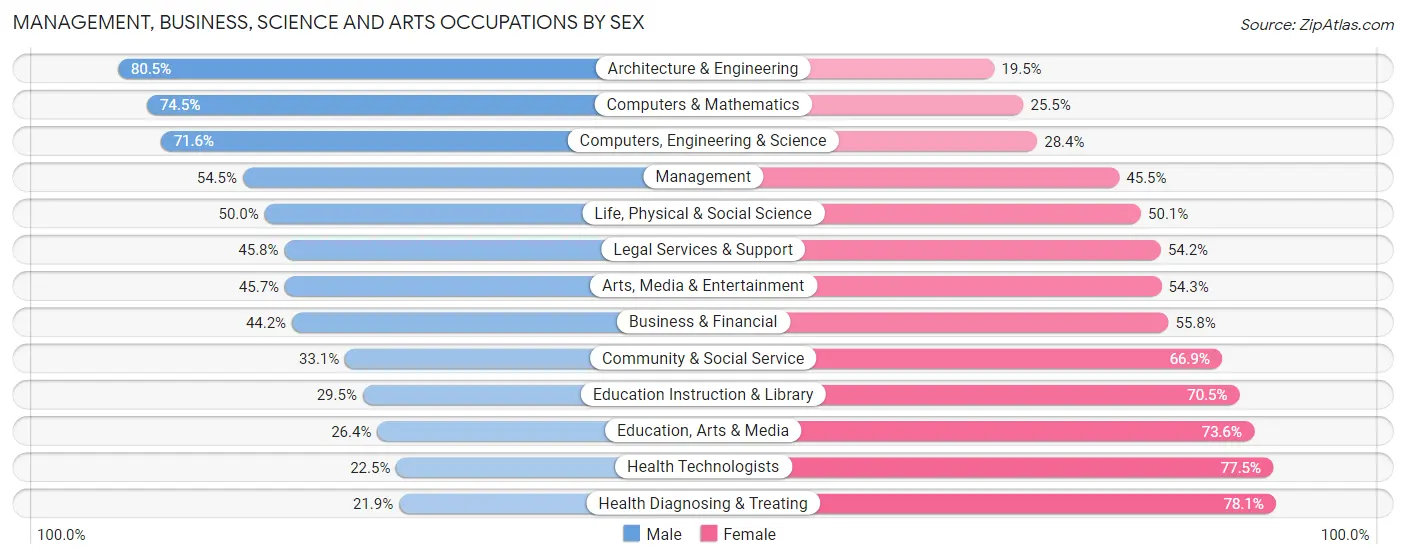
Management, Business, Science and Arts Occupations by Sex
Within the Management, Business, Science and Arts occupations in Vermont, the most male-oriented occupations are Architecture & Engineering (80.5%), Computers & Mathematics (74.5%), and Computers, Engineering & Science (71.6%), while the most female-oriented occupations are Health Diagnosing & Treating (78.1%), Health Technologists (77.5%), and Education, Arts & Media (73.6%).
| Occupation | Male | Female |
| Management | 22,590 (54.5%) | 18,875 (45.5%) |
| Business & Financial | 7,527 (44.2%) | 9,492 (55.8%) |
| Computers, Engineering & Science | 14,448 (71.6%) | 5,730 (28.4%) |
| Computers & Mathematics | 6,999 (74.5%) | 2,401 (25.5%) |
| Architecture & Engineering | 5,438 (80.5%) | 1,314 (19.5%) |
| Life, Physical & Social Science | 2,011 (49.9%) | 2,015 (50.0%) |
| Community & Social Service | 16,854 (33.1%) | 34,006 (66.9%) |
| Education, Arts & Media | 2,540 (26.4%) | 7,066 (73.6%) |
| Legal Services & Support | 1,945 (45.8%) | 2,301 (54.2%) |
| Education Instruction & Library | 8,246 (29.5%) | 19,741 (70.5%) |
| Arts, Media & Entertainment | 4,123 (45.7%) | 4,898 (54.3%) |
| Health Diagnosing & Treating | 5,058 (21.9%) | 18,055 (78.1%) |
| Health Technologists | 3,727 (22.5%) | 12,856 (77.5%) |
| Total (Category) | 66,477 (43.5%) | 86,158 (56.5%) |
| Total (Overall) | 171,500 (50.9%) | 165,711 (49.1%) |
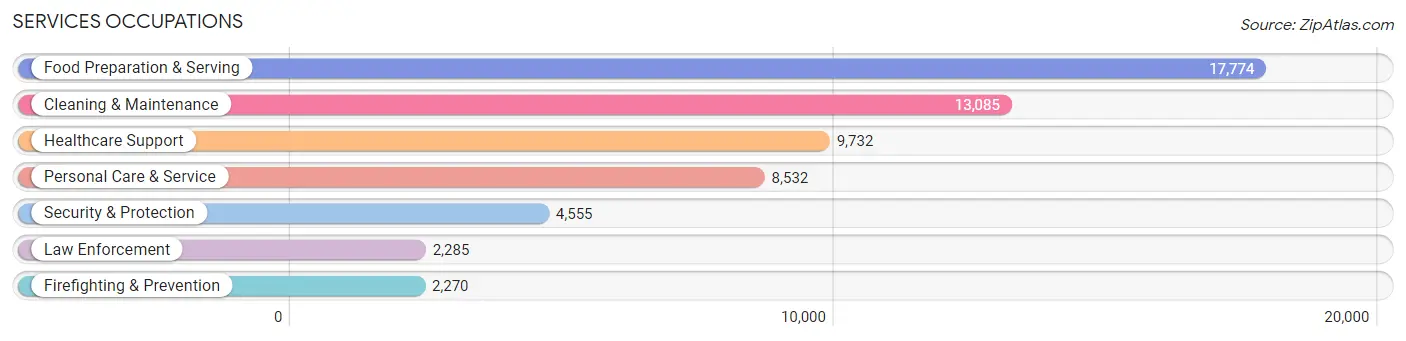
Services Occupations
The most common Services occupations in Vermont are Food Preparation & Serving (17,774 | 5.3%), Cleaning & Maintenance (13,085 | 3.9%), Healthcare Support (9,732 | 2.9%), Personal Care & Service (8,532 | 2.5%), and Security & Protection (4,555 | 1.3%).
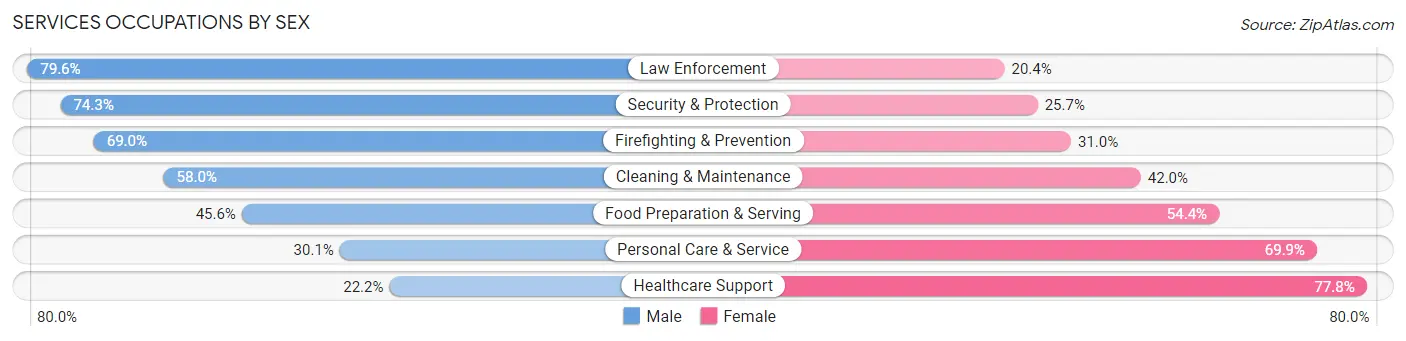
Services Occupations by Sex
Within the Services occupations in Vermont, the most male-oriented occupations are Law Enforcement (79.6%), Security & Protection (74.3%), and Firefighting & Prevention (69.0%), while the most female-oriented occupations are Healthcare Support (77.8%), Personal Care & Service (69.9%), and Food Preparation & Serving (54.4%).
| Occupation | Male | Female |
| Healthcare Support | 2,163 (22.2%) | 7,569 (77.8%) |
| Security & Protection | 3,385 (74.3%) | 1,170 (25.7%) |
| Firefighting & Prevention | 1,567 (69.0%) | 703 (31.0%) |
| Law Enforcement | 1,818 (79.6%) | 467 (20.4%) |
| Food Preparation & Serving | 8,107 (45.6%) | 9,667 (54.4%) |
| Cleaning & Maintenance | 7,586 (58.0%) | 5,499 (42.0%) |
| Personal Care & Service | 2,567 (30.1%) | 5,965 (69.9%) |
| Total (Category) | 23,808 (44.4%) | 29,870 (55.6%) |
| Total (Overall) | 171,500 (50.9%) | 165,711 (49.1%) |
Sales and Office Occupations
The most common Sales and Office occupations in Vermont are Office & Administration (33,210 | 9.9%), and Sales & Related (27,818 | 8.3%).
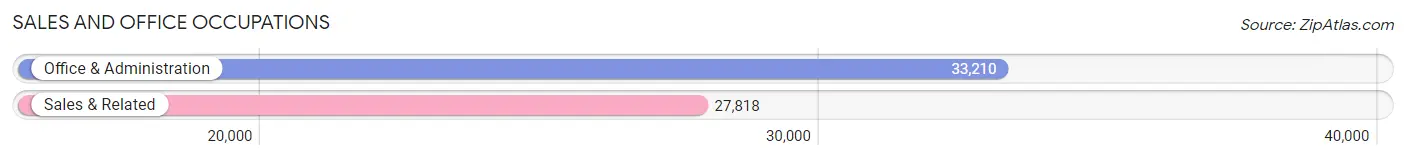
Sales and Office Occupations by Sex

| Occupation | Male | Female |
| Sales & Related | 13,751 (49.4%) | 14,067 (50.6%) |
| Office & Administration | 8,504 (25.6%) | 24,706 (74.4%) |
| Total (Category) | 22,255 (36.5%) | 38,773 (63.5%) |
| Total (Overall) | 171,500 (50.9%) | 165,711 (49.1%) |
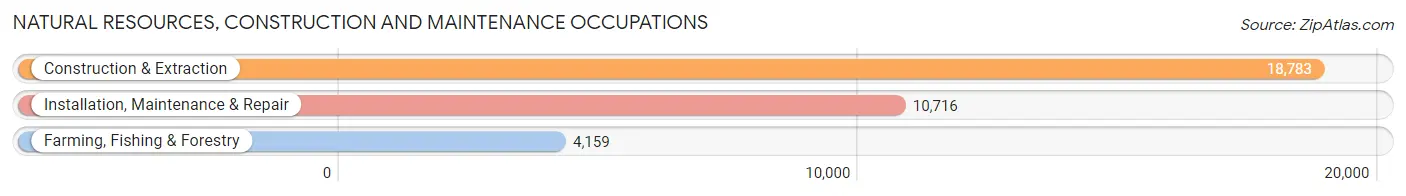
Natural Resources, Construction and Maintenance Occupations
The most common Natural Resources, Construction and Maintenance occupations in Vermont are Construction & Extraction (18,783 | 5.6%), Installation, Maintenance & Repair (10,716 | 3.2%), and Farming, Fishing & Forestry (4,159 | 1.2%).
Natural Resources, Construction and Maintenance Occupations by Sex
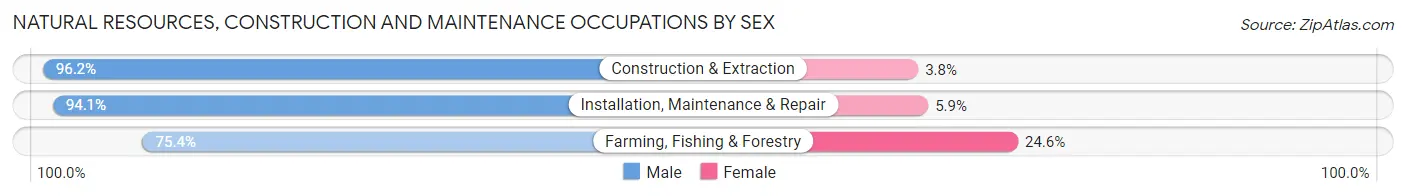
| Occupation | Male | Female |
| Farming, Fishing & Forestry | 3,137 (75.4%) | 1,022 (24.6%) |
| Construction & Extraction | 18,070 (96.2%) | 713 (3.8%) |
| Installation, Maintenance & Repair | 10,085 (94.1%) | 631 (5.9%) |
| Total (Category) | 31,292 (93.0%) | 2,366 (7.0%) |
| Total (Overall) | 171,500 (50.9%) | 165,711 (49.1%) |
Production, Transportation and Moving Occupations
The most common Production, Transportation and Moving occupations in Vermont are Production (19,477 | 5.8%), Transportation (8,994 | 2.7%), and Material Moving (7,741 | 2.3%).
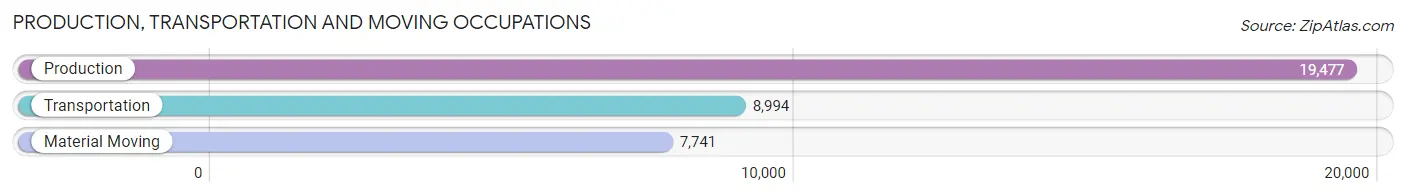
Production, Transportation and Moving Occupations by Sex
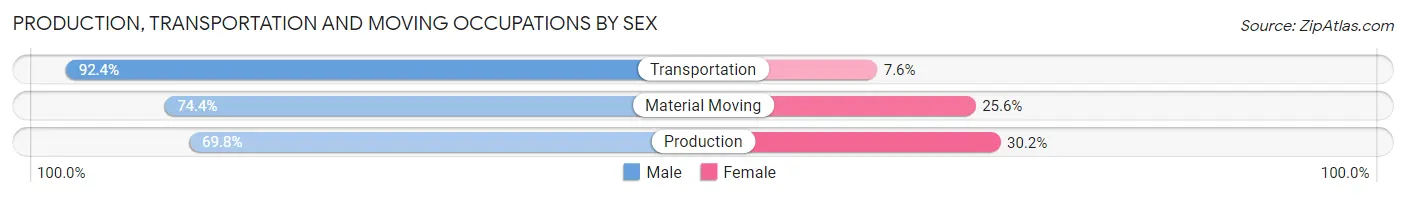
| Occupation | Male | Female |
| Production | 13,597 (69.8%) | 5,880 (30.2%) |
| Transportation | 8,313 (92.4%) | 681 (7.6%) |
| Material Moving | 5,758 (74.4%) | 1,983 (25.6%) |
| Total (Category) | 27,668 (76.4%) | 8,544 (23.6%) |
| Total (Overall) | 171,500 (50.9%) | 165,711 (49.1%) |
Employment Industries by Sex in Vermont
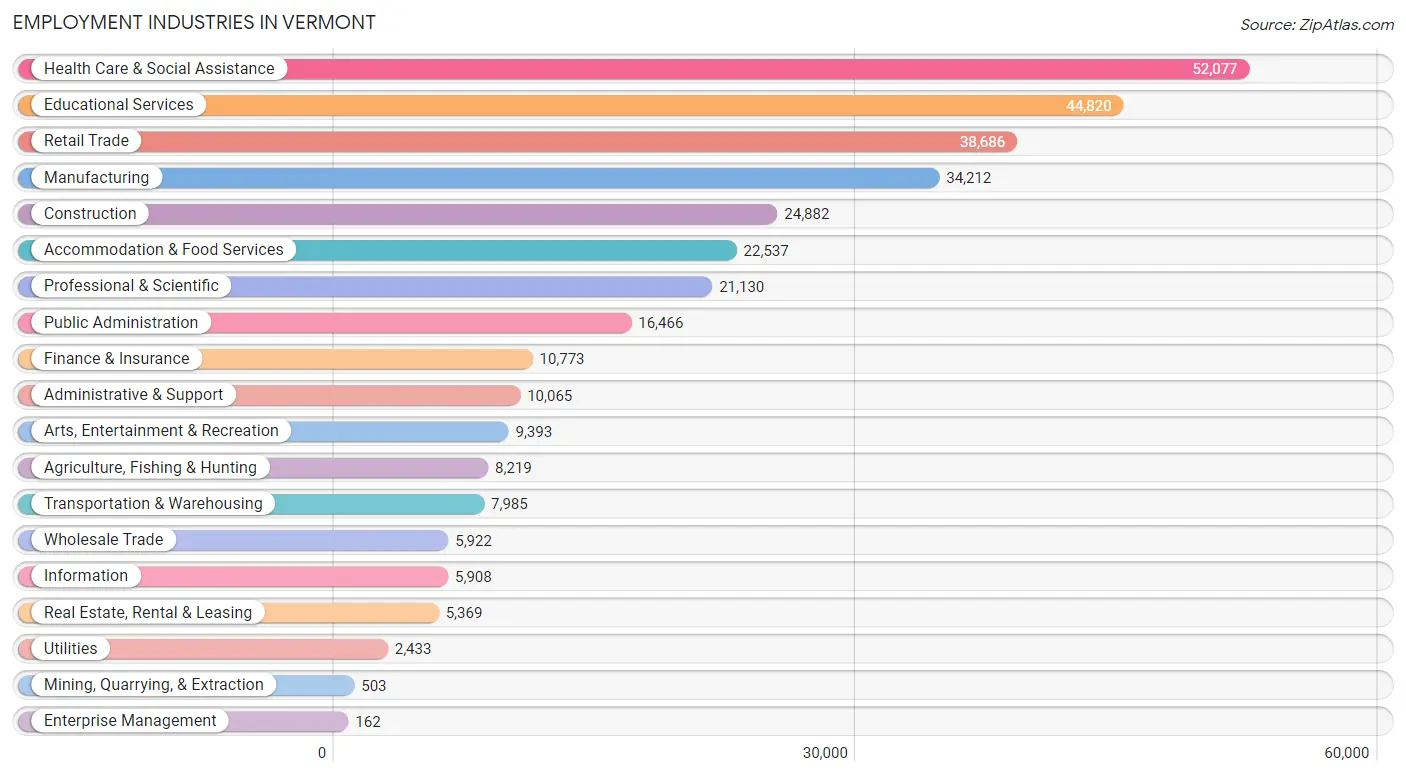
Employment Industries in Vermont
The major employment industries in Vermont include Health Care & Social Assistance (52,077 | 15.4%), Educational Services (44,820 | 13.3%), Retail Trade (38,686 | 11.5%), Manufacturing (34,212 | 10.2%), and Construction (24,882 | 7.4%).
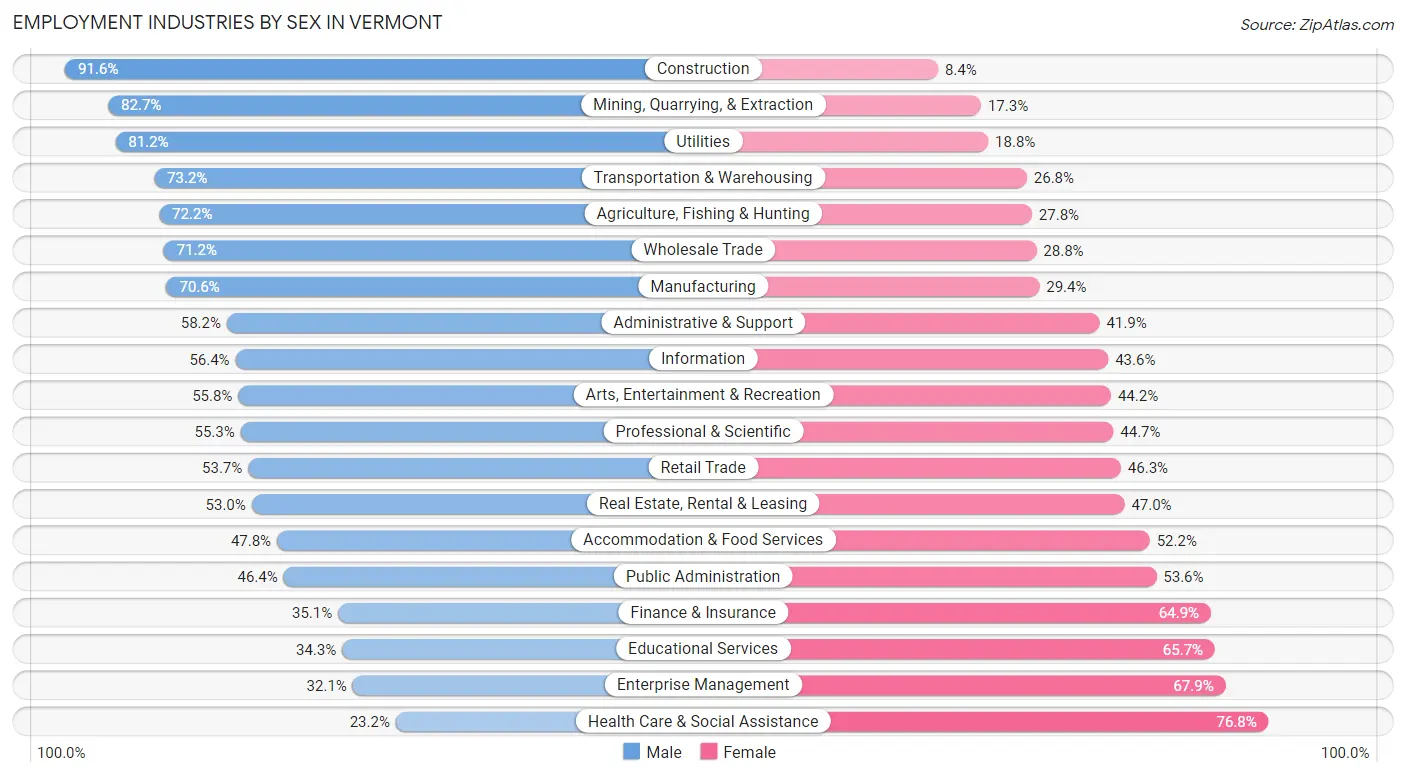
Employment Industries by Sex in Vermont
The Vermont industries that see more men than women are Construction (91.6%), Mining, Quarrying, & Extraction (82.7%), and Utilities (81.2%), whereas the industries that tend to have a higher number of women are Health Care & Social Assistance (76.8%), Enterprise Management (67.9%), and Educational Services (65.7%).
| Industry | Male | Female |
| Agriculture, Fishing & Hunting | 5,931 (72.2%) | 2,288 (27.8%) |
| Mining, Quarrying, & Extraction | 416 (82.7%) | 87 (17.3%) |
| Construction | 22,795 (91.6%) | 2,087 (8.4%) |
| Manufacturing | 24,167 (70.6%) | 10,045 (29.4%) |
| Wholesale Trade | 4,218 (71.2%) | 1,704 (28.8%) |
| Retail Trade | 20,789 (53.7%) | 17,897 (46.3%) |
| Transportation & Warehousing | 5,846 (73.2%) | 2,139 (26.8%) |
| Utilities | 1,976 (81.2%) | 457 (18.8%) |
| Information | 3,330 (56.4%) | 2,578 (43.6%) |
| Finance & Insurance | 3,783 (35.1%) | 6,990 (64.9%) |
| Real Estate, Rental & Leasing | 2,846 (53.0%) | 2,523 (47.0%) |
| Professional & Scientific | 11,684 (55.3%) | 9,446 (44.7%) |
| Enterprise Management | 52 (32.1%) | 110 (67.9%) |
| Administrative & Support | 5,853 (58.2%) | 4,212 (41.8%) |
| Educational Services | 15,369 (34.3%) | 29,451 (65.7%) |
| Health Care & Social Assistance | 12,069 (23.2%) | 40,008 (76.8%) |
| Arts, Entertainment & Recreation | 5,240 (55.8%) | 4,153 (44.2%) |
| Accommodation & Food Services | 10,767 (47.8%) | 11,770 (52.2%) |
| Public Administration | 7,640 (46.4%) | 8,826 (53.6%) |
| Total | 171,500 (50.9%) | 165,711 (49.1%) |
Education in Vermont
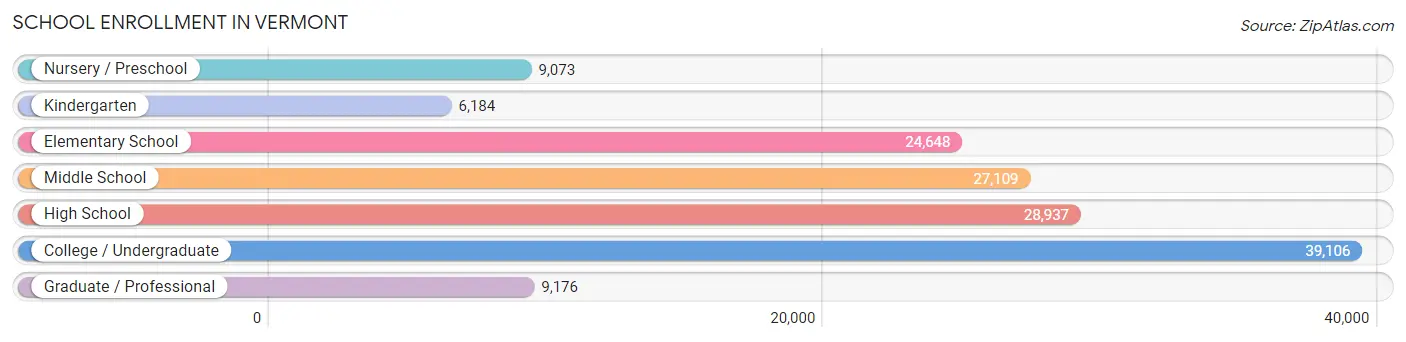
School Enrollment in Vermont
The most common levels of schooling among the 144,233 students in Vermont are college / undergraduate (39,106 | 27.1%), high school (28,937 | 20.1%), and middle school (27,109 | 18.8%).
| School Level | # Students | % Students |
| Nursery / Preschool | 9,073 | 6.3% |
| Kindergarten | 6,184 | 4.3% |
| Elementary School | 24,648 | 17.1% |
| Middle School | 27,109 | 18.8% |
| High School | 28,937 | 20.1% |
| College / Undergraduate | 39,106 | 27.1% |
| Graduate / Professional | 9,176 | 6.4% |
| Total | 144,233 | 100.0% |
School Enrollment by Age by Funding Source in Vermont
Out of a total of 144,233 students who are enrolled in schools in Vermont, 30,000 (20.8%) attend a private institution, while the remaining 114,233 (79.2%) are enrolled in public schools. The age group of 35 years and over has the highest likelihood of being enrolled in private schools, with 2,610 (36.9% in the age bracket) enrolled. Conversely, the age group of 10 to 14 year olds has the lowest likelihood of being enrolled in a private school, with 29,575 (88.6% in the age bracket) attending a public institution.
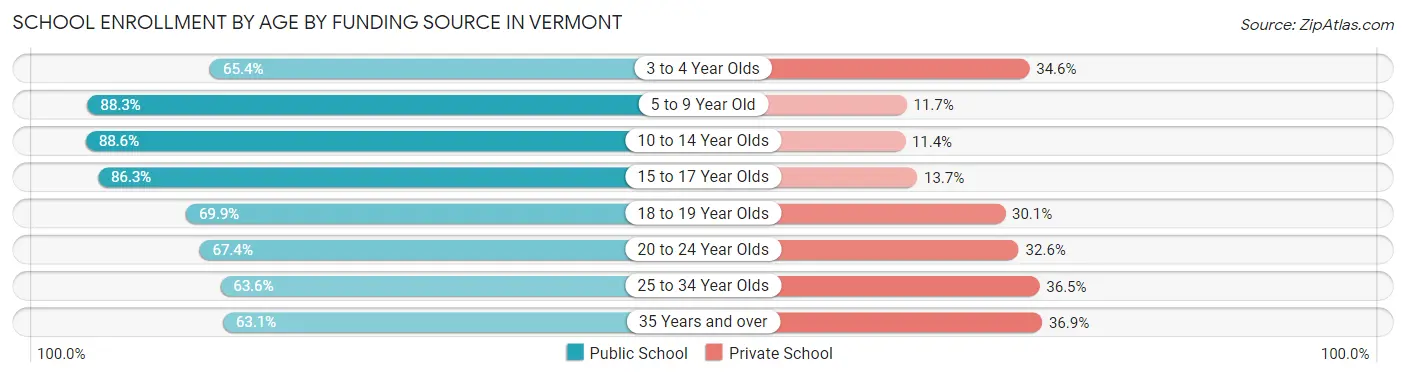
| Age Bracket | Public School | Private School |
| 3 to 4 Year Olds | 4,493 (65.4%) | 2,374 (34.6%) |
| 5 to 9 Year Old | 26,528 (88.3%) | 3,518 (11.7%) |
| 10 to 14 Year Olds | 29,575 (88.6%) | 3,810 (11.4%) |
| 15 to 17 Year Olds | 18,156 (86.3%) | 2,875 (13.7%) |
| 18 to 19 Year Olds | 11,996 (69.9%) | 5,157 (30.1%) |
| 20 to 24 Year Olds | 14,038 (67.4%) | 6,786 (32.6%) |
| 25 to 34 Year Olds | 4,996 (63.5%) | 2,866 (36.4%) |
| 35 Years and over | 4,455 (63.1%) | 2,610 (36.9%) |
| Total | 114,233 (79.2%) | 30,000 (20.8%) |
Educational Attainment by Field of Study in Vermont
Education (25,121 | 11.9%), business (22,816 | 10.8%), social sciences (21,430 | 10.2%), bio, nature & agricultural (18,697 | 8.8%), and science & technology (18,310 | 8.7%) are the most common fields of study among 211,223 individuals in Vermont who have obtained a bachelor's degree or higher.
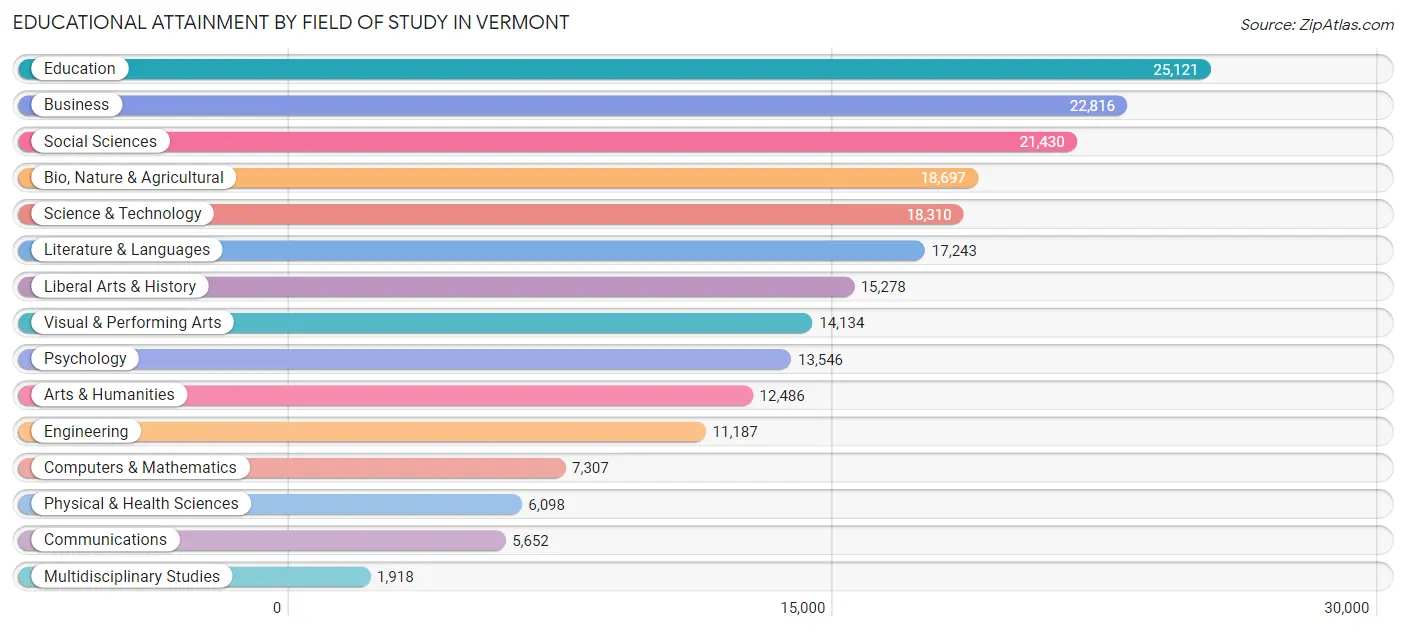
| Field of Study | # Graduates | % Graduates |
| Computers & Mathematics | 7,307 | 3.5% |
| Bio, Nature & Agricultural | 18,697 | 8.8% |
| Physical & Health Sciences | 6,098 | 2.9% |
| Psychology | 13,546 | 6.4% |
| Social Sciences | 21,430 | 10.2% |
| Engineering | 11,187 | 5.3% |
| Multidisciplinary Studies | 1,918 | 0.9% |
| Science & Technology | 18,310 | 8.7% |
| Business | 22,816 | 10.8% |
| Education | 25,121 | 11.9% |
| Literature & Languages | 17,243 | 8.2% |
| Liberal Arts & History | 15,278 | 7.2% |
| Visual & Performing Arts | 14,134 | 6.7% |
| Communications | 5,652 | 2.7% |
| Arts & Humanities | 12,486 | 5.9% |
| Total | 211,223 | 100.0% |
Transportation & Commute in Vermont
Vehicle Availability by Sex in Vermont
The most prevalent vehicle ownership categories in Vermont are males with 2 vehicles (79,637, accounting for 47.9%) and females with 2 vehicles (73,992, making up 50.4%).
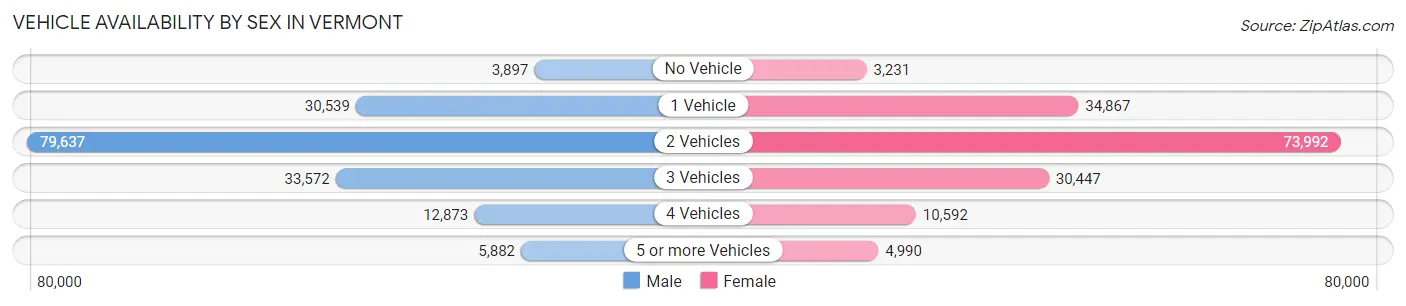
| Vehicles Available | Male | Female |
| No Vehicle | 3,897 (2.3%) | 3,231 (2.0%) |
| 1 Vehicle | 30,539 (18.3%) | 34,867 (22.1%) |
| 2 Vehicles | 79,637 (47.9%) | 73,992 (46.8%) |
| 3 Vehicles | 33,572 (20.2%) | 30,447 (19.3%) |
| 4 Vehicles | 12,873 (7.7%) | 10,592 (6.7%) |
| 5 or more Vehicles | 5,882 (3.5%) | 4,990 (3.2%) |
| Total | 166,400 (100.0%) | 158,119 (100.0%) |
Commute Time in Vermont
The most frequently occuring commute durations in Vermont are 15 to 19 minutes (45,027 commuters, 15.7%), 10 to 14 minutes (42,130 commuters, 14.7%), and 20 to 24 minutes (40,726 commuters, 14.2%).
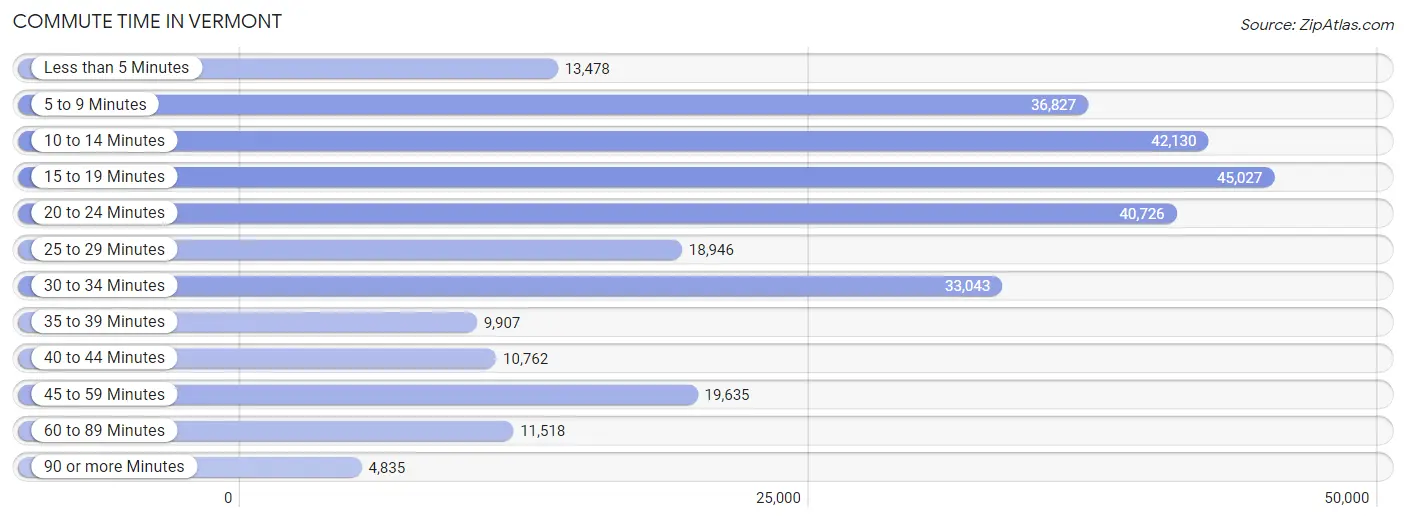
| Commute Time | # Commuters | % Commuters |
| Less than 5 Minutes | 13,478 | 4.7% |
| 5 to 9 Minutes | 36,827 | 12.8% |
| 10 to 14 Minutes | 42,130 | 14.7% |
| 15 to 19 Minutes | 45,027 | 15.7% |
| 20 to 24 Minutes | 40,726 | 14.2% |
| 25 to 29 Minutes | 18,946 | 6.6% |
| 30 to 34 Minutes | 33,043 | 11.5% |
| 35 to 39 Minutes | 9,907 | 3.5% |
| 40 to 44 Minutes | 10,762 | 3.7% |
| 45 to 59 Minutes | 19,635 | 6.9% |
| 60 to 89 Minutes | 11,518 | 4.0% |
| 90 or more Minutes | 4,835 | 1.7% |
Commute Time by Sex in Vermont
The most common commute times in Vermont are 15 to 19 minutes (22,973 commuters, 15.5%) for males and 15 to 19 minutes (22,054 commuters, 15.9%) for females.
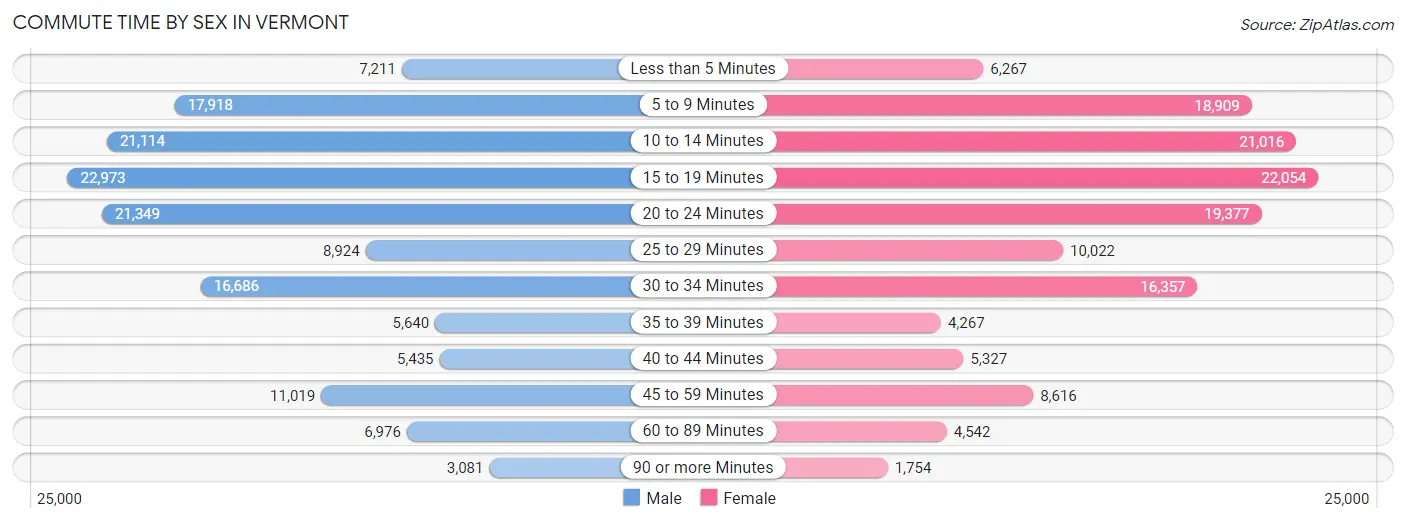
| Commute Time | Male | Female |
| Less than 5 Minutes | 7,211 (4.9%) | 6,267 (4.5%) |
| 5 to 9 Minutes | 17,918 (12.1%) | 18,909 (13.7%) |
| 10 to 14 Minutes | 21,114 (14.2%) | 21,016 (15.2%) |
| 15 to 19 Minutes | 22,973 (15.5%) | 22,054 (15.9%) |
| 20 to 24 Minutes | 21,349 (14.4%) | 19,377 (14.0%) |
| 25 to 29 Minutes | 8,924 (6.0%) | 10,022 (7.2%) |
| 30 to 34 Minutes | 16,686 (11.3%) | 16,357 (11.8%) |
| 35 to 39 Minutes | 5,640 (3.8%) | 4,267 (3.1%) |
| 40 to 44 Minutes | 5,435 (3.7%) | 5,327 (3.8%) |
| 45 to 59 Minutes | 11,019 (7.4%) | 8,616 (6.2%) |
| 60 to 89 Minutes | 6,976 (4.7%) | 4,542 (3.3%) |
| 90 or more Minutes | 3,081 (2.1%) | 1,754 (1.3%) |
Time of Departure to Work by Sex in Vermont
The most frequent times of departure to work in Vermont are 7:00 AM to 7:29 AM (22,458, 15.1%) for males and 7:00 AM to 7:29 AM (24,878, 18.0%) for females.
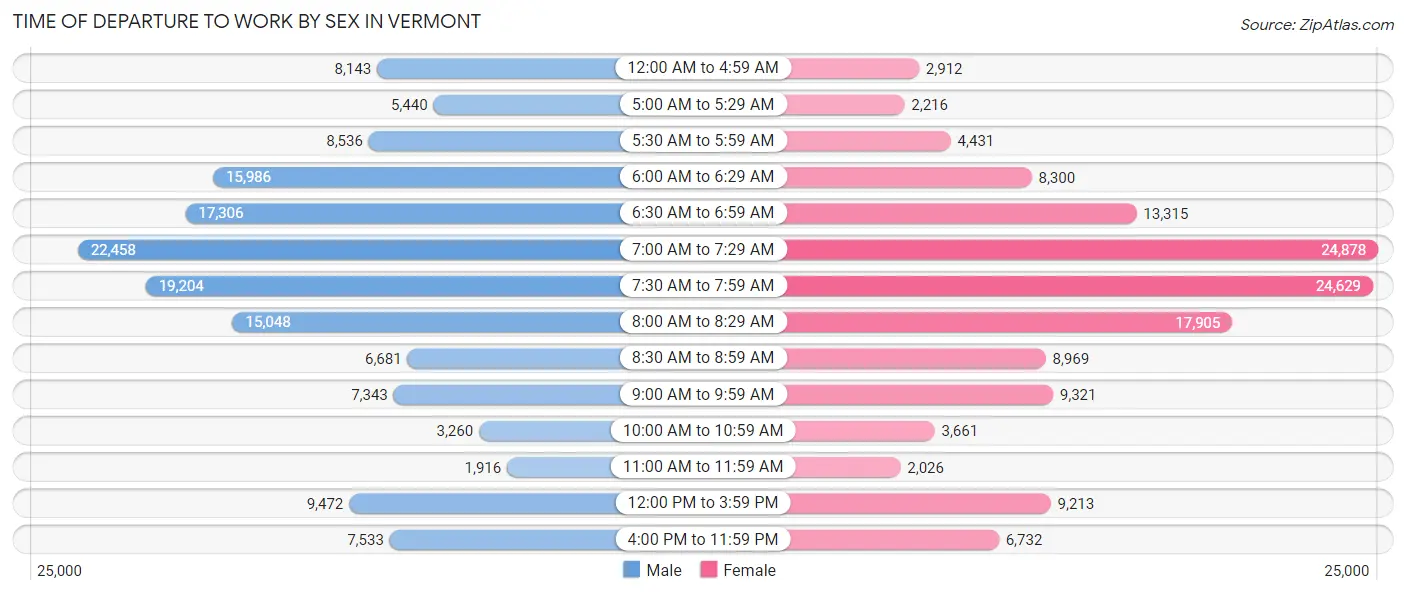
| Time of Departure | Male | Female |
| 12:00 AM to 4:59 AM | 8,143 (5.5%) | 2,912 (2.1%) |
| 5:00 AM to 5:29 AM | 5,440 (3.7%) | 2,216 (1.6%) |
| 5:30 AM to 5:59 AM | 8,536 (5.8%) | 4,431 (3.2%) |
| 6:00 AM to 6:29 AM | 15,986 (10.8%) | 8,300 (6.0%) |
| 6:30 AM to 6:59 AM | 17,306 (11.7%) | 13,315 (9.6%) |
| 7:00 AM to 7:29 AM | 22,458 (15.1%) | 24,878 (18.0%) |
| 7:30 AM to 7:59 AM | 19,204 (13.0%) | 24,629 (17.8%) |
| 8:00 AM to 8:29 AM | 15,048 (10.2%) | 17,905 (12.9%) |
| 8:30 AM to 8:59 AM | 6,681 (4.5%) | 8,969 (6.5%) |
| 9:00 AM to 9:59 AM | 7,343 (5.0%) | 9,321 (6.7%) |
| 10:00 AM to 10:59 AM | 3,260 (2.2%) | 3,661 (2.6%) |
| 11:00 AM to 11:59 AM | 1,916 (1.3%) | 2,026 (1.5%) |
| 12:00 PM to 3:59 PM | 9,472 (6.4%) | 9,213 (6.7%) |
| 4:00 PM to 11:59 PM | 7,533 (5.1%) | 6,732 (4.9%) |
| Total | 148,326 (100.0%) | 138,508 (100.0%) |
Housing Occupancy in Vermont
Occupancy by Ownership in Vermont
Of the total 265,858 dwellings in Vermont, owner-occupied units account for 193,222 (72.7%), while renter-occupied units make up 72,636 (27.3%).
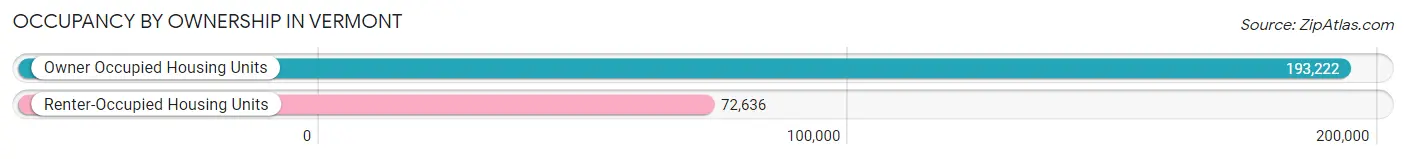
| Occupancy | # Housing Units | % Housing Units |
| Owner Occupied Housing Units | 193,222 | 72.7% |
| Renter-Occupied Housing Units | 72,636 | 27.3% |
| Total Occupied Housing Units | 265,858 | 100.0% |
Occupancy by Household Size in Vermont
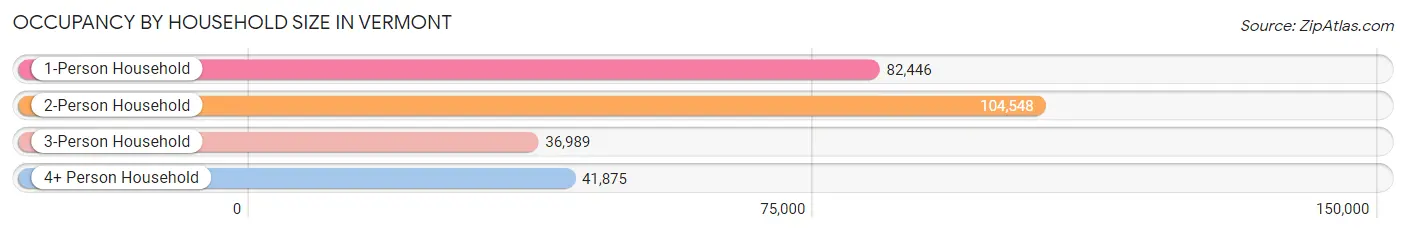
| Household Size | # Housing Units | % Housing Units |
| 1-Person Household | 82,446 | 31.0% |
| 2-Person Household | 104,548 | 39.3% |
| 3-Person Household | 36,989 | 13.9% |
| 4+ Person Household | 41,875 | 15.8% |
| Total Housing Units | 265,858 | 100.0% |
Occupancy by Ownership by Household Size in Vermont
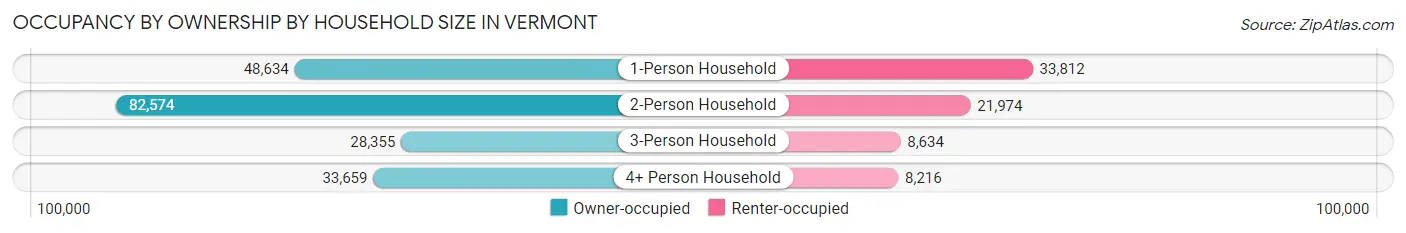
| Household Size | Owner-occupied | Renter-occupied |
| 1-Person Household | 48,634 (59.0%) | 33,812 (41.0%) |
| 2-Person Household | 82,574 (79.0%) | 21,974 (21.0%) |
| 3-Person Household | 28,355 (76.7%) | 8,634 (23.3%) |
| 4+ Person Household | 33,659 (80.4%) | 8,216 (19.6%) |
| Total Housing Units | 193,222 (72.7%) | 72,636 (27.3%) |
Occupancy by Educational Attainment in Vermont
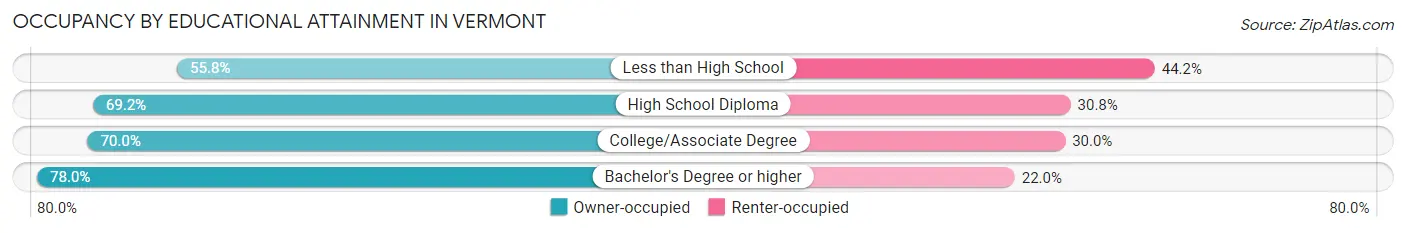
| Household Size | Owner-occupied | Renter-occupied |
| Less than High School | 7,073 (55.8%) | 5,600 (44.2%) |
| High School Diploma | 44,665 (69.2%) | 19,913 (30.8%) |
| College/Associate Degree | 49,475 (70.0%) | 21,182 (30.0%) |
| Bachelor's Degree or higher | 92,009 (78.0%) | 25,941 (22.0%) |
Occupancy by Age of Householder in Vermont
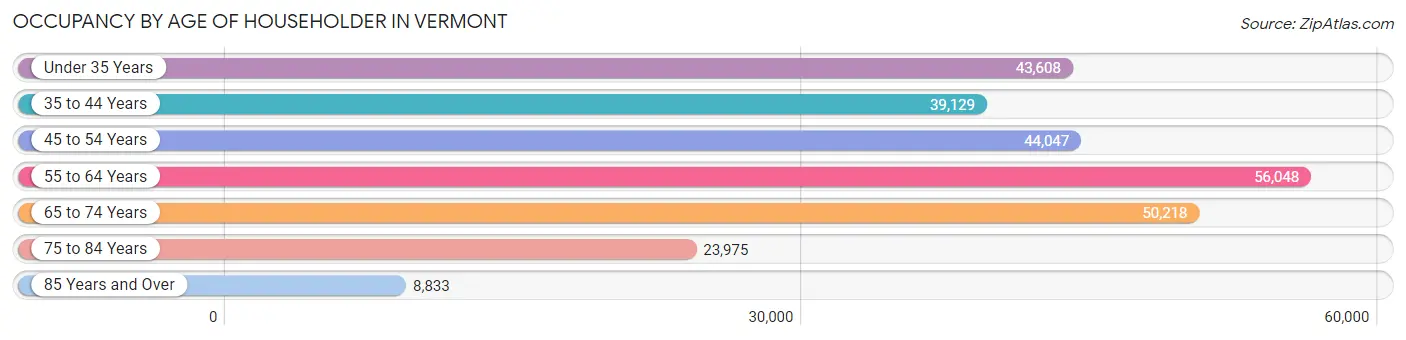
| Age Bracket | # Households | % Households |
| Under 35 Years | 43,608 | 16.4% |
| 35 to 44 Years | 39,129 | 14.7% |
| 45 to 54 Years | 44,047 | 16.6% |
| 55 to 64 Years | 56,048 | 21.1% |
| 65 to 74 Years | 50,218 | 18.9% |
| 75 to 84 Years | 23,975 | 9.0% |
| 85 Years and Over | 8,833 | 3.3% |
| Total | 265,858 | 100.0% |
Housing Finances in Vermont
Median Income by Occupancy in Vermont
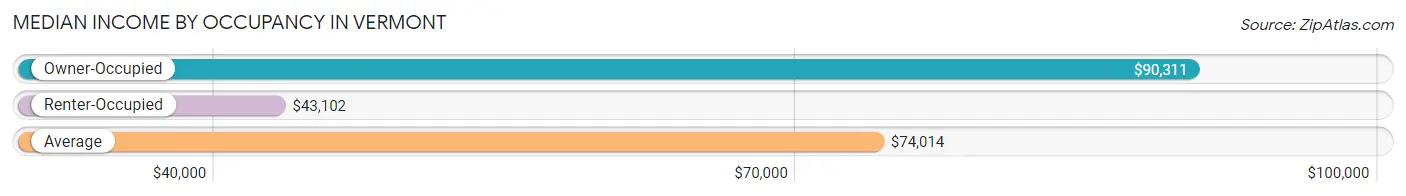
| Occupancy Type | # Households | Median Income |
| Owner-Occupied | 193,222 (72.7%) | $90,311 |
| Renter-Occupied | 72,636 (27.3%) | $43,102 |
| Average | 265,858 (100.0%) | $74,014 |
Occupancy by Householder Income Bracket in Vermont
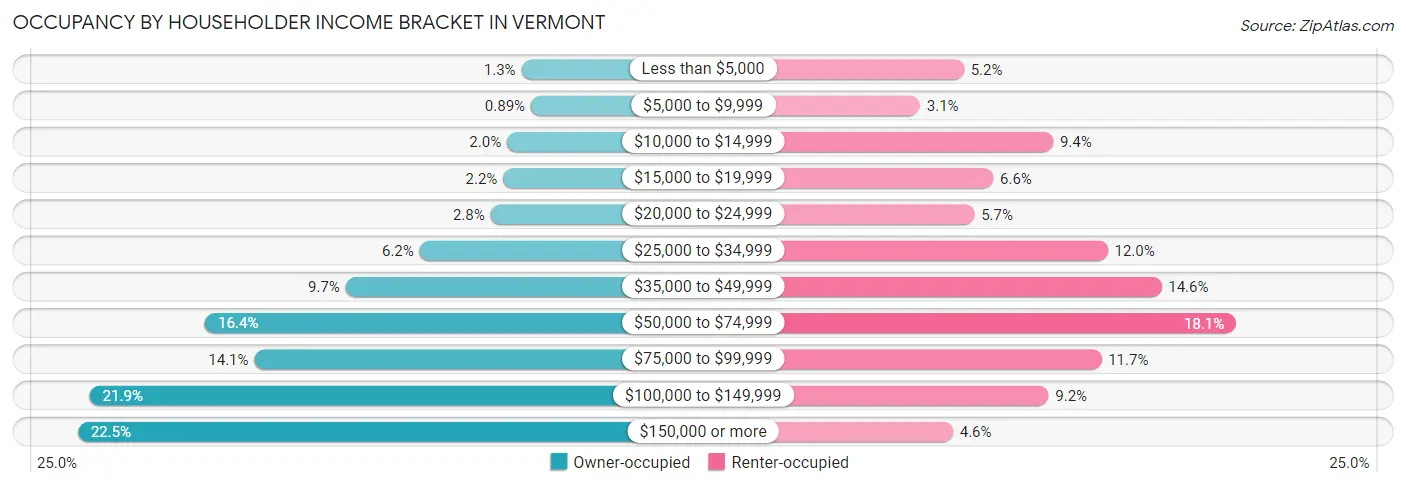
| Income Bracket | Owner-occupied | Renter-occupied |
| Less than $5,000 | 2,592 (1.3%) | 3,738 (5.1%) |
| $5,000 to $9,999 | 1,722 (0.9%) | 2,225 (3.1%) |
| $10,000 to $14,999 | 3,917 (2.0%) | 6,825 (9.4%) |
| $15,000 to $19,999 | 4,265 (2.2%) | 4,756 (6.6%) |
| $20,000 to $24,999 | 5,427 (2.8%) | 4,102 (5.7%) |
| $25,000 to $34,999 | 11,956 (6.2%) | 8,719 (12.0%) |
| $35,000 to $49,999 | 18,756 (9.7%) | 10,576 (14.6%) |
| $50,000 to $74,999 | 31,693 (16.4%) | 13,163 (18.1%) |
| $75,000 to $99,999 | 27,176 (14.1%) | 8,500 (11.7%) |
| $100,000 to $149,999 | 42,310 (21.9%) | 6,666 (9.2%) |
| $150,000 or more | 43,408 (22.5%) | 3,366 (4.6%) |
| Total | 193,222 (100.0%) | 72,636 (100.0%) |
Monthly Housing Cost Tiers in Vermont
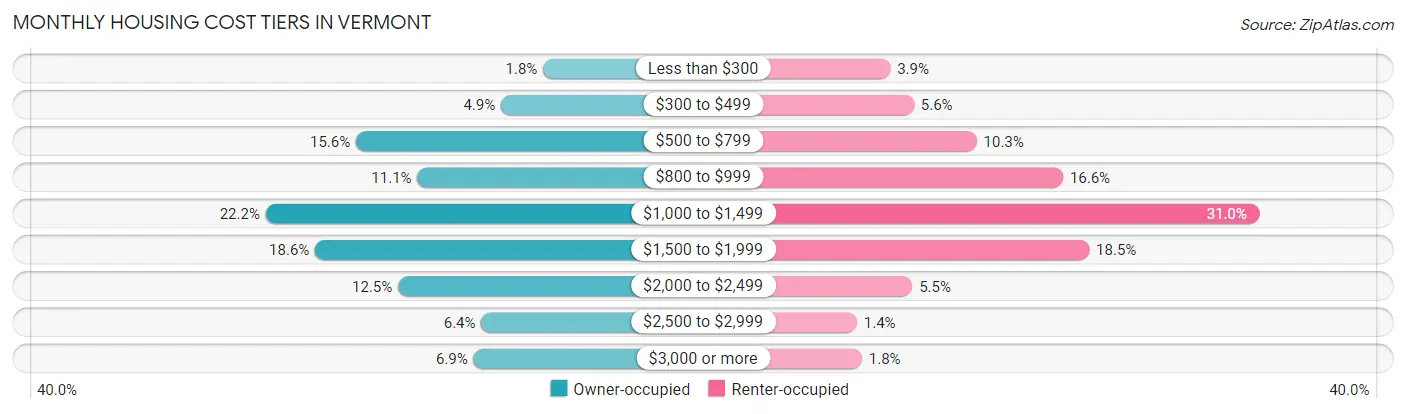
| Monthly Cost | Owner-occupied | Renter-occupied |
| Less than $300 | 3,488 (1.8%) | 2,828 (3.9%) |
| $300 to $499 | 9,493 (4.9%) | 4,091 (5.6%) |
| $500 to $799 | 30,125 (15.6%) | 7,444 (10.2%) |
| $800 to $999 | 21,390 (11.1%) | 12,066 (16.6%) |
| $1,000 to $1,499 | 42,974 (22.2%) | 22,538 (31.0%) |
| $1,500 to $1,999 | 35,940 (18.6%) | 13,466 (18.5%) |
| $2,000 to $2,499 | 24,141 (12.5%) | 3,999 (5.5%) |
| $2,500 to $2,999 | 12,282 (6.4%) | 1,036 (1.4%) |
| $3,000 or more | 13,389 (6.9%) | 1,311 (1.8%) |
| Total | 193,222 (100.0%) | 72,636 (100.0%) |
Physical Housing Characteristics in Vermont
Housing Structures in Vermont
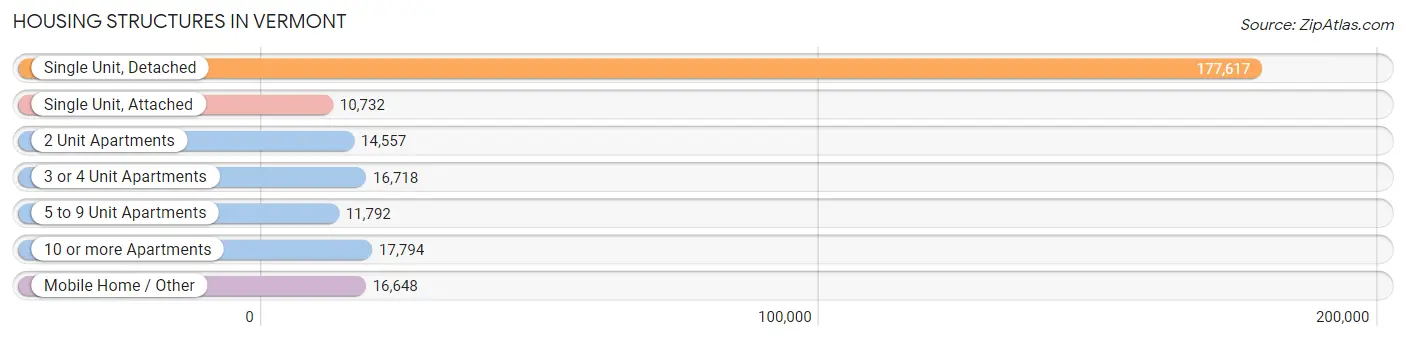
| Structure Type | # Housing Units | % Housing Units |
| Single Unit, Detached | 177,617 | 66.8% |
| Single Unit, Attached | 10,732 | 4.0% |
| 2 Unit Apartments | 14,557 | 5.5% |
| 3 or 4 Unit Apartments | 16,718 | 6.3% |
| 5 to 9 Unit Apartments | 11,792 | 4.4% |
| 10 or more Apartments | 17,794 | 6.7% |
| Mobile Home / Other | 16,648 | 6.3% |
| Total | 265,858 | 100.0% |
Housing Structures by Occupancy in Vermont
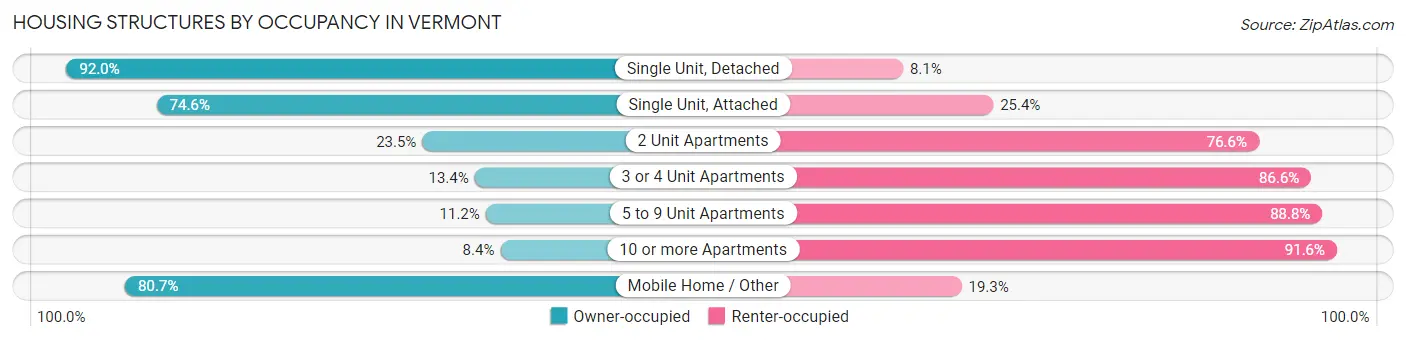
| Structure Type | Owner-occupied | Renter-occupied |
| Single Unit, Detached | 163,316 (91.9%) | 14,301 (8.1%) |
| Single Unit, Attached | 8,004 (74.6%) | 2,728 (25.4%) |
| 2 Unit Apartments | 3,413 (23.4%) | 11,144 (76.5%) |
| 3 or 4 Unit Apartments | 2,235 (13.4%) | 14,483 (86.6%) |
| 5 to 9 Unit Apartments | 1,326 (11.2%) | 10,466 (88.8%) |
| 10 or more Apartments | 1,498 (8.4%) | 16,296 (91.6%) |
| Mobile Home / Other | 13,430 (80.7%) | 3,218 (19.3%) |
| Total | 193,222 (72.7%) | 72,636 (27.3%) |
Housing Structures by Number of Rooms in Vermont
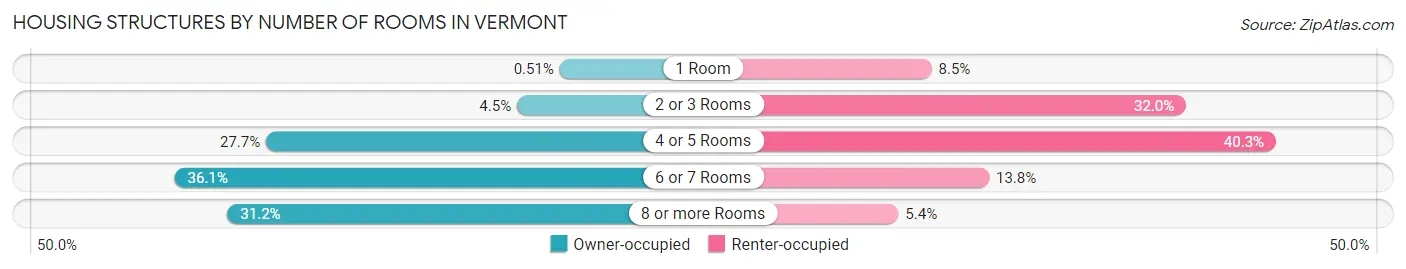
| Number of Rooms | Owner-occupied | Renter-occupied |
| 1 Room | 984 (0.5%) | 6,156 (8.5%) |
| 2 or 3 Rooms | 8,619 (4.5%) | 23,249 (32.0%) |
| 4 or 5 Rooms | 53,468 (27.7%) | 29,285 (40.3%) |
| 6 or 7 Rooms | 69,794 (36.1%) | 10,018 (13.8%) |
| 8 or more Rooms | 60,357 (31.2%) | 3,928 (5.4%) |
| Total | 193,222 (100.0%) | 72,636 (100.0%) |
Housing Structure by Heating Type in Vermont
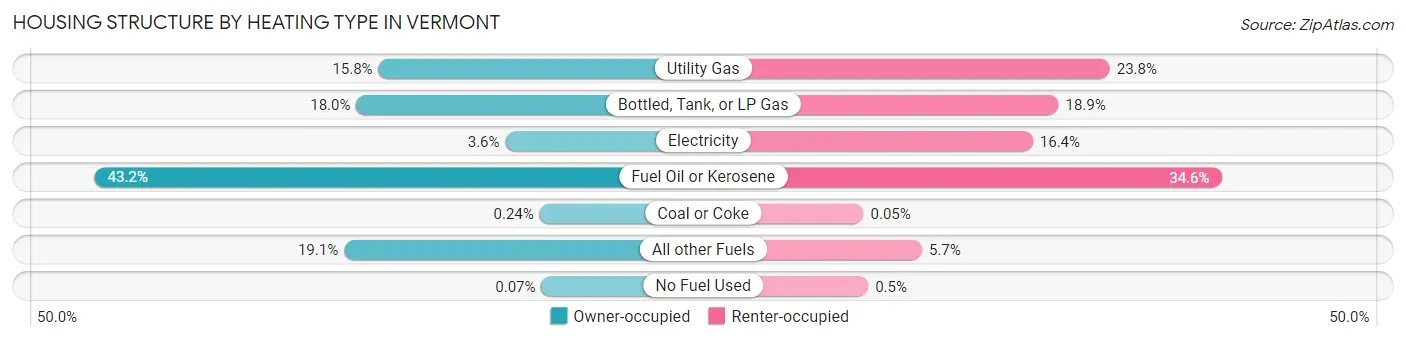
| Heating Type | Owner-occupied | Renter-occupied |
| Utility Gas | 30,552 (15.8%) | 17,314 (23.8%) |
| Bottled, Tank, or LP Gas | 34,678 (17.9%) | 13,724 (18.9%) |
| Electricity | 6,868 (3.5%) | 11,923 (16.4%) |
| Fuel Oil or Kerosene | 83,538 (43.2%) | 25,137 (34.6%) |
| Coal or Coke | 472 (0.2%) | 38 (0.1%) |
| All other Fuels | 36,977 (19.1%) | 4,139 (5.7%) |
| No Fuel Used | 137 (0.1%) | 361 (0.5%) |
| Total | 193,222 (100.0%) | 72,636 (100.0%) |
Household Vehicle Usage in Vermont
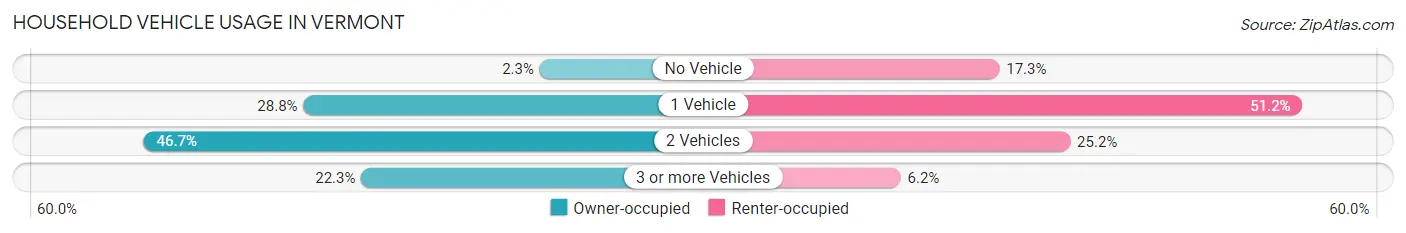
| Vehicles per Household | Owner-occupied | Renter-occupied |
| No Vehicle | 4,418 (2.3%) | 12,558 (17.3%) |
| 1 Vehicle | 55,592 (28.8%) | 37,217 (51.2%) |
| 2 Vehicles | 90,161 (46.7%) | 18,329 (25.2%) |
| 3 or more Vehicles | 43,051 (22.3%) | 4,532 (6.2%) |
| Total | 193,222 (100.0%) | 72,636 (100.0%) |
Real Estate & Mortgages in Vermont
Real Estate and Mortgage Overview in Vermont
| Characteristic | Without Mortgage | With Mortgage |
| Housing Units | 75,108 | 118,114 |
| Median Property Value | $253,900 | $282,700 |
| Median Household Income | $65,129 | $31,521 |
| Monthly Housing Costs | $782 | $13,016 |
| Real Estate Taxes | $4,584 | $1,102 |
Property Value by Mortgage Status in Vermont
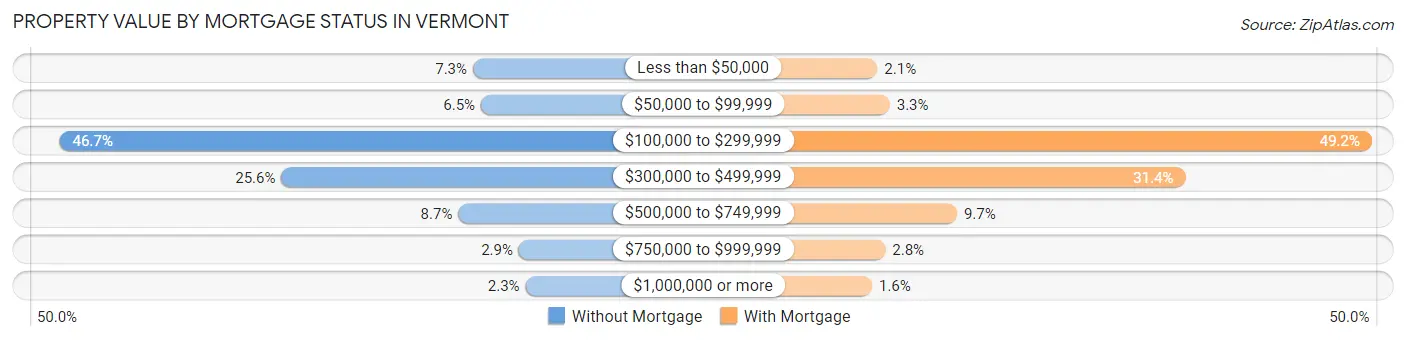
| Property Value | Without Mortgage | With Mortgage |
| Less than $50,000 | 5,491 (7.3%) | 2,462 (2.1%) |
| $50,000 to $99,999 | 4,910 (6.5%) | 3,855 (3.3%) |
| $100,000 to $299,999 | 35,054 (46.7%) | 58,068 (49.2%) |
| $300,000 to $499,999 | 19,192 (25.6%) | 37,097 (31.4%) |
| $500,000 to $749,999 | 6,532 (8.7%) | 11,414 (9.7%) |
| $750,000 to $999,999 | 2,200 (2.9%) | 3,359 (2.8%) |
| $1,000,000 or more | 1,729 (2.3%) | 1,859 (1.6%) |
| Total | 75,108 (100.0%) | 118,114 (100.0%) |
Household Income by Mortgage Status in Vermont
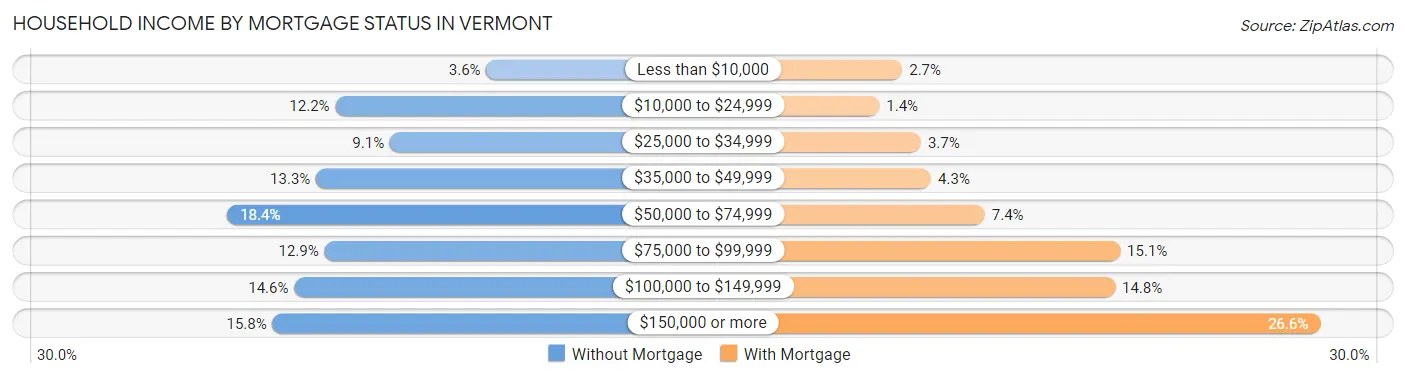
| Household Income | Without Mortgage | With Mortgage |
| Less than $10,000 | 2,712 (3.6%) | 3,148 (2.7%) |
| $10,000 to $24,999 | 9,190 (12.2%) | 1,602 (1.4%) |
| $25,000 to $34,999 | 6,852 (9.1%) | 4,419 (3.7%) |
| $35,000 to $49,999 | 10,022 (13.3%) | 5,104 (4.3%) |
| $50,000 to $74,999 | 13,832 (18.4%) | 8,734 (7.4%) |
| $75,000 to $99,999 | 9,658 (12.9%) | 17,861 (15.1%) |
| $100,000 to $149,999 | 10,955 (14.6%) | 17,518 (14.8%) |
| $150,000 or more | 11,887 (15.8%) | 31,355 (26.6%) |
| Total | 75,108 (100.0%) | 118,114 (100.0%) |
Property Value to Household Income Ratio in Vermont
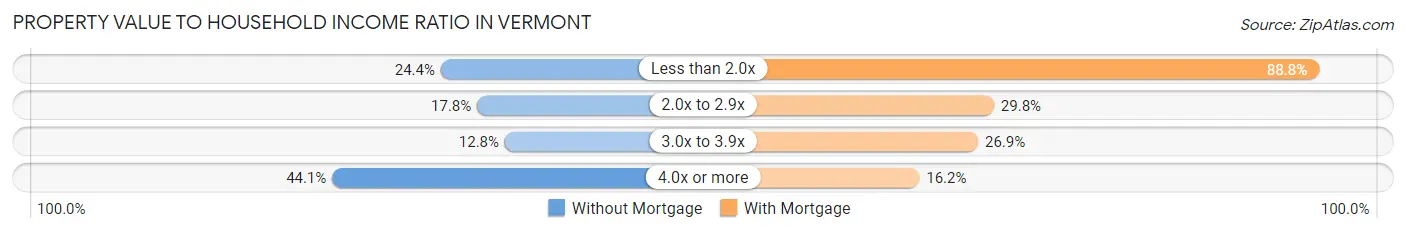
| Value-to-Income Ratio | Without Mortgage | With Mortgage |
| Less than 2.0x | 18,345 (24.4%) | 104,906 (88.8%) |
| 2.0x to 2.9x | 13,381 (17.8%) | 35,172 (29.8%) |
| 3.0x to 3.9x | 9,600 (12.8%) | 31,777 (26.9%) |
| 4.0x or more | 33,151 (44.1%) | 19,173 (16.2%) |
| Total | 75,108 (100.0%) | 118,114 (100.0%) |
Real Estate Taxes by Mortgage Status in Vermont
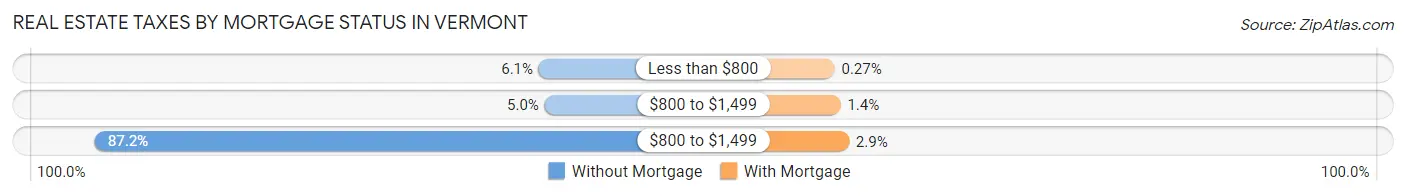
| Property Taxes | Without Mortgage | With Mortgage |
| Less than $800 | 4,556 (6.1%) | 315 (0.3%) |
| $800 to $1,499 | 3,764 (5.0%) | 1,604 (1.4%) |
| $800 to $1,499 | 65,458 (87.2%) | 3,428 (2.9%) |
| Total | 75,108 (100.0%) | 118,114 (100.0%) |
Health & Disability in Vermont
Health Insurance Coverage by Age in Vermont
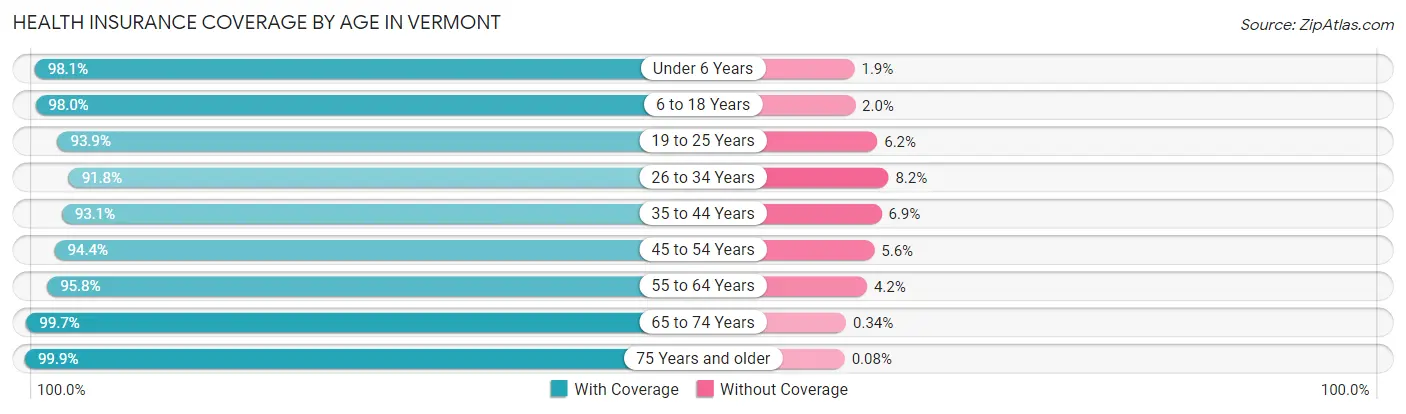
| Age Bracket | With Coverage | Without Coverage |
| Under 6 Years | 33,618 (98.1%) | 655 (1.9%) |
| 6 to 18 Years | 91,153 (98.0%) | 1,877 (2.0%) |
| 19 to 25 Years | 59,603 (93.9%) | 3,904 (6.1%) |
| 26 to 34 Years | 63,293 (91.8%) | 5,684 (8.2%) |
| 35 to 44 Years | 69,746 (93.1%) | 5,204 (6.9%) |
| 45 to 54 Years | 74,565 (94.4%) | 4,435 (5.6%) |
| 55 to 64 Years | 92,431 (95.8%) | 4,078 (4.2%) |
| 65 to 74 Years | 78,667 (99.7%) | 266 (0.3%) |
| 75 Years and older | 48,391 (99.9%) | 38 (0.1%) |
| Total | 611,467 (95.9%) | 26,141 (4.1%) |
Health Insurance Coverage by Citizenship Status in Vermont
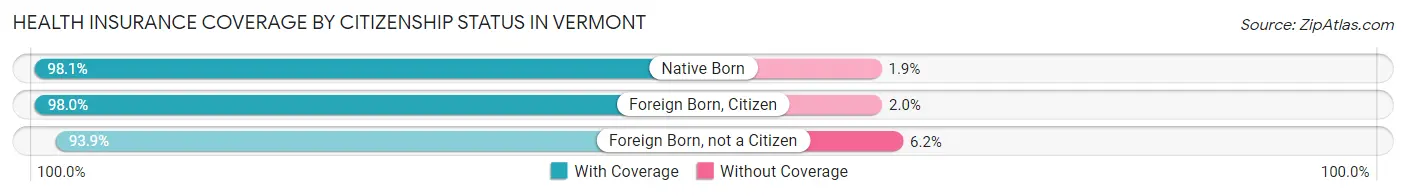
| Citizenship Status | With Coverage | Without Coverage |
| Native Born | 33,618 (98.1%) | 655 (1.9%) |
| Foreign Born, Citizen | 91,153 (98.0%) | 1,877 (2.0%) |
| Foreign Born, not a Citizen | 59,603 (93.9%) | 3,904 (6.1%) |
Health Insurance Coverage by Household Income in Vermont
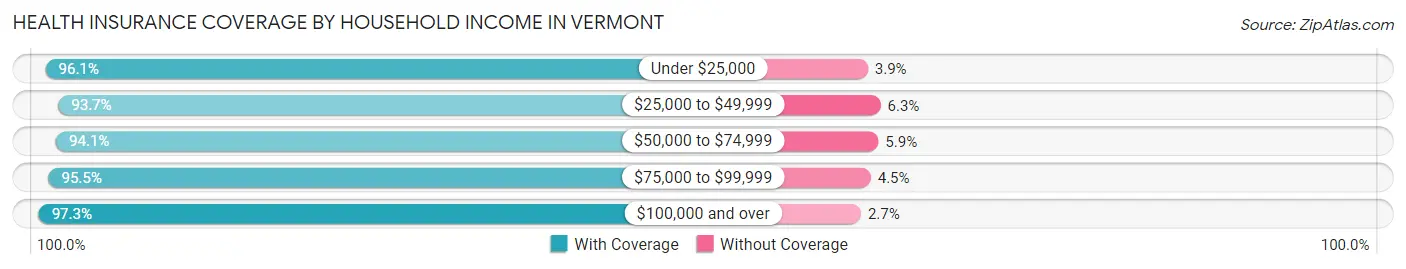
| Household Income | With Coverage | Without Coverage |
| Under $25,000 | 56,360 (96.1%) | 2,312 (3.9%) |
| $25,000 to $49,999 | 85,638 (93.7%) | 5,785 (6.3%) |
| $50,000 to $74,999 | 91,738 (94.1%) | 5,774 (5.9%) |
| $75,000 to $99,999 | 86,230 (95.5%) | 4,064 (4.5%) |
| $100,000 and over | 272,453 (97.3%) | 7,431 (2.7%) |
Public vs Private Health Insurance Coverage by Age in Vermont
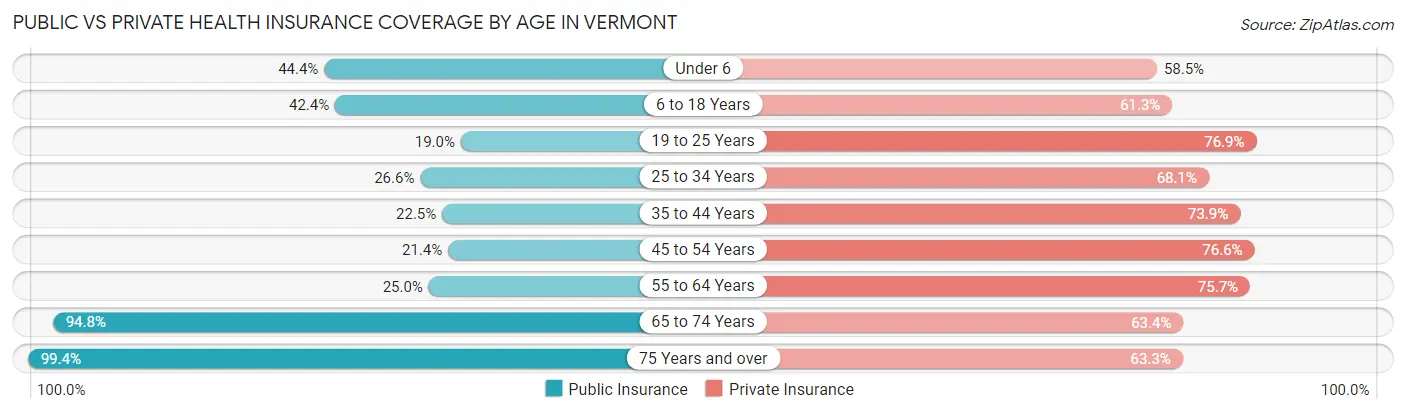
| Age Bracket | Public Insurance | Private Insurance |
| Under 6 | 15,213 (44.4%) | 20,048 (58.5%) |
| 6 to 18 Years | 39,429 (42.4%) | 57,050 (61.3%) |
| 19 to 25 Years | 12,091 (19.0%) | 48,864 (76.9%) |
| 25 to 34 Years | 18,322 (26.6%) | 46,970 (68.1%) |
| 35 to 44 Years | 16,862 (22.5%) | 55,400 (73.9%) |
| 45 to 54 Years | 16,897 (21.4%) | 60,502 (76.6%) |
| 55 to 64 Years | 24,118 (25.0%) | 73,100 (75.7%) |
| 65 to 74 Years | 74,813 (94.8%) | 50,021 (63.4%) |
| 75 Years and over | 48,145 (99.4%) | 30,634 (63.3%) |
| Total | 265,890 (41.7%) | 442,589 (69.4%) |
Disability Status by Sex by Age in Vermont
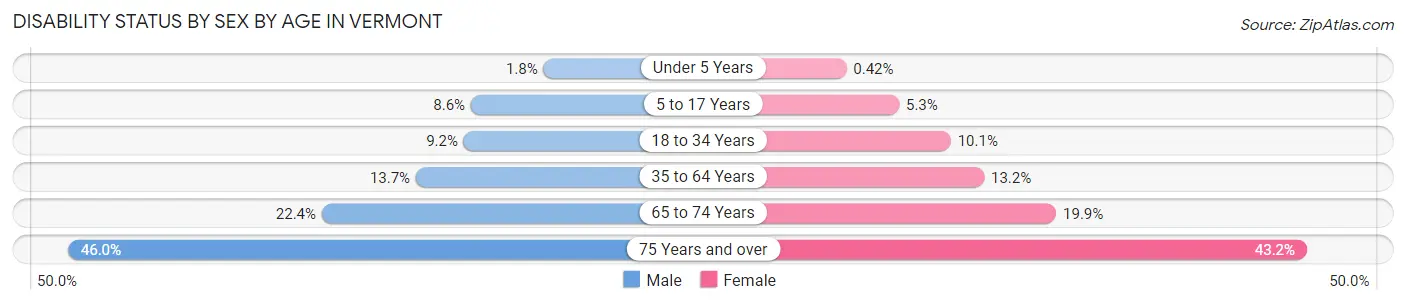
| Age Bracket | Male | Female |
| Under 5 Years | 267 (1.8%) | 58 (0.4%) |
| 5 to 17 Years | 3,958 (8.6%) | 2,241 (5.3%) |
| 18 to 34 Years | 6,728 (9.2%) | 7,112 (10.1%) |
| 35 to 64 Years | 16,949 (13.7%) | 16,709 (13.2%) |
| 65 to 74 Years | 8,639 (22.4%) | 8,033 (19.9%) |
| 75 Years and over | 9,726 (46.0%) | 11,773 (43.2%) |
Disability Class by Sex by Age in Vermont
Disability Class: Hearing Difficulty
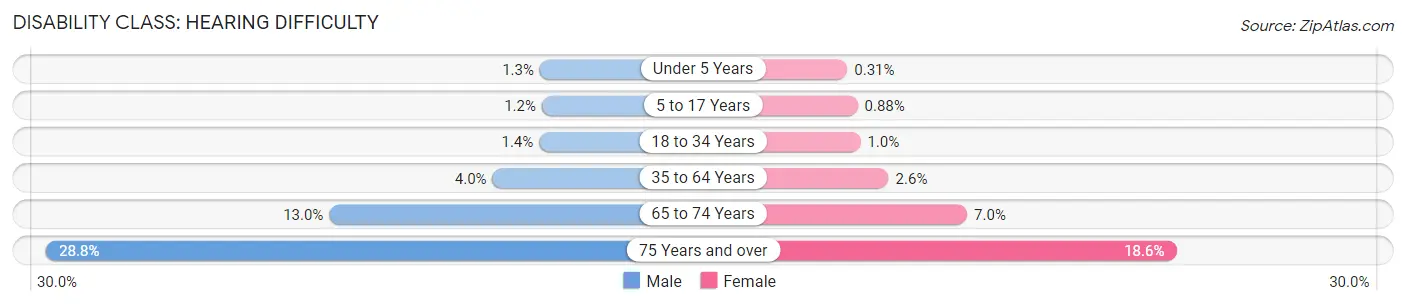
| Age Bracket | Male | Female |
| Under 5 Years | 191 (1.3%) | 43 (0.3%) |
| 5 to 17 Years | 556 (1.2%) | 371 (0.9%) |
| 18 to 34 Years | 979 (1.3%) | 732 (1.0%) |
| 35 to 64 Years | 4,894 (4.0%) | 3,298 (2.6%) |
| 65 to 74 Years | 5,026 (13.0%) | 2,817 (7.0%) |
| 75 Years and over | 6,093 (28.8%) | 5,079 (18.6%) |
Disability Class: Vision Difficulty
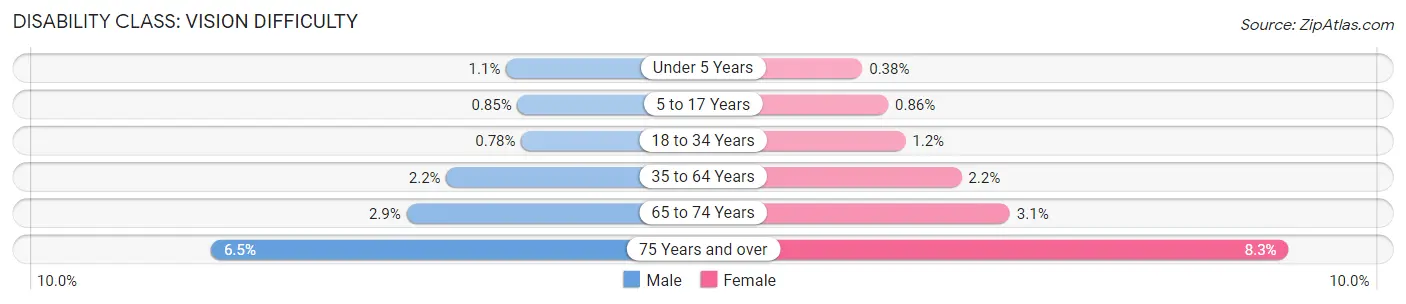
| Age Bracket | Male | Female |
| Under 5 Years | 154 (1.1%) | 52 (0.4%) |
| 5 to 17 Years | 393 (0.9%) | 365 (0.9%) |
| 18 to 34 Years | 567 (0.8%) | 830 (1.2%) |
| 35 to 64 Years | 2,692 (2.2%) | 2,813 (2.2%) |
| 65 to 74 Years | 1,122 (2.9%) | 1,258 (3.1%) |
| 75 Years and over | 1,384 (6.5%) | 2,260 (8.3%) |
Disability Class: Cognitive Difficulty
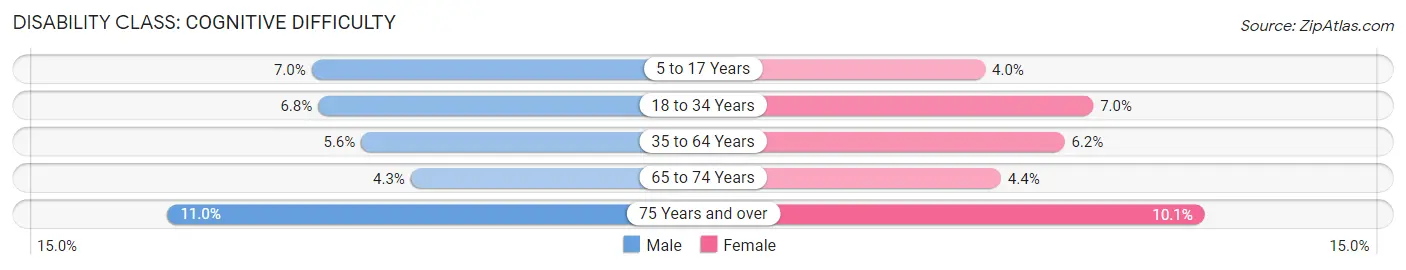
| Age Bracket | Male | Female |
| 5 to 17 Years | 3,233 (7.0%) | 1,687 (4.0%) |
| 18 to 34 Years | 4,969 (6.8%) | 4,922 (7.0%) |
| 35 to 64 Years | 6,976 (5.6%) | 7,848 (6.2%) |
| 65 to 74 Years | 1,638 (4.3%) | 1,787 (4.4%) |
| 75 Years and over | 2,332 (11.0%) | 2,754 (10.1%) |
Disability Class: Ambulatory Difficulty
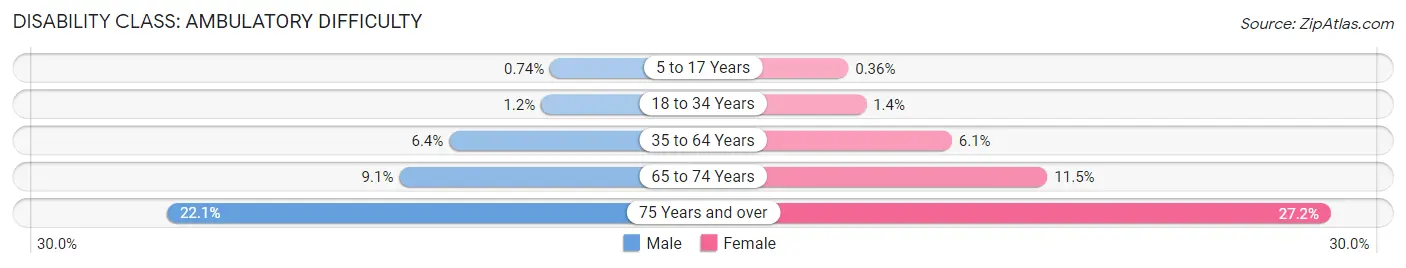
| Age Bracket | Male | Female |
| 5 to 17 Years | 343 (0.7%) | 152 (0.4%) |
| 18 to 34 Years | 903 (1.2%) | 959 (1.4%) |
| 35 to 64 Years | 7,872 (6.4%) | 7,761 (6.1%) |
| 65 to 74 Years | 3,525 (9.1%) | 4,624 (11.5%) |
| 75 Years and over | 4,668 (22.1%) | 7,428 (27.2%) |
Disability Class: Self-Care Difficulty
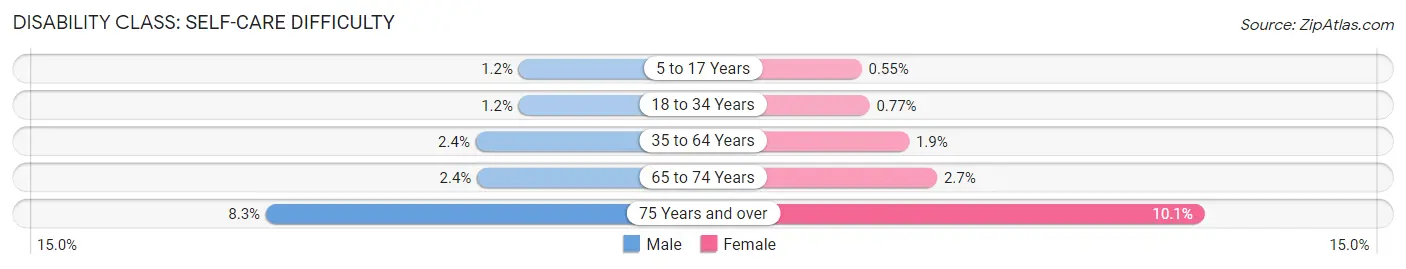
| Age Bracket | Male | Female |
| 5 to 17 Years | 570 (1.2%) | 232 (0.5%) |
| 18 to 34 Years | 905 (1.2%) | 540 (0.8%) |
| 35 to 64 Years | 3,023 (2.4%) | 2,366 (1.9%) |
| 65 to 74 Years | 926 (2.4%) | 1,070 (2.6%) |
| 75 Years and over | 1,751 (8.3%) | 2,756 (10.1%) |
Technology Access in Vermont
Computing Device Access in Vermont
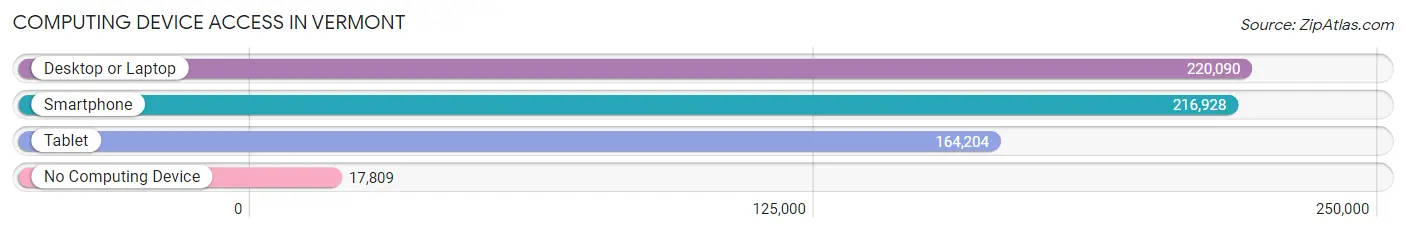
| Device Type | # Households | % Households |
| Desktop or Laptop | 220,090 | 82.8% |
| Smartphone | 216,928 | 81.6% |
| Tablet | 164,204 | 61.8% |
| No Computing Device | 17,809 | 6.7% |
| Total | 265,858 | 100.0% |
Internet Access in Vermont
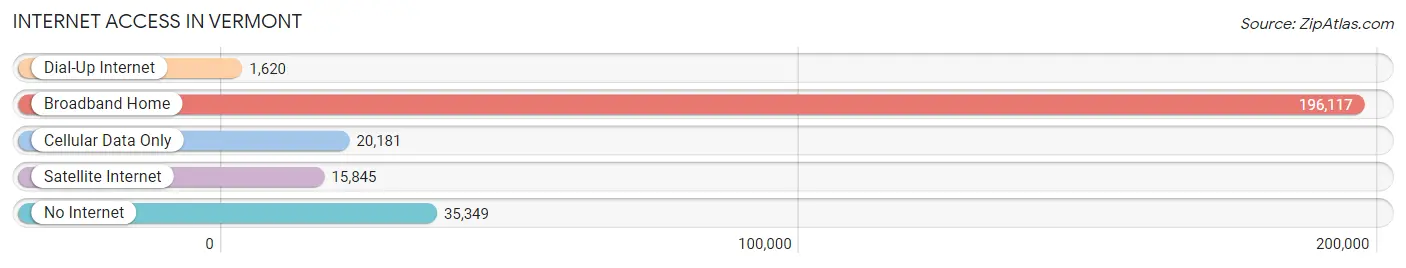
| Internet Type | # Households | % Households |
| Dial-Up Internet | 1,620 | 0.6% |
| Broadband Home | 196,117 | 73.8% |
| Cellular Data Only | 20,181 | 7.6% |
| Satellite Internet | 15,845 | 6.0% |
| No Internet | 35,349 | 13.3% |
| Total | 265,858 | 100.0% |
Vermont Summary
Vermont is a state located in the northeastern United States. It is bordered by Massachusetts to the south, New Hampshire to the east, New York to the west, and the Canadian province of Quebec to the north. Vermont is the second-smallest by population and the sixth-smallest by area of the 50 U.S. states. The state capital is Montpelier, the least populous state capital in the United States. The most populous city, Burlington, is the least populous city to be the most populous city in a state.
History
The area that is now Vermont was originally inhabited by the Abenaki and Mohican Native American tribes. French explorers Jacques Cartier and Samuel de Champlain visited the area in the early 1600s, and the French and Indian War (1754-1763) resulted in the area becoming part of the British Province of Quebec.
In 1777, Vermont declared its independence from the British and became the fourteenth state to join the United States. The state was admitted to the Union in 1791 as the fourteenth state.
During the Civil War, Vermont was a strong supporter of the Union and provided more than 30,000 troops to the Union Army. After the war, Vermont experienced a period of economic growth and prosperity.
Geography
Vermont is located in the New England region of the northeastern United States. It is bordered by Massachusetts to the south, New Hampshire to the east, New York to the west, and the Canadian province of Quebec to the north.
Vermont is the second-smallest by population and the sixth-smallest by area of the 50 U.S. states. The state has a total area of 9,616 square miles, of which 9,250 square miles is land and 366 square miles is water.
Vermont is known for its beautiful scenery, with mountains, valleys, and forests. The Green Mountains run north to south through the center of the state, and the highest point in the state is Mount Mansfield, at 4,395 feet.
Economy
Vermont has a diverse economy, with a mix of agriculture, manufacturing, and services. The state’s largest industries are tourism, dairy farming, and manufacturing.
Agriculture is an important part of the state’s economy, with dairy farming being the largest sector. Other important agricultural products include apples, maple syrup, and hay.
Manufacturing is also an important part of the state’s economy, with products such as electronics, machinery, and medical equipment being produced in the state.
The service sector is also an important part of the state’s economy, with the largest employers being health care, education, and government.
Demographics
As of the 2010 census, the population of Vermont was 625,741. The population is estimated to be 626,630 as of July 2019.
The racial makeup of the state is 94.2% White, 1.2% African American, 0.8% Native American, 1.2% Asian, 0.1% Pacific Islander, 0.7% from other races, and 1.8% from two or more races. Hispanic or Latino of any race make up 2.2% of the population.
The median household income in Vermont is $58,902, and the median family income is $71,817. The per capita income is $30,948. The poverty rate is 11.2%.
Vermont is the second-least populous state in the United States, and the most rural state in the country. It is also the second-most densely populated state in the country, after New Jersey.
Common Questions
When was Vermont Incorporated?
Vermont was Incorporated into the Union on Mar 4, 1791.
What is the Total Area of Vermont?
Total Area of Vermont is 9,616 Square Miles.
What is the Total Land Area of Vermont?
Total Land Area of Vermont is 9,217 Square Miles.
What is the Total Water Area of Vermont?
Total Water Area of Vermont is 400 Square Miles.
What is the Average Elevation in Vermont?
Average Elevation in Vermont is 1,000 Feet.
What is the Highest Elevation in Vermont?
Highest Elevation in Vermont is 4,393 Feet.
What is the Lowest Elevation in Vermont?
Lowest Elevation in Vermont is 95 Feet.
What is the Population Density in Vermont?
Population Density in Vermont is 69.8 People per Square Mile.
What is Per Capita Income in Vermont?
Per Capita income in Vermont is $41,680.
What is the Median Family Income in Vermont?
Median Family Income in Vermont is $97,153.
What is the Median Household income in Vermont?
Median Household Income in Vermont is $74,014.
What is Income or Wage Gap in Vermont?
Income or Wage Gap in Vermont is 18.3%.
Women in Vermont earn 81.7 cents for every dollar earned by a man.
What is Family Income Deficit in Vermont?
Family Income Deficit in Vermont is $10,207.
Families that are below poverty line in Vermont earn $10,207 less on average than the poverty threshold level.
What is Inequality or Gini Index in Vermont?
Inequality or Gini Index in Vermont is 0.45.
What is the Total Population of Vermont?
Total Population of Vermont is 643,816.
What is the Total Male Population of Vermont?
Total Male Population of Vermont is 320,339.
What is the Total Female Population of Vermont?
Total Female Population of Vermont is 323,477.
What is the Ratio of Males per 100 Females in Vermont?
There are 99.03 Males per 100 Females in Vermont.
What is the Ratio of Females per 100 Males in Vermont?
There are 100.98 Females per 100 Males in Vermont.
What is the Median Population Age in Vermont?
Median Population Age in Vermont is 42.9 Years.
What is the Average Family Size in Vermont
Average Family Size in Vermont is 2.9 People.
What is the Average Household Size in Vermont
Average Household Size in Vermont is 2.3 People.
How Large is the Labor Force in Vermont?
There are 351,725 People in the Labor Forcein in Vermont.
What is the Percentage of People in the Labor Force in Vermont?
64.9% of People are in the Labor Force in Vermont.
What is the Unemployment Rate in Vermont?
Unemployment Rate in Vermont is 3.8%.