Immigrants from Portugal Disability Age 5 to 17
COMPARE
Immigrants from Portugal
Select to Compare
Disability Age 5 to 17
Immigrants from Portugal Disability Age 5 to 17
6.4%
DISABILITY | AGE 5 TO 17
0.0/ 100
METRIC RATING
315th/ 347
METRIC RANK
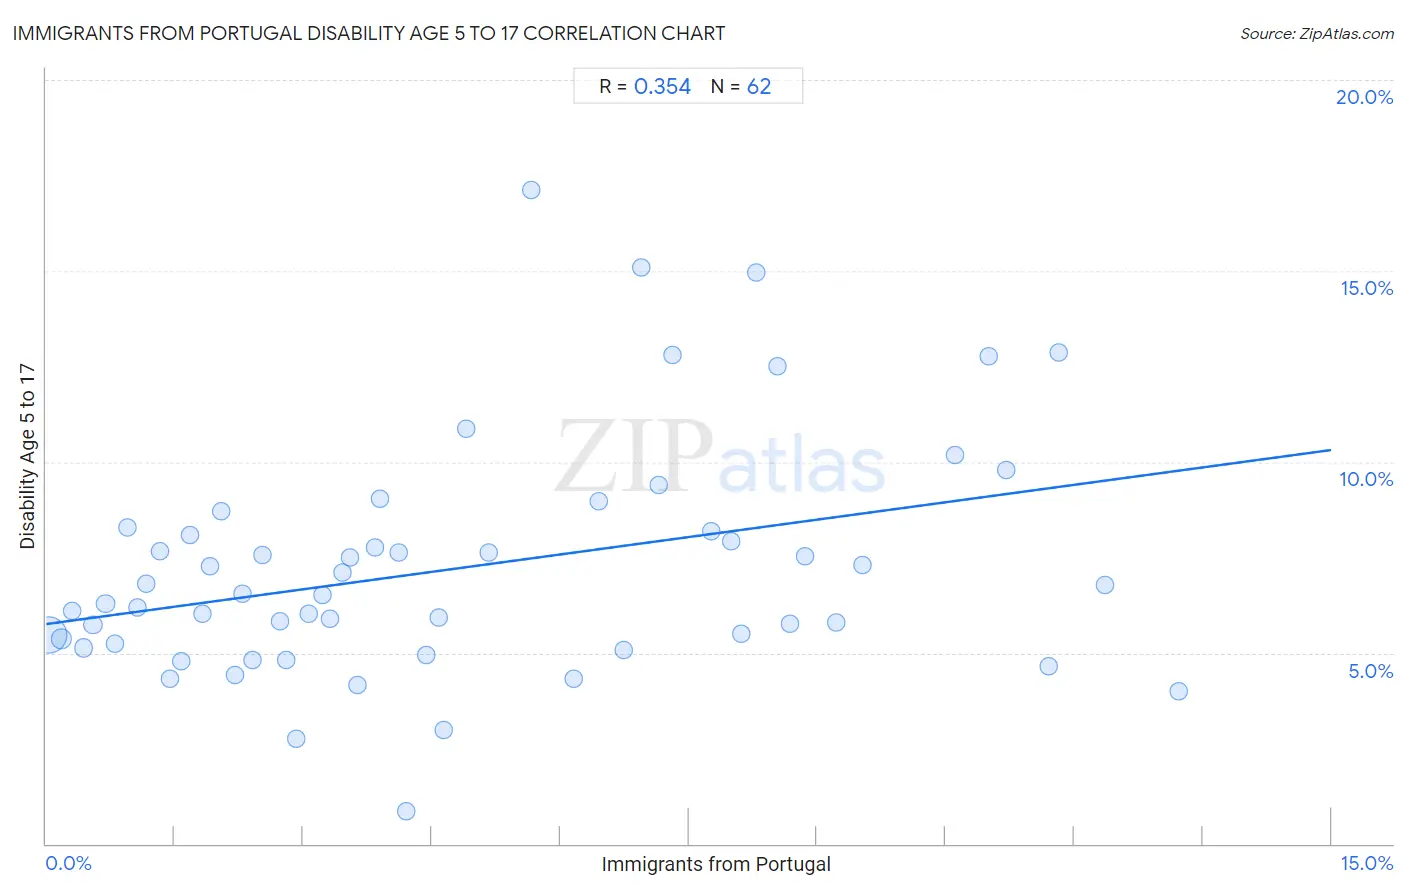
Immigrants from Portugal Disability Age 5 to 17 Correlation Chart
The statistical analysis conducted on geographies consisting of 173,811,905 people shows a mild positive correlation between the proportion of Immigrants from Portugal and percentage of population with a disability between the ages 5 and 17 in the United States with a correlation coefficient (R) of 0.354 and weighted average of 6.4%. On average, for every 1% (one percent) increase in Immigrants from Portugal within a typical geography, there is an increase of 0.30% in percentage of population with a disability between the ages 5 and 17.
It is essential to understand that the correlation between the percentage of Immigrants from Portugal and percentage of population with a disability between the ages 5 and 17 does not imply a direct cause-and-effect relationship. It remains uncertain whether the presence of Immigrants from Portugal influences an upward or downward trend in the level of percentage of population with a disability between the ages 5 and 17 within an area, or if Immigrants from Portugal simply ended up residing in those areas with higher or lower levels of percentage of population with a disability between the ages 5 and 17 due to other factors.
Demographics Similar to Immigrants from Portugal by Disability Age 5 to 17
In terms of disability age 5 to 17, the demographic groups most similar to Immigrants from Portugal are French (6.4%, a difference of 0.18%), Immigrants from Dominican Republic (6.4%, a difference of 0.18%), Kiowa (6.4%, a difference of 0.31%), Comanche (6.4%, a difference of 0.34%), and Apache (6.4%, a difference of 0.69%).
| Demographics | Rating | Rank | Disability Age 5 to 17 |
| Scotch-Irish | 0.0 /100 | #308 | Tragic 6.3% |
| Hmong | 0.0 /100 | #309 | Tragic 6.3% |
| Alaskan Athabascans | 0.0 /100 | #310 | Tragic 6.3% |
| Immigrants from Dominica | 0.0 /100 | #311 | Tragic 6.3% |
| Bermudans | 0.0 /100 | #312 | Tragic 6.4% |
| Apache | 0.0 /100 | #313 | Tragic 6.4% |
| French | 0.0 /100 | #314 | Tragic 6.4% |
| Immigrants from Portugal | 0.0 /100 | #315 | Tragic 6.4% |
| Immigrants from Dominican Republic | 0.0 /100 | #316 | Tragic 6.4% |
| Kiowa | 0.0 /100 | #317 | Tragic 6.4% |
| Comanche | 0.0 /100 | #318 | Tragic 6.4% |
| Delaware | 0.0 /100 | #319 | Tragic 6.5% |
| Africans | 0.0 /100 | #320 | Tragic 6.5% |
| Tohono O'odham | 0.0 /100 | #321 | Tragic 6.5% |
| Slovaks | 0.0 /100 | #322 | Tragic 6.5% |
Immigrants from Portugal Disability Age 5 to 17 Correlation Summary
| Measurement | Immigrants from Portugal Data | Disability Age 5 to 17 Data |
| Minimum | 0.034% | 0.84% |
| Maximum | 13.2% | 17.1% |
| Range | 13.2% | 16.3% |
| Mean | 4.9% | 7.2% |
| Median | 3.9% | 6.5% |
| Interquartile 25% (IQ1) | 1.9% | 5.3% |
| Interquartile 75% (IQ3) | 7.8% | 8.2% |
| Interquartile Range (IQR) | 5.8% | 2.9% |
| Standard Deviation (Sample) | 3.6% | 3.1% |
| Standard Deviation (Population) | 3.6% | 3.1% |
Correlation Details
| Immigrants from Portugal Percentile | Sample Size | Disability Age 5 to 17 |
[ 0.0% - 0.5% ] 0.034% | 138,854,612 | 5.5% |
[ 0.0% - 0.5% ] 0.18% | 16,513,169 | 5.4% |
[ 0.0% - 0.5% ] 0.30% | 5,227,009 | 6.1% |
[ 0.0% - 0.5% ] 0.43% | 3,034,223 | 5.1% |
[ 0.5% - 1.0% ] 0.55% | 2,547,844 | 5.7% |
[ 0.5% - 1.0% ] 0.69% | 1,239,737 | 6.3% |
[ 0.5% - 1.0% ] 0.81% | 622,663 | 5.3% |
[ 0.5% - 1.0% ] 0.95% | 655,875 | 8.3% |
[ 1.0% - 1.5% ] 1.06% | 681,460 | 6.2% |
[ 1.0% - 1.5% ] 1.17% | 256,534 | 6.8% |
[ 1.0% - 1.5% ] 1.33% | 470,814 | 7.7% |
[ 1.0% - 1.5% ] 1.45% | 307,791 | 4.3% |
[ 1.5% - 2.0% ] 1.58% | 189,714 | 4.8% |
[ 1.5% - 2.0% ] 1.68% | 207,434 | 8.1% |
[ 1.5% - 2.0% ] 1.82% | 359,969 | 6.0% |
[ 1.5% - 2.0% ] 1.91% | 101,802 | 7.3% |
[ 2.0% - 2.5% ] 2.05% | 343,717 | 8.7% |
[ 2.0% - 2.5% ] 2.20% | 215,673 | 4.4% |
[ 2.0% - 2.5% ] 2.29% | 26,163 | 6.5% |
[ 2.0% - 2.5% ] 2.41% | 119,872 | 4.8% |
[ 2.5% - 3.0% ] 2.53% | 160,677 | 7.6% |
[ 2.5% - 3.0% ] 2.72% | 31,505 | 5.8% |
[ 2.5% - 3.0% ] 2.80% | 184,081 | 4.8% |
[ 2.5% - 3.0% ] 2.92% | 102,349 | 2.7% |
[ 3.0% - 3.5% ] 3.07% | 83,553 | 6.0% |
[ 3.0% - 3.5% ] 3.23% | 13,154 | 6.5% |
[ 3.0% - 3.5% ] 3.31% | 76,771 | 5.9% |
[ 3.0% - 3.5% ] 3.46% | 37,495 | 7.1% |
[ 3.5% - 4.0% ] 3.54% | 83,087 | 7.5% |
[ 3.5% - 4.0% ] 3.64% | 15,496 | 4.2% |
[ 3.5% - 4.0% ] 3.84% | 16,415 | 7.8% |
[ 3.5% - 4.0% ] 3.89% | 16,427 | 9.0% |
[ 4.0% - 4.5% ] 4.12% | 42,688 | 7.6% |
[ 4.0% - 4.5% ] 4.20% | 32,704 | 0.84% |
[ 4.0% - 4.5% ] 4.44% | 64,636 | 4.9% |
[ 4.5% - 5.0% ] 4.58% | 111,351 | 5.9% |
[ 4.5% - 5.0% ] 4.64% | 3,620 | 3.0% |
[ 4.5% - 5.0% ] 4.90% | 2,654 | 10.9% |
[ 5.0% - 5.5% ] 5.17% | 82,314 | 7.6% |
[ 5.5% - 6.0% ] 5.67% | 2,436 | 17.1% |
[ 6.0% - 6.5% ] 6.16% | 86,201 | 4.3% |
[ 6.0% - 6.5% ] 6.45% | 10,466 | 9.0% |
[ 6.5% - 7.0% ] 6.74% | 11,431 | 5.1% |
[ 6.5% - 7.0% ] 6.95% | 5,572 | 15.1% |
[ 7.0% - 7.5% ] 7.15% | 1,581 | 9.4% |
[ 7.0% - 7.5% ] 7.31% | 12,072 | 12.8% |
[ 7.5% - 8.0% ] 7.76% | 100,620 | 8.2% |
[ 7.5% - 8.0% ] 8.00% | 21,383 | 7.9% |
[ 8.0% - 8.5% ] 8.11% | 47,012 | 5.5% |
[ 8.0% - 8.5% ] 8.29% | 16,286 | 15.0% |
[ 8.5% - 9.0% ] 8.54% | 56,696 | 12.5% |
[ 8.5% - 9.0% ] 8.68% | 20,883 | 5.8% |
[ 8.5% - 9.0% ] 8.86% | 27,548 | 7.5% |
[ 9.0% - 9.5% ] 9.22% | 25,084 | 5.8% |
[ 9.5% - 10.0% ] 9.53% | 18,445 | 7.3% |
[ 10.5% - 11.0% ] 10.61% | 12,465 | 10.2% |
[ 10.5% - 11.0% ] 11.00% | 30,558 | 12.8% |
[ 11.0% - 11.5% ] 11.21% | 93,638 | 9.8% |
[ 11.5% - 12.0% ] 11.71% | 8,763 | 4.6% |
[ 11.5% - 12.0% ] 11.82% | 17,164 | 12.9% |
[ 12.0% - 12.5% ] 12.36% | 26,807 | 6.8% |
[ 13.0% - 13.5% ] 13.22% | 21,742 | 4.0% |