Czechoslovakian Disability Age 5 to 17
COMPARE
Czechoslovakian
Select to Compare
Disability Age 5 to 17
Czechoslovakian Disability Age 5 to 17
5.9%
DISABILITY | AGE 5 TO 17
0.7/ 100
METRIC RATING
263rd/ 347
METRIC RANK
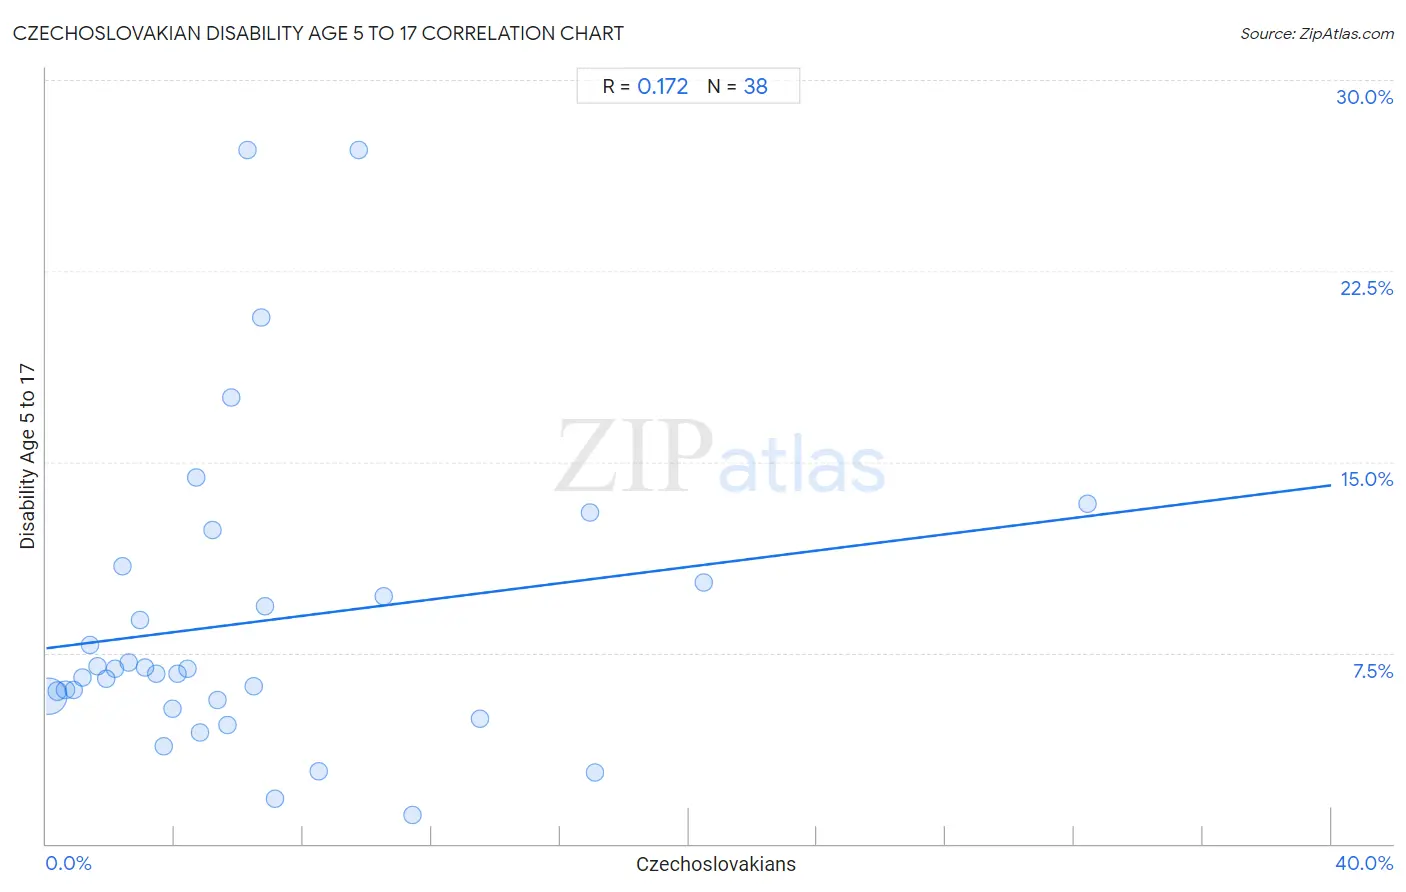
Czechoslovakian Disability Age 5 to 17 Correlation Chart
The statistical analysis conducted on geographies consisting of 365,368,249 people shows a poor positive correlation between the proportion of Czechoslovakians and percentage of population with a disability between the ages 5 and 17 in the United States with a correlation coefficient (R) of 0.172 and weighted average of 5.9%. On average, for every 1% (one percent) increase in Czechoslovakians within a typical geography, there is an increase of 0.16% in percentage of population with a disability between the ages 5 and 17.
It is essential to understand that the correlation between the percentage of Czechoslovakians and percentage of population with a disability between the ages 5 and 17 does not imply a direct cause-and-effect relationship. It remains uncertain whether the presence of Czechoslovakians influences an upward or downward trend in the level of percentage of population with a disability between the ages 5 and 17 within an area, or if Czechoslovakians simply ended up residing in those areas with higher or lower levels of percentage of population with a disability between the ages 5 and 17 due to other factors.
Demographics Similar to Czechoslovakians by Disability Age 5 to 17
In terms of disability age 5 to 17, the demographic groups most similar to Czechoslovakians are Immigrants from Western Africa (5.9%, a difference of 0.080%), Immigrants from Middle Africa (5.9%, a difference of 0.11%), Canadian (6.0%, a difference of 0.12%), Somali (5.9%, a difference of 0.18%), and Panamanian (6.0%, a difference of 0.19%).
| Demographics | Rating | Rank | Disability Age 5 to 17 |
| Hopi | 1.0 /100 | #256 | Tragic 5.9% |
| Hispanics or Latinos | 1.0 /100 | #257 | Tragic 5.9% |
| Brazilians | 0.9 /100 | #258 | Tragic 5.9% |
| Slavs | 0.9 /100 | #259 | Tragic 5.9% |
| Somalis | 0.8 /100 | #260 | Tragic 5.9% |
| Immigrants from Middle Africa | 0.7 /100 | #261 | Tragic 5.9% |
| Immigrants from Western Africa | 0.7 /100 | #262 | Tragic 5.9% |
| Czechoslovakians | 0.7 /100 | #263 | Tragic 5.9% |
| Canadians | 0.6 /100 | #264 | Tragic 6.0% |
| Panamanians | 0.6 /100 | #265 | Tragic 6.0% |
| Slovenes | 0.6 /100 | #266 | Tragic 6.0% |
| Spanish | 0.5 /100 | #267 | Tragic 6.0% |
| Sioux | 0.4 /100 | #268 | Tragic 6.0% |
| Liberians | 0.4 /100 | #269 | Tragic 6.0% |
| Immigrants from Somalia | 0.4 /100 | #270 | Tragic 6.0% |
Czechoslovakian Disability Age 5 to 17 Correlation Summary
| Measurement | Czechoslovakian Data | Disability Age 5 to 17 Data |
| Minimum | 0.078% | 1.1% |
| Maximum | 32.4% | 27.3% |
| Range | 32.3% | 26.2% |
| Mean | 6.5% | 8.7% |
| Median | 4.7% | 6.8% |
| Interquartile 25% (IQ1) | 2.4% | 5.6% |
| Interquartile 75% (IQ3) | 7.1% | 10.3% |
| Interquartile Range (IQR) | 4.7% | 4.7% |
| Standard Deviation (Sample) | 6.5% | 6.0% |
| Standard Deviation (Population) | 6.4% | 5.9% |
Correlation Details
| Czechoslovakian Percentile | Sample Size | Disability Age 5 to 17 |
[ 0.0% - 0.5% ] 0.078% | 328,226,452 | 5.8% |
[ 0.0% - 0.5% ] 0.34% | 27,487,177 | 6.0% |
[ 0.5% - 1.0% ] 0.60% | 6,179,675 | 6.1% |
[ 0.5% - 1.0% ] 0.85% | 1,859,604 | 6.1% |
[ 1.0% - 1.5% ] 1.11% | 624,624 | 6.5% |
[ 1.0% - 1.5% ] 1.36% | 414,041 | 7.8% |
[ 1.5% - 2.0% ] 1.61% | 212,731 | 7.0% |
[ 1.5% - 2.0% ] 1.88% | 115,043 | 6.5% |
[ 2.0% - 2.5% ] 2.13% | 30,911 | 6.9% |
[ 2.0% - 2.5% ] 2.36% | 29,714 | 10.9% |
[ 2.5% - 3.0% ] 2.56% | 43,127 | 7.1% |
[ 2.5% - 3.0% ] 2.90% | 26,304 | 8.8% |
[ 3.0% - 3.5% ] 3.08% | 15,719 | 6.9% |
[ 3.0% - 3.5% ] 3.41% | 23,733 | 6.7% |
[ 3.5% - 4.0% ] 3.66% | 19,592 | 3.8% |
[ 3.5% - 4.0% ] 3.94% | 10,783 | 5.3% |
[ 4.0% - 4.5% ] 4.09% | 14,207 | 6.7% |
[ 4.0% - 4.5% ] 4.39% | 5,012 | 6.9% |
[ 4.5% - 5.0% ] 4.68% | 2,883 | 14.4% |
[ 4.5% - 5.0% ] 4.80% | 3,065 | 4.4% |
[ 5.0% - 5.5% ] 5.18% | 5,831 | 12.3% |
[ 5.0% - 5.5% ] 5.32% | 2,988 | 5.6% |
[ 5.5% - 6.0% ] 5.63% | 2,538 | 4.7% |
[ 5.5% - 6.0% ] 5.77% | 710 | 17.5% |
[ 6.0% - 6.5% ] 6.25% | 112 | 27.3% |
[ 6.0% - 6.5% ] 6.46% | 1,903 | 6.2% |
[ 6.5% - 7.0% ] 6.68% | 1,975 | 20.7% |
[ 6.5% - 7.0% ] 6.81% | 999 | 9.3% |
[ 7.0% - 7.5% ] 7.11% | 211 | 1.8% |
[ 8.0% - 8.5% ] 8.48% | 1,886 | 2.9% |
[ 9.5% - 10.0% ] 9.74% | 154 | 27.3% |
[ 10.0% - 10.5% ] 10.50% | 1,810 | 9.7% |
[ 11.0% - 11.5% ] 11.39% | 395 | 1.1% |
[ 13.0% - 13.5% ] 13.50% | 526 | 4.9% |
[ 16.5% - 17.0% ] 16.92% | 591 | 13.0% |
[ 17.0% - 17.5% ] 17.09% | 515 | 2.8% |
[ 20.0% - 20.5% ] 20.45% | 489 | 10.3% |
[ 32.0% - 32.5% ] 32.42% | 219 | 13.3% |