Filipino Disability Age 5 to 17
COMPARE
Filipino
Select to Compare
Disability Age 5 to 17
Filipino Disability Age 5 to 17
4.3%
DISABILITY | AGE 5 TO 17
100.0/ 100
METRIC RATING
4th/ 347
METRIC RANK
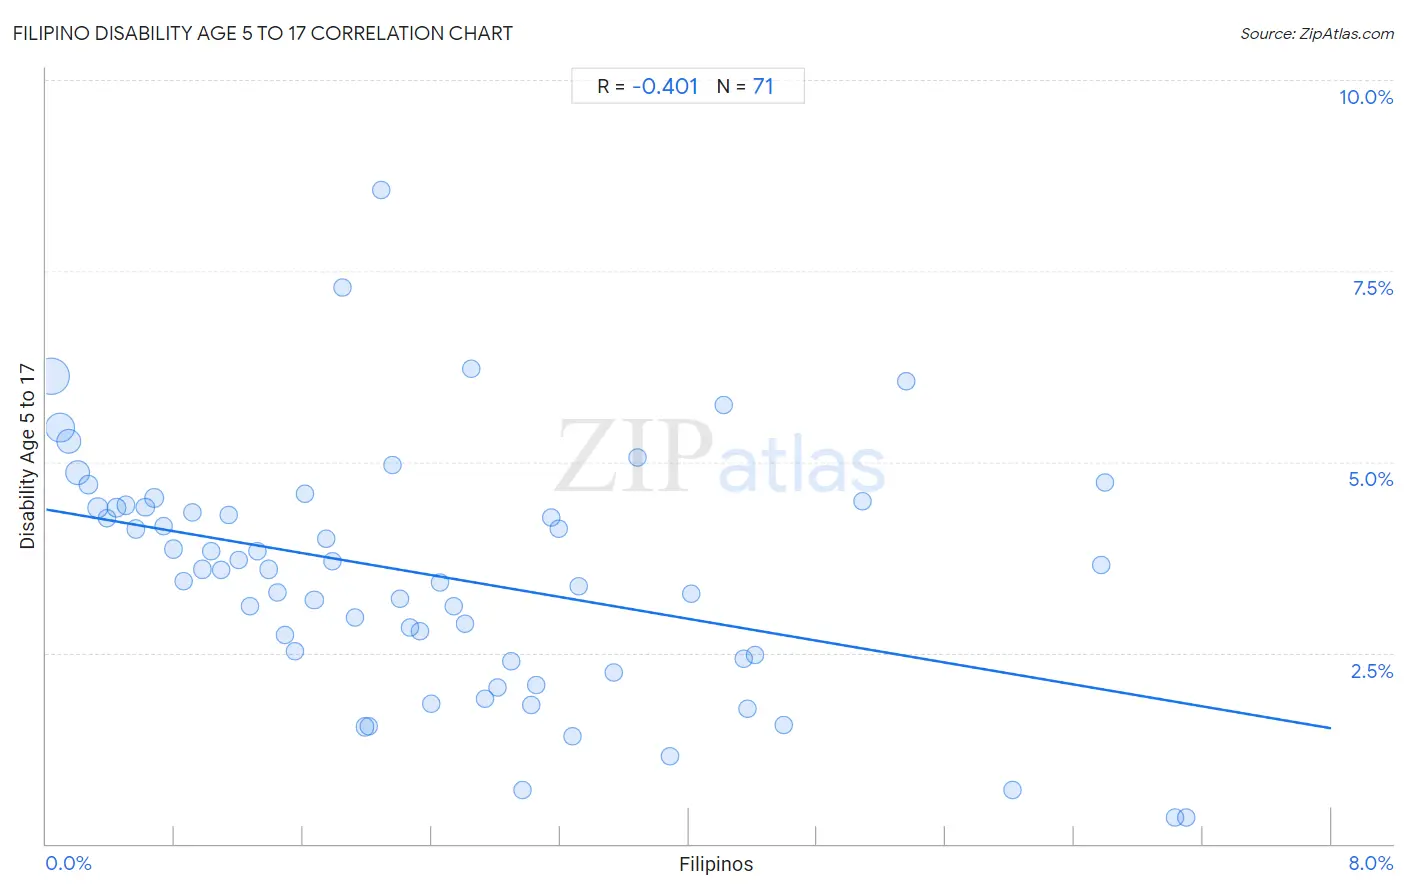
Filipino Disability Age 5 to 17 Correlation Chart
The statistical analysis conducted on geographies consisting of 252,749,920 people shows a moderate negative correlation between the proportion of Filipinos and percentage of population with a disability between the ages 5 and 17 in the United States with a correlation coefficient (R) of -0.401 and weighted average of 4.3%. On average, for every 1% (one percent) increase in Filipinos within a typical geography, there is a decrease of 0.36% in percentage of population with a disability between the ages 5 and 17.
It is essential to understand that the correlation between the percentage of Filipinos and percentage of population with a disability between the ages 5 and 17 does not imply a direct cause-and-effect relationship. It remains uncertain whether the presence of Filipinos influences an upward or downward trend in the level of percentage of population with a disability between the ages 5 and 17 within an area, or if Filipinos simply ended up residing in those areas with higher or lower levels of percentage of population with a disability between the ages 5 and 17 due to other factors.
Demographics Similar to Filipinos by Disability Age 5 to 17
In terms of disability age 5 to 17, the demographic groups most similar to Filipinos are Immigrants from Iran (4.4%, a difference of 0.55%), Immigrants from Hong Kong (4.3%, a difference of 1.0%), Immigrants from Taiwan (4.2%, a difference of 3.5%), Immigrants from Israel (4.5%, a difference of 4.0%), and Immigrants from China (4.5%, a difference of 4.3%).
| Demographics | Rating | Rank | Disability Age 5 to 17 |
| Immigrants from Armenia | 100.0 /100 | #1 | Exceptional 4.1% |
| Immigrants from Taiwan | 100.0 /100 | #2 | Exceptional 4.2% |
| Immigrants from Hong Kong | 100.0 /100 | #3 | Exceptional 4.3% |
| Filipinos | 100.0 /100 | #4 | Exceptional 4.3% |
| Immigrants from Iran | 100.0 /100 | #5 | Exceptional 4.4% |
| Immigrants from Israel | 100.0 /100 | #6 | Exceptional 4.5% |
| Immigrants from China | 100.0 /100 | #7 | Exceptional 4.5% |
| Indians (Asian) | 100.0 /100 | #8 | Exceptional 4.6% |
| Immigrants from Eastern Asia | 100.0 /100 | #9 | Exceptional 4.6% |
| Immigrants from India | 100.0 /100 | #10 | Exceptional 4.6% |
| Armenians | 100.0 /100 | #11 | Exceptional 4.6% |
| Iranians | 100.0 /100 | #12 | Exceptional 4.6% |
| Thais | 100.0 /100 | #13 | Exceptional 4.7% |
| Immigrants from Korea | 100.0 /100 | #14 | Exceptional 4.7% |
| Chinese | 100.0 /100 | #15 | Exceptional 4.7% |
Filipino Disability Age 5 to 17 Correlation Summary
| Measurement | Filipino Data | Disability Age 5 to 17 Data |
| Minimum | 0.030% | 0.35% |
| Maximum | 7.1% | 8.6% |
| Range | 7.1% | 8.2% |
| Mean | 2.4% | 3.5% |
| Median | 2.1% | 3.6% |
| Interquartile 25% (IQ1) | 1.0% | 2.4% |
| Interquartile 75% (IQ3) | 3.3% | 4.4% |
| Interquartile Range (IQR) | 2.3% | 2.0% |
| Standard Deviation (Sample) | 1.8% | 1.6% |
| Standard Deviation (Population) | 1.8% | 1.6% |
Correlation Details
| Filipino Percentile | Sample Size | Disability Age 5 to 17 |
[ 0.0% - 0.5% ] 0.030% | 89,078,207 | 6.1% |
[ 0.0% - 0.5% ] 0.084% | 52,447,245 | 5.5% |
[ 0.0% - 0.5% ] 0.14% | 29,363,407 | 5.3% |
[ 0.0% - 0.5% ] 0.20% | 27,958,771 | 4.9% |
[ 0.0% - 0.5% ] 0.26% | 9,342,253 | 4.7% |
[ 0.0% - 0.5% ] 0.32% | 9,214,509 | 4.4% |
[ 0.0% - 0.5% ] 0.38% | 5,077,004 | 4.3% |
[ 0.0% - 0.5% ] 0.44% | 3,821,077 | 4.4% |
[ 0.0% - 0.5% ] 0.49% | 3,578,685 | 4.4% |
[ 0.5% - 1.0% ] 0.56% | 3,738,327 | 4.1% |
[ 0.5% - 1.0% ] 0.62% | 2,863,336 | 4.4% |
[ 0.5% - 1.0% ] 0.67% | 1,753,374 | 4.5% |
[ 0.5% - 1.0% ] 0.73% | 1,470,221 | 4.2% |
[ 0.5% - 1.0% ] 0.79% | 2,702,888 | 3.9% |
[ 0.5% - 1.0% ] 0.86% | 956,142 | 3.4% |
[ 0.5% - 1.0% ] 0.91% | 773,461 | 4.3% |
[ 0.5% - 1.0% ] 0.97% | 751,916 | 3.6% |
[ 1.0% - 1.5% ] 1.03% | 632,419 | 3.8% |
[ 1.0% - 1.5% ] 1.09% | 1,005,227 | 3.6% |
[ 1.0% - 1.5% ] 1.14% | 318,787 | 4.3% |
[ 1.0% - 1.5% ] 1.20% | 339,507 | 3.7% |
[ 1.0% - 1.5% ] 1.27% | 543,965 | 3.1% |
[ 1.0% - 1.5% ] 1.32% | 616,738 | 3.8% |
[ 1.0% - 1.5% ] 1.39% | 361,267 | 3.6% |
[ 1.0% - 1.5% ] 1.44% | 325,728 | 3.3% |
[ 1.0% - 1.5% ] 1.49% | 234,762 | 2.7% |
[ 1.5% - 2.0% ] 1.55% | 172,948 | 2.5% |
[ 1.5% - 2.0% ] 1.61% | 238,584 | 4.6% |
[ 1.5% - 2.0% ] 1.67% | 251,325 | 3.2% |
[ 1.5% - 2.0% ] 1.74% | 71,805 | 4.0% |
[ 1.5% - 2.0% ] 1.78% | 367,033 | 3.7% |
[ 1.5% - 2.0% ] 1.85% | 9,696 | 7.3% |
[ 1.5% - 2.0% ] 1.92% | 183,192 | 3.0% |
[ 1.5% - 2.0% ] 1.98% | 138,170 | 1.5% |
[ 2.0% - 2.5% ] 2.01% | 21,527 | 1.5% |
[ 2.0% - 2.5% ] 2.08% | 7,007 | 8.6% |
[ 2.0% - 2.5% ] 2.15% | 55,974 | 5.0% |
[ 2.0% - 2.5% ] 2.20% | 27,784 | 3.2% |
[ 2.0% - 2.5% ] 2.27% | 73,445 | 2.8% |
[ 2.0% - 2.5% ] 2.33% | 419,897 | 2.8% |
[ 2.0% - 2.5% ] 2.40% | 5,999 | 1.8% |
[ 2.0% - 2.5% ] 2.45% | 186,770 | 3.4% |
[ 2.5% - 3.0% ] 2.54% | 42,134 | 3.1% |
[ 2.5% - 3.0% ] 2.60% | 113,348 | 2.9% |
[ 2.5% - 3.0% ] 2.65% | 27,409 | 6.2% |
[ 2.5% - 3.0% ] 2.74% | 68,329 | 1.9% |
[ 2.5% - 3.0% ] 2.81% | 59,763 | 2.0% |
[ 2.5% - 3.0% ] 2.90% | 55,404 | 2.4% |
[ 2.5% - 3.0% ] 2.96% | 7,388 | 0.71% |
[ 3.0% - 3.5% ] 3.02% | 93,858 | 1.8% |
[ 3.0% - 3.5% ] 3.05% | 80,704 | 2.1% |
[ 3.0% - 3.5% ] 3.14% | 34,381 | 4.3% |
[ 3.0% - 3.5% ] 3.19% | 33,517 | 4.1% |
[ 3.0% - 3.5% ] 3.28% | 9,677 | 1.4% |
[ 3.0% - 3.5% ] 3.32% | 31,335 | 3.4% |
[ 3.5% - 4.0% ] 3.54% | 24,041 | 2.2% |
[ 3.5% - 4.0% ] 3.68% | 54,534 | 5.1% |
[ 3.5% - 4.0% ] 3.88% | 53,464 | 1.1% |
[ 4.0% - 4.5% ] 4.01% | 89,154 | 3.3% |
[ 4.0% - 4.5% ] 4.22% | 31,986 | 5.7% |
[ 4.0% - 4.5% ] 4.34% | 61,110 | 2.4% |
[ 4.0% - 4.5% ] 4.36% | 28,212 | 1.8% |
[ 4.0% - 4.5% ] 4.41% | 54,484 | 2.5% |
[ 4.5% - 5.0% ] 4.59% | 47,209 | 1.6% |
[ 5.0% - 5.5% ] 5.09% | 57,536 | 4.5% |
[ 5.0% - 5.5% ] 5.35% | 56,181 | 6.1% |
[ 6.0% - 6.5% ] 6.02% | 1,280 | 0.70% |
[ 6.5% - 7.0% ] 6.57% | 4,463 | 3.7% |
[ 6.5% - 7.0% ] 6.60% | 3,639 | 4.7% |
[ 7.0% - 7.5% ] 7.03% | 12,559 | 0.35% |
[ 7.0% - 7.5% ] 7.10% | 12,442 | 0.35% |