Indonesian Disability Age 5 to 17

COMPARE

Indonesian
Race
Ancestry
AfghanAfricanAlaska NativeAlaskan AthabascanAlbanianAleutAlsatianAmericanApacheArabArapahoArgentineanArmenianAssyrian/Chaldean/SyriacAustralianAustrianBahamianBangladeshiBarbadianBasqueBelgianBelizeanBermudanBhutaneseBlackfeetBolivianBrazilianBritishBritish West IndianBulgarianBurmeseCajunCambodianCanadianCape VerdeanCarpatho RusynCelticCentral AmericanCentral American IndianCherokeeCheyenneChickasawChileanChineseChippewaChoctawColombianColvilleComancheCosta RicanCreeCreekCroatianCrowCubanCypriotCzechCzechoslovakianDanishDelawareDominicanDutchDutch West IndianEastern EuropeanEcuadorianEgyptianEnglishEstonianEthiopianEuropeanFijianFilipinoFinnishFrenchFrench American IndianFrench CanadianGermanGerman RussianGhanaianGreekGuamanian/ChamorroGuatemalanGuyaneseHaitianHmongHonduranHopiHoumaHungarianIcelanderIndian (Asian)IndonesianInupiatIranianIraqiIrishIroquoisIsraeliItalianJamaicanJapaneseJordanianKenyanKiowaKoreanLaotianLatvianLebaneseLiberianLithuanianLumbeeLuxembourgerMacedonianMalaysianMalteseMarshalleseMenomineeMexicanMexican American IndianMongolianMoroccanNative HawaiianNavajoNepaleseNew ZealanderNicaraguanNigerianNorthern EuropeanNorwegianOkinawanOsageOttawaPaiutePakistaniPalestinianPanamanianParaguayanPennsylvania GermanPeruvianPimaPolishPortuguesePotawatomiPuebloPuerto RicanPuget Sound SalishRomanianRussianSalvadoranSamoanScandinavianScotch-IrishScottishSeminoleSenegaleseSerbianShoshoneSierra LeoneanSiouxSlavicSlovakSloveneSomaliSouth AfricanSouth AmericanSouth American IndianSoviet UnionSpaniardSpanishSpanish AmericanSpanish American IndianSri LankanSubsaharan AfricanSudaneseSwedishSwissSyrianTaiwaneseThaiTlingit-HaidaTohono O'OdhamTonganTrinidadian and TobagonianTsimshianTurkishU.S. Virgin IslanderUgandanUkrainianUruguayanUteVenezuelanVietnameseWelshWest IndianYakamaYaquiYugoslavianYumanYup'ikZimbabwean
Immigration
NonimmigrantsImmigrantsAfghanistanAfricaAlbaniaArgentinaArmeniaAsiaAustraliaAustriaBahamasBangladeshBarbadosBelarusBelgiumBelizeBoliviaBosnia and HerzegovinaBrazilBulgariaBurma/MyanmarCabo VerdeCambodiaCameroonCanadaCaribbeanCentral AmericaChileChinaColombiaCongoCosta RicaCroatiaCubaCzechoslovakiaDenmarkDominicaDominican RepublicEastern AfricaEastern AsiaEastern EuropeEcuadorEgyptEl SalvadorEnglandEritreaEthiopiaEuropeFijiFranceGermanyGhanaGreeceGrenadaGuatemalaGuyanaHaitiHondurasHong KongHungaryIndiaIndonesiaIranIraqIrelandIsraelItalyJamaicaJapanJordanKazakhstanKenyaKoreaKuwaitLaosLatin AmericaLatviaLebanonLiberiaLithuaniaMalaysiaMexicoMicronesiaMiddle AfricaMoldovaMoroccoNepalNetherlandsNicaraguaNigeriaNorth AmericaNorth MacedoniaNorthern AfricaNorthern EuropeNorwayOceaniaPakistanPanamaPeruPhilippinesPolandPortugalRomaniaRussiaSaudi ArabiaScotlandSenegalSerbiaSierra LeoneSingaporeSomaliaSouth AfricaSouth AmericaSouth Central AsiaSouth Eastern AsiaSouthern EuropeSpainSri LankaSt. Vincent and the GrenadinesSudanSwedenSwitzerlandSyriaTaiwanThailandTrinidad and TobagoTurkeyUgandaUkraineUruguayUzbekistanVenezuelaVietnamWest IndiesWestern AfricaWestern AsiaWestern EuropeYemenZaireZimbabweAzores
Select to Compare
Race
Ancestry
AfghanAfricanAlaska NativeAlaskan AthabascanAlbanianAleutAlsatianAmericanApacheArabArapahoArgentineanArmenianAssyrian/Chaldean/SyriacAustralianAustrianBahamianBangladeshiBarbadianBasqueBelgianBelizeanBermudanBhutaneseBlackfeetBolivianBrazilianBritishBritish West IndianBulgarianBurmeseCajunCambodianCanadianCape VerdeanCarpatho RusynCelticCentral AmericanCentral American IndianCherokeeCheyenneChickasawChileanChineseChippewaChoctawColombianColvilleComancheCosta RicanCreeCreekCroatianCrowCubanCypriotCzechCzechoslovakianDanishDelawareDominicanDutchDutch West IndianEastern EuropeanEcuadorianEgyptianEnglishEstonianEthiopianEuropeanFijianFilipinoFinnishFrenchFrench American IndianFrench CanadianGermanGerman RussianGhanaianGreekGuamanian/ChamorroGuatemalanGuyaneseHaitianHmongHonduranHopiHoumaHungarianIcelanderIndian (Asian)InupiatIranianIraqiIrishIroquoisIsraeliItalianJamaicanJapaneseJordanianKenyanKiowaKoreanLaotianLatvianLebaneseLiberianLithuanianLumbeeLuxembourgerMacedonianMalaysianMalteseMarshalleseMenomineeMexicanMexican American IndianMongolianMoroccanNative HawaiianNavajoNepaleseNew ZealanderNicaraguanNigerianNorthern EuropeanNorwegianOkinawanOsageOttawaPaiutePakistaniPalestinianPanamanianParaguayanPennsylvania GermanPeruvianPimaPolishPortuguesePotawatomiPuebloPuerto RicanPuget Sound SalishRomanianRussianSalvadoranSamoanScandinavianScotch-IrishScottishSeminoleSenegaleseSerbianShoshoneSierra LeoneanSiouxSlavicSlovakSloveneSomaliSouth AfricanSouth AmericanSouth American IndianSoviet UnionSpaniardSpanishSpanish AmericanSpanish American IndianSri LankanSubsaharan AfricanSudaneseSwedishSwissSyrianTaiwaneseThaiTlingit-HaidaTohono O'OdhamTonganTrinidadian and TobagonianTsimshianTurkishU.S. Virgin IslanderUgandanUkrainianUruguayanUteVenezuelanVietnameseWelshWest IndianYakamaYaquiYugoslavianYumanYup'ikZimbabwean
Immigration
NonimmigrantsImmigrantsAfghanistanAfricaAlbaniaArgentinaArmeniaAsiaAustraliaAustriaBahamasBangladeshBarbadosBelarusBelgiumBelizeBoliviaBosnia and HerzegovinaBrazilBulgariaBurma/MyanmarCabo VerdeCambodiaCameroonCanadaCaribbeanCentral AmericaChileChinaColombiaCongoCosta RicaCroatiaCubaCzechoslovakiaDenmarkDominicaDominican RepublicEastern AfricaEastern AsiaEastern EuropeEcuadorEgyptEl SalvadorEnglandEritreaEthiopiaEuropeFijiFranceGermanyGhanaGreeceGrenadaGuatemalaGuyanaHaitiHondurasHong KongHungaryIndiaIndonesiaIranIraqIrelandIsraelItalyJamaicaJapanJordanKazakhstanKenyaKoreaKuwaitLaosLatin AmericaLatviaLebanonLiberiaLithuaniaMalaysiaMexicoMicronesiaMiddle AfricaMoldovaMoroccoNepalNetherlandsNicaraguaNigeriaNorth AmericaNorth MacedoniaNorthern AfricaNorthern EuropeNorwayOceaniaPakistanPanamaPeruPhilippinesPolandPortugalRomaniaRussiaSaudi ArabiaScotlandSenegalSerbiaSierra LeoneSingaporeSomaliaSouth AfricaSouth AmericaSouth Central AsiaSouth Eastern AsiaSouthern EuropeSpainSri LankaSt. Vincent and the GrenadinesSudanSwedenSwitzerlandSyriaTaiwanThailandTrinidad and TobagoTurkeyUgandaUkraineUruguayUzbekistanVenezuelaVietnamWest IndiesWestern AfricaWestern AsiaWestern EuropeYemenZaireZimbabweAzores
Disability Age 5 to 17
Income
Poverty
Unemployment
Labor Participation
Family Structure
Vehicle Availability
Education Level
Disability

Indonesian Disability Age 5 to 17
Tragic

5.9%
DISABILITY | AGE 5 TO 17
2.0/ 100
METRIC RATING
243rd/ 347
METRIC RANK

Indonesian Disability Age 5 to 17 Correlation Chart

The statistical analysis conducted on geographies consisting of 162,352,811 people shows a poor negative correlation between the proportion of Indonesians and percentage of population with a disability between the ages 5 and 17 in the United States with a correlation coefficient (R) of -0.156 and weighted average of 5.9%. On average, for every 1% (one percent) increase in Indonesians within a typical geography, there is a decrease of 0.063% in percentage of population with a disability between the ages 5 and 17.
Indonesian Disability Age 5 to 17
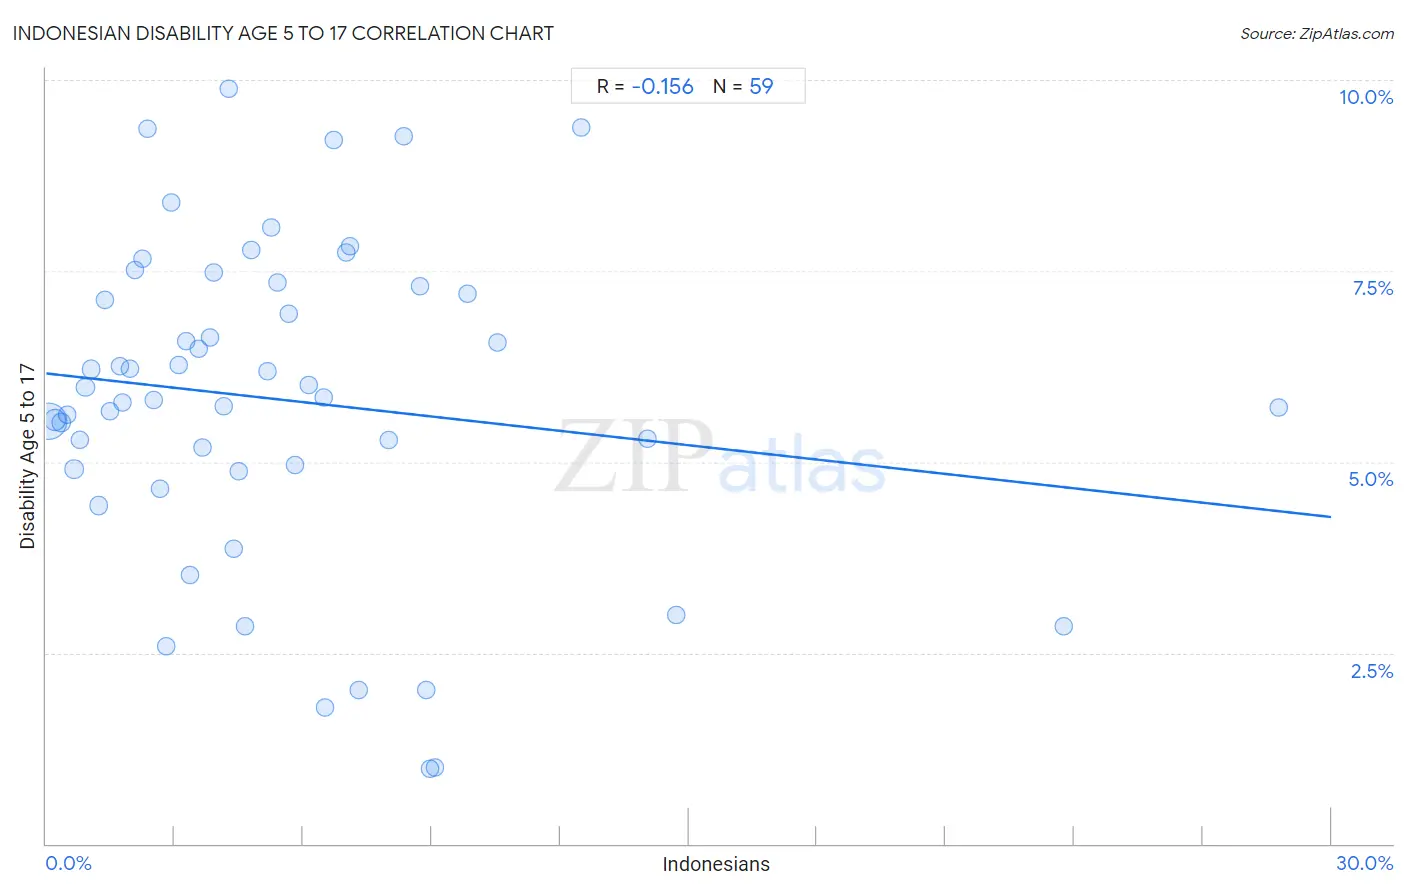
It is essential to understand that the correlation between the percentage of Indonesians and percentage of population with a disability between the ages 5 and 17 does not imply a direct cause-and-effect relationship. It remains uncertain whether the presence of Indonesians influences an upward or downward trend in the level of percentage of population with a disability between the ages 5 and 17 within an area, or if Indonesians simply ended up residing in those areas with higher or lower levels of percentage of population with a disability between the ages 5 and 17 due to other factors.

Demographics Similar to Indonesians by Disability Age 5 to 17

In terms of disability age 5 to 17, the demographic groups most similar to Indonesians are Spaniard (5.9%, a difference of 0.010%), Immigrants from Germany (5.9%, a difference of 0.060%), Immigrants from Micronesia (5.9%, a difference of 0.060%), Tlingit-Haida (5.9%, a difference of 0.060%), and Immigrants from Caribbean (5.9%, a difference of 0.090%).
DemographicsRating | RankDisability Age 5 to 17
Immigrants from Brazil
3.2
/100
|
#236
Tragic
5.8%
Sudanese
2.9
/100
|
#237
Tragic
5.8%
Hungarians
2.6
/100
|
#238
Tragic
5.8%
German Russians
2.4
/100
|
#239
Tragic
5.9%
West Indians
2.4
/100
|
#240
Tragic
5.9%
Immigrants from Caribbean
2.1
/100
|
#241
Tragic
5.9%
Spaniards
2.0
/100
|
#242
Tragic
5.9%
Indonesians
2.0
/100
|
#243
Tragic
5.9%
Immigrants from Germany
1.9
/100
|
#244
Tragic
5.9%
Immigrants from Micronesia
1.9
/100
|
#245
Tragic
5.9%
Tlingit-Haida
1.9
/100
|
#246
Tragic
5.9%
Immigrants from Honduras
1.8
/100
|
#247
Tragic
5.9%
British
1.7
/100
|
#248
Tragic
5.9%
Immigrants from Ghana
1.7
/100
|
#249
Tragic
5.9%
Poles
1.5
/100
|
#250
Tragic
5.9%

Indonesian Disability Age 5 to 17 Correlation Summary

MeasurementIndonesian DataDisability Age 5 to 17 Data
Minimum0.052%0.98%
Maximum28.8%9.9%
Range28.7%8.9%
Mean5.5%5.8%
Median4.2%5.8%
Interquartile 25% (IQ1)2.1%4.9%
Interquartile 75% (IQ3)7.1%7.3%
Interquartile Range (IQR)5.0%2.4%
Standard Deviation (Sample)5.2%2.1%
Standard Deviation (Population)5.2%2.1%

Correlation Details

Indonesian PercentileSample SizeDisability Age 5 to 17
[
0.0%
-
0.5%
]
0.052%
112,274,4975.5%
[
0.0%
-
0.5%
]
0.20%
22,999,0495.6%
[
0.0%
-
0.5%
]
0.35%
7,723,4635.5%
[
0.0%
-
0.5%
]
0.49%
3,594,2575.6%
[
0.5%
-
1.0%
]
0.65%
2,564,0474.9%
[
0.5%
-
1.0%
]
0.79%
2,001,0325.3%
[
0.5%
-
1.0%
]
0.92%
2,183,0026.0%
[
1.0%
-
1.5%
]
1.06%
1,351,0606.2%
[
1.0%
-
1.5%
]
1.23%
619,4314.4%
[
1.0%
-
1.5%
]
1.38%
1,123,6077.1%
[
1.0%
-
1.5%
]
1.48%
502,4295.7%
[
1.5%
-
2.0%
]
1.71%
1,143,8356.3%
[
1.5%
-
2.0%
]
1.79%
333,0905.8%
[
1.5%
-
2.0%
]
1.95%
590,4826.2%
[
2.0%
-
2.5%
]
2.09%
250,4717.5%
[
2.0%
-
2.5%
]
2.24%
205,8547.7%
[
2.0%
-
2.5%
]
2.37%
177,5239.4%
[
2.5%
-
3.0%
]
2.51%
107,8235.8%
[
2.5%
-
3.0%
]
2.66%
338,4164.7%
[
2.5%
-
3.0%
]
2.81%
125,8212.6%
[
2.5%
-
3.0%
]
2.92%
27,7098.4%
[
3.0%
-
3.5%
]
3.09%
100,4066.3%
[
3.0%
-
3.5%
]
3.27%
637,4706.6%
[
3.0%
-
3.5%
]
3.34%
46,9233.5%
[
3.5%
-
4.0%
]
3.55%
84,7066.5%
[
3.5%
-
4.0%
]
3.66%
124,6095.2%
[
3.5%
-
4.0%
]
3.82%
73,3436.6%
[
3.5%
-
4.0%
]
3.90%
26,8967.5%
[
4.0%
-
4.5%
]
4.14%
41,2355.7%
[
4.0%
-
4.5%
]
4.25%
72,6439.9%
[
4.0%
-
4.5%
]
4.38%
86,6883.9%
[
4.0%
-
4.5%
]
4.50%
37,0684.9%
[
4.5%
-
5.0%
]
4.64%
25,8722.8%
[
4.5%
-
5.0%
]
4.79%
45,1367.8%
[
5.0%
-
5.5%
]
5.17%
2,3216.2%
[
5.0%
-
5.5%
]
5.25%
52,3848.1%
[
5.0%
-
5.5%
]
5.40%
31,9767.3%
[
5.5%
-
6.0%
]
5.66%
125,6976.9%
[
5.5%
-
6.0%
]
5.82%
50,0355.0%
[
6.0%
-
6.5%
]
6.14%
79,8806.0%
[
6.0%
-
6.5%
]
6.47%
14,5535.8%
[
6.0%
-
6.5%
]
6.50%
15,8991.8%
[
6.5%
-
7.0%
]
6.70%
26,6849.2%
[
6.5%
-
7.0%
]
6.99%
25,6997.7%
[
7.0%
-
7.5%
]
7.11%
23,9807.8%
[
7.0%
-
7.5%
]
7.29%
14,1792.0%
[
7.5%
-
8.0%
]
8.00%
40,1525.3%
[
8.0%
-
8.5%
]
8.35%
24,6849.3%
[
8.5%
-
9.0%
]
8.71%
1,3777.3%
[
8.5%
-
9.0%
]
8.87%
2,0292.0%
[
8.5%
-
9.0%
]
8.97%
3,0550.98%
[
9.0%
-
9.5%
]
9.08%
3,0190.99%
[
9.5%
-
10.0%
]
9.84%
37,8347.2%
[
10.5%
-
11.0%
]
10.54%
56,7946.6%
[
12.0%
-
12.5%
]
12.48%
19,6139.4%
[
14.0%
-
14.5%
]
14.02%
19,5015.3%
[
14.5%
-
15.0%
]
14.70%
39,0823.0%
[
23.5%
-
24.0%
]
23.75%
2,0882.8%
[
28.5%
-
29.0%
]
28.78%
4035.7%