Carpatho Rusyn Disability Age 5 to 17

COMPARE

Carpatho Rusyn
Race
Ancestry
AfghanAfricanAlaska NativeAlaskan AthabascanAlbanianAleutAlsatianAmericanApacheArabArapahoArgentineanArmenianAssyrian/Chaldean/SyriacAustralianAustrianBahamianBangladeshiBarbadianBasqueBelgianBelizeanBermudanBhutaneseBlackfeetBolivianBrazilianBritishBritish West IndianBulgarianBurmeseCajunCambodianCanadianCape VerdeanCarpatho RusynCelticCentral AmericanCentral American IndianCherokeeCheyenneChickasawChileanChineseChippewaChoctawColombianColvilleComancheCosta RicanCreeCreekCroatianCrowCubanCypriotCzechCzechoslovakianDanishDelawareDominicanDutchDutch West IndianEastern EuropeanEcuadorianEgyptianEnglishEstonianEthiopianEuropeanFijianFilipinoFinnishFrenchFrench American IndianFrench CanadianGermanGerman RussianGhanaianGreekGuamanian/ChamorroGuatemalanGuyaneseHaitianHmongHonduranHopiHoumaHungarianIcelanderIndian (Asian)IndonesianInupiatIranianIraqiIrishIroquoisIsraeliItalianJamaicanJapaneseJordanianKenyanKiowaKoreanLaotianLatvianLebaneseLiberianLithuanianLumbeeLuxembourgerMacedonianMalaysianMalteseMarshalleseMenomineeMexicanMexican American IndianMongolianMoroccanNative HawaiianNavajoNepaleseNew ZealanderNicaraguanNigerianNorthern EuropeanNorwegianOkinawanOsageOttawaPaiutePakistaniPalestinianPanamanianParaguayanPennsylvania GermanPeruvianPimaPolishPortuguesePotawatomiPuebloPuerto RicanPuget Sound SalishRomanianRussianSalvadoranSamoanScandinavianScotch-IrishScottishSeminoleSenegaleseSerbianShoshoneSierra LeoneanSiouxSlavicSlovakSloveneSomaliSouth AfricanSouth AmericanSouth American IndianSoviet UnionSpaniardSpanishSpanish AmericanSpanish American IndianSri LankanSubsaharan AfricanSudaneseSwedishSwissSyrianTaiwaneseThaiTlingit-HaidaTohono O'OdhamTonganTrinidadian and TobagonianTsimshianTurkishU.S. Virgin IslanderUgandanUkrainianUruguayanUteVenezuelanVietnameseWelshWest IndianYakamaYaquiYugoslavianYumanYup'ikZimbabwean
Immigration
NonimmigrantsImmigrantsAfghanistanAfricaAlbaniaArgentinaArmeniaAsiaAustraliaAustriaBahamasBangladeshBarbadosBelarusBelgiumBelizeBoliviaBosnia and HerzegovinaBrazilBulgariaBurma/MyanmarCabo VerdeCambodiaCameroonCanadaCaribbeanCentral AmericaChileChinaColombiaCongoCosta RicaCroatiaCubaCzechoslovakiaDenmarkDominicaDominican RepublicEastern AfricaEastern AsiaEastern EuropeEcuadorEgyptEl SalvadorEnglandEritreaEthiopiaEuropeFijiFranceGermanyGhanaGreeceGrenadaGuatemalaGuyanaHaitiHondurasHong KongHungaryIndiaIndonesiaIranIraqIrelandIsraelItalyJamaicaJapanJordanKazakhstanKenyaKoreaKuwaitLaosLatin AmericaLatviaLebanonLiberiaLithuaniaMalaysiaMexicoMicronesiaMiddle AfricaMoldovaMoroccoNepalNetherlandsNicaraguaNigeriaNorth AmericaNorth MacedoniaNorthern AfricaNorthern EuropeNorwayOceaniaPakistanPanamaPeruPhilippinesPolandPortugalRomaniaRussiaSaudi ArabiaScotlandSenegalSerbiaSierra LeoneSingaporeSomaliaSouth AfricaSouth AmericaSouth Central AsiaSouth Eastern AsiaSouthern EuropeSpainSri LankaSt. Vincent and the GrenadinesSudanSwedenSwitzerlandSyriaTaiwanThailandTrinidad and TobagoTurkeyUgandaUkraineUruguayUzbekistanVenezuelaVietnamWest IndiesWestern AfricaWestern AsiaWestern EuropeYemenZaireZimbabweAzores
Select to Compare
Race
Ancestry
AfghanAfricanAlaska NativeAlaskan AthabascanAlbanianAleutAlsatianAmericanApacheArabArapahoArgentineanArmenianAssyrian/Chaldean/SyriacAustralianAustrianBahamianBangladeshiBarbadianBasqueBelgianBelizeanBermudanBhutaneseBlackfeetBolivianBrazilianBritishBritish West IndianBulgarianBurmeseCajunCambodianCanadianCape VerdeanCelticCentral AmericanCentral American IndianCherokeeCheyenneChickasawChileanChineseChippewaChoctawColombianColvilleComancheCosta RicanCreeCreekCroatianCrowCubanCypriotCzechCzechoslovakianDanishDelawareDominicanDutchDutch West IndianEastern EuropeanEcuadorianEgyptianEnglishEstonianEthiopianEuropeanFijianFilipinoFinnishFrenchFrench American IndianFrench CanadianGermanGerman RussianGhanaianGreekGuamanian/ChamorroGuatemalanGuyaneseHaitianHmongHonduranHopiHoumaHungarianIcelanderIndian (Asian)IndonesianInupiatIranianIraqiIrishIroquoisIsraeliItalianJamaicanJapaneseJordanianKenyanKiowaKoreanLaotianLatvianLebaneseLiberianLithuanianLumbeeLuxembourgerMacedonianMalaysianMalteseMarshalleseMenomineeMexicanMexican American IndianMongolianMoroccanNative HawaiianNavajoNepaleseNew ZealanderNicaraguanNigerianNorthern EuropeanNorwegianOkinawanOsageOttawaPaiutePakistaniPalestinianPanamanianParaguayanPennsylvania GermanPeruvianPimaPolishPortuguesePotawatomiPuebloPuerto RicanPuget Sound SalishRomanianRussianSalvadoranSamoanScandinavianScotch-IrishScottishSeminoleSenegaleseSerbianShoshoneSierra LeoneanSiouxSlavicSlovakSloveneSomaliSouth AfricanSouth AmericanSouth American IndianSoviet UnionSpaniardSpanishSpanish AmericanSpanish American IndianSri LankanSubsaharan AfricanSudaneseSwedishSwissSyrianTaiwaneseThaiTlingit-HaidaTohono O'OdhamTonganTrinidadian and TobagonianTsimshianTurkishU.S. Virgin IslanderUgandanUkrainianUruguayanUteVenezuelanVietnameseWelshWest IndianYakamaYaquiYugoslavianYumanYup'ikZimbabwean
Immigration
NonimmigrantsImmigrantsAfghanistanAfricaAlbaniaArgentinaArmeniaAsiaAustraliaAustriaBahamasBangladeshBarbadosBelarusBelgiumBelizeBoliviaBosnia and HerzegovinaBrazilBulgariaBurma/MyanmarCabo VerdeCambodiaCameroonCanadaCaribbeanCentral AmericaChileChinaColombiaCongoCosta RicaCroatiaCubaCzechoslovakiaDenmarkDominicaDominican RepublicEastern AfricaEastern AsiaEastern EuropeEcuadorEgyptEl SalvadorEnglandEritreaEthiopiaEuropeFijiFranceGermanyGhanaGreeceGrenadaGuatemalaGuyanaHaitiHondurasHong KongHungaryIndiaIndonesiaIranIraqIrelandIsraelItalyJamaicaJapanJordanKazakhstanKenyaKoreaKuwaitLaosLatin AmericaLatviaLebanonLiberiaLithuaniaMalaysiaMexicoMicronesiaMiddle AfricaMoldovaMoroccoNepalNetherlandsNicaraguaNigeriaNorth AmericaNorth MacedoniaNorthern AfricaNorthern EuropeNorwayOceaniaPakistanPanamaPeruPhilippinesPolandPortugalRomaniaRussiaSaudi ArabiaScotlandSenegalSerbiaSierra LeoneSingaporeSomaliaSouth AfricaSouth AmericaSouth Central AsiaSouth Eastern AsiaSouthern EuropeSpainSri LankaSt. Vincent and the GrenadinesSudanSwedenSwitzerlandSyriaTaiwanThailandTrinidad and TobagoTurkeyUgandaUkraineUruguayUzbekistanVenezuelaVietnamWest IndiesWestern AfricaWestern AsiaWestern EuropeYemenZaireZimbabweAzores
Disability Age 5 to 17
Income
Poverty
Unemployment
Labor Participation
Family Structure
Vehicle Availability
Education Level
Disability

Carpatho Rusyn Disability Age 5 to 17
Tragic

6.3%
DISABILITY | AGE 5 TO 17
0.0/ 100
METRIC RATING
300th/ 347
METRIC RANK

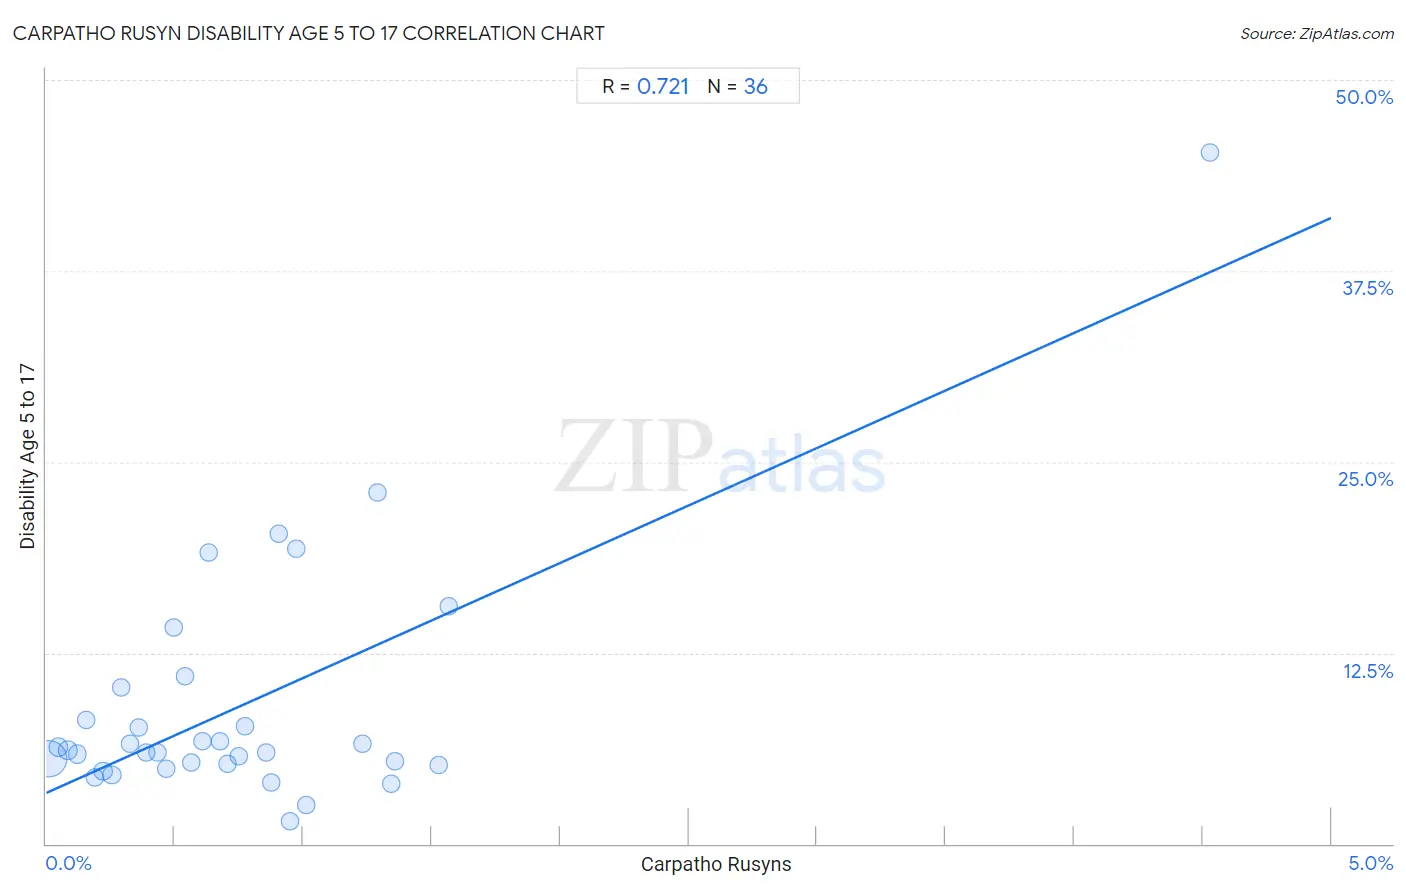
Carpatho Rusyn Disability Age 5 to 17 Correlation Chart

The statistical analysis conducted on geographies consisting of 58,826,840 people shows a strong positive correlation between the proportion of Carpatho Rusyns and percentage of population with a disability between the ages 5 and 17 in the United States with a correlation coefficient (R) of 0.721 and weighted average of 6.3%. On average, for every 1% (one percent) increase in Carpatho Rusyns within a typical geography, there is an increase of 7.5% in percentage of population with a disability between the ages 5 and 17.
Carpatho Rusyn Disability Age 5 to 17
It is essential to understand that the correlation between the percentage of Carpatho Rusyns and percentage of population with a disability between the ages 5 and 17 does not imply a direct cause-and-effect relationship. It remains uncertain whether the presence of Carpatho Rusyns influences an upward or downward trend in the level of percentage of population with a disability between the ages 5 and 17 within an area, or if Carpatho Rusyns simply ended up residing in those areas with higher or lower levels of percentage of population with a disability between the ages 5 and 17 due to other factors.

Demographics Similar to Carpatho Rusyns by Disability Age 5 to 17

In terms of disability age 5 to 17, the demographic groups most similar to Carpatho Rusyns are U.S. Virgin Islander (6.3%, a difference of 0.020%), Welsh (6.3%, a difference of 0.12%), Lumbee (6.2%, a difference of 0.27%), Immigrants from Bahamas (6.2%, a difference of 0.34%), and Celtic (6.3%, a difference of 0.35%).
DemographicsRating | RankDisability Age 5 to 17
Central American Indians
0.0
/100
|
#293
Tragic
6.2%
Irish
0.0
/100
|
#294
Tragic
6.2%
Cree
0.0
/100
|
#295
Tragic
6.2%
Spanish Americans
0.0
/100
|
#296
Tragic
6.2%
Immigrants from Bahamas
0.0
/100
|
#297
Tragic
6.2%
Lumbee
0.0
/100
|
#298
Tragic
6.2%
Welsh
0.0
/100
|
#299
Tragic
6.3%
Carpatho Rusyns
0.0
/100
|
#300
Tragic
6.3%
U.S. Virgin Islanders
0.0
/100
|
#301
Tragic
6.3%
Celtics
0.0
/100
|
#302
Tragic
6.3%
Yakama
0.0
/100
|
#303
Tragic
6.3%
Senegalese
0.0
/100
|
#304
Tragic
6.3%
Natives/Alaskans
0.0
/100
|
#305
Tragic
6.3%
Nonimmigrants
0.0
/100
|
#306
Tragic
6.3%
Bahamians
0.0
/100
|
#307
Tragic
6.3%

Carpatho Rusyn Disability Age 5 to 17 Correlation Summary

MeasurementCarpatho Rusyn DataDisability Age 5 to 17 Data
Minimum0.0073%1.5%
Maximum4.5%45.2%
Range4.5%43.8%
Mean0.76%9.1%
Median0.62%6.1%
Interquartile 25% (IQ1)0.31%5.2%
Interquartile 75% (IQ3)0.96%9.1%
Interquartile Range (IQR)0.65%4.0%
Standard Deviation (Sample)0.78%8.1%
Standard Deviation (Population)0.77%8.0%

Correlation Details

Carpatho Rusyn PercentileSample SizeDisability Age 5 to 17
[
0.0%
-
0.5%
]
0.0073%
48,800,2275.6%
[
0.0%
-
0.5%
]
0.047%
4,982,6156.3%
[
0.0%
-
0.5%
]
0.083%
1,902,2856.1%
[
0.0%
-
0.5%
]
0.12%
1,193,5085.9%
[
0.0%
-
0.5%
]
0.16%
392,0298.1%
[
0.0%
-
0.5%
]
0.19%
325,3274.3%
[
0.0%
-
0.5%
]
0.22%
306,8814.7%
[
0.0%
-
0.5%
]
0.26%
124,5524.5%
[
0.0%
-
0.5%
]
0.29%
229,17310.2%
[
0.0%
-
0.5%
]
0.33%
104,9296.5%
[
0.0%
-
0.5%
]
0.36%
53,8747.6%
[
0.0%
-
0.5%
]
0.39%
54,5136.0%
[
0.0%
-
0.5%
]
0.43%
30,2006.0%
[
0.0%
-
0.5%
]
0.47%
112,9074.9%
[
0.0%
-
0.5%
]
0.50%
24,69314.2%
[
0.5%
-
1.0%
]
0.54%
10,95011.0%
[
0.5%
-
1.0%
]
0.56%
10,2845.3%
[
0.5%
-
1.0%
]
0.61%
61,0676.7%
[
0.5%
-
1.0%
]
0.63%
12,04219.1%
[
0.5%
-
1.0%
]
0.67%
3,5606.7%
[
0.5%
-
1.0%
]
0.70%
7,9455.2%
[
0.5%
-
1.0%
]
0.75%
17,7485.7%
[
0.5%
-
1.0%
]
0.77%
1,5507.7%
[
0.5%
-
1.0%
]
0.85%
3,2756.0%
[
0.5%
-
1.0%
]
0.88%
20,9144.0%
[
0.5%
-
1.0%
]
0.90%
1,99520.3%
[
0.5%
-
1.0%
]
0.95%
5,5841.5%
[
0.5%
-
1.0%
]
0.97%
61719.3%
[
1.0%
-
1.5%
]
1.01%
7,4082.6%
[
1.0%
-
1.5%
]
1.23%
9,9856.6%
[
1.0%
-
1.5%
]
1.29%
3,03123.0%
[
1.0%
-
1.5%
]
1.34%
7,5143.9%
[
1.0%
-
1.5%
]
1.36%
1,8415.4%
[
1.5%
-
2.0%
]
1.53%
7215.2%
[
1.5%
-
2.0%
]
1.56%
83115.5%
[
4.5%
-
5.0%
]
4.53%
26545.2%