Chinese Disability Age 5 to 17
COMPARE
Chinese
Select to Compare
Disability Age 5 to 17
Chinese Disability Age 5 to 17
4.7%
DISABILITY | AGE 5 TO 17
100.0/ 100
METRIC RATING
15th/ 347
METRIC RANK
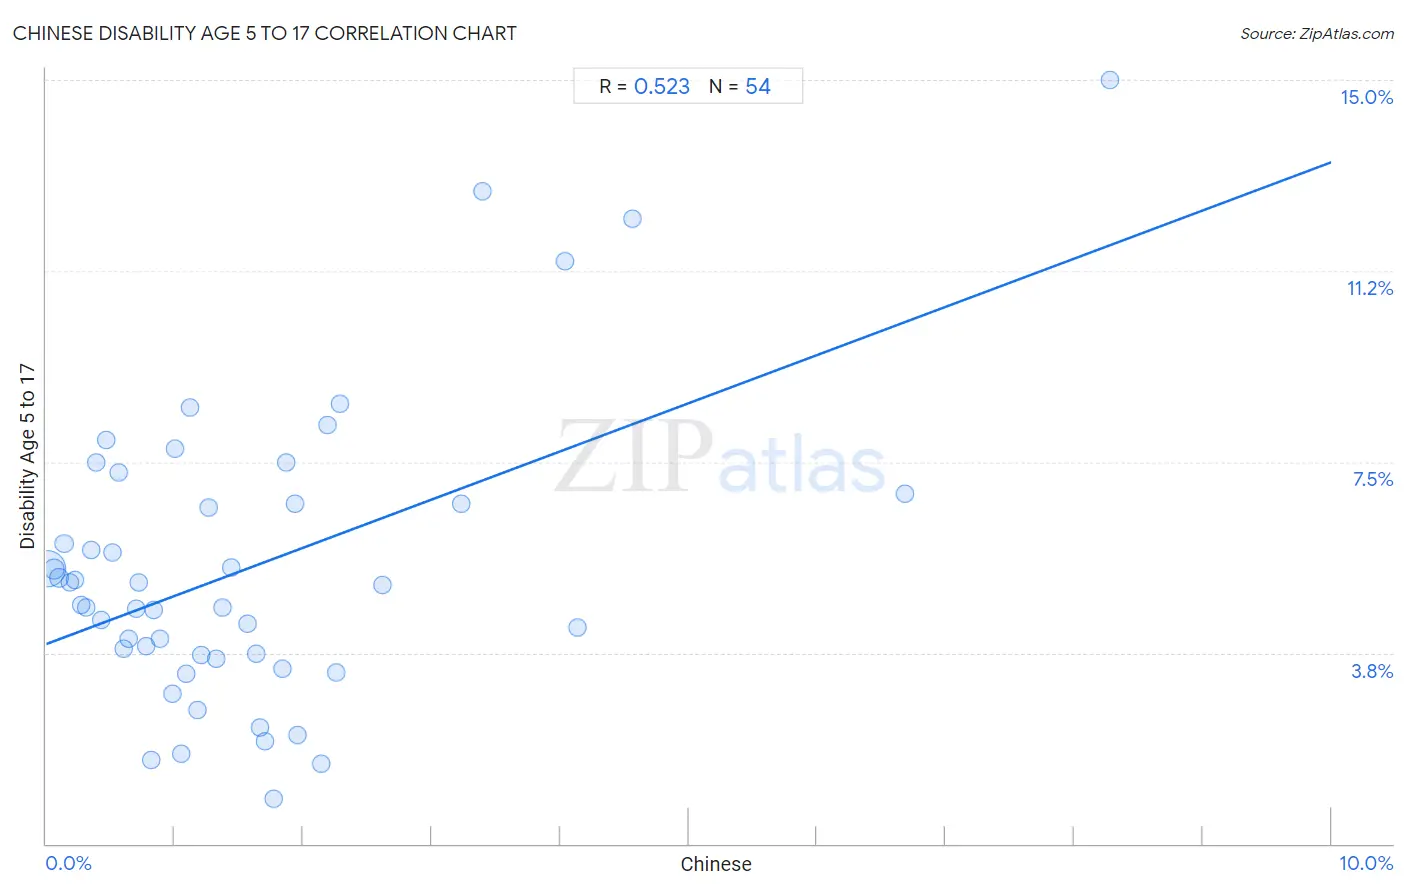
Chinese Disability Age 5 to 17 Correlation Chart
The statistical analysis conducted on geographies consisting of 64,726,058 people shows a substantial positive correlation between the proportion of Chinese and percentage of population with a disability between the ages 5 and 17 in the United States with a correlation coefficient (R) of 0.523 and weighted average of 4.7%. On average, for every 1% (one percent) increase in Chinese within a typical geography, there is an increase of 0.95% in percentage of population with a disability between the ages 5 and 17.
It is essential to understand that the correlation between the percentage of Chinese and percentage of population with a disability between the ages 5 and 17 does not imply a direct cause-and-effect relationship. It remains uncertain whether the presence of Chinese influences an upward or downward trend in the level of percentage of population with a disability between the ages 5 and 17 within an area, or if Chinese simply ended up residing in those areas with higher or lower levels of percentage of population with a disability between the ages 5 and 17 due to other factors.
Demographics Similar to Chinese by Disability Age 5 to 17
In terms of disability age 5 to 17, the demographic groups most similar to Chinese are Immigrants from Korea (4.7%, a difference of 0.20%), Immigrants from Singapore (4.7%, a difference of 0.42%), Arapaho (4.7%, a difference of 0.88%), Immigrants from South Central Asia (4.7%, a difference of 0.90%), and Thai (4.7%, a difference of 0.91%).
| Demographics | Rating | Rank | Disability Age 5 to 17 |
| Indians (Asian) | 100.0 /100 | #8 | Exceptional 4.6% |
| Immigrants from Eastern Asia | 100.0 /100 | #9 | Exceptional 4.6% |
| Immigrants from India | 100.0 /100 | #10 | Exceptional 4.6% |
| Armenians | 100.0 /100 | #11 | Exceptional 4.6% |
| Iranians | 100.0 /100 | #12 | Exceptional 4.6% |
| Thais | 100.0 /100 | #13 | Exceptional 4.7% |
| Immigrants from Korea | 100.0 /100 | #14 | Exceptional 4.7% |
| Chinese | 100.0 /100 | #15 | Exceptional 4.7% |
| Immigrants from Singapore | 100.0 /100 | #16 | Exceptional 4.7% |
| Arapaho | 100.0 /100 | #17 | Exceptional 4.7% |
| Immigrants from South Central Asia | 100.0 /100 | #18 | Exceptional 4.7% |
| Immigrants from Uzbekistan | 100.0 /100 | #19 | Exceptional 4.8% |
| Burmese | 100.0 /100 | #20 | Exceptional 4.8% |
| Yup'ik | 100.0 /100 | #21 | Exceptional 4.8% |
| Asians | 100.0 /100 | #22 | Exceptional 4.8% |
Chinese Disability Age 5 to 17 Correlation Summary
| Measurement | Chinese Data | Disability Age 5 to 17 Data |
| Minimum | 0.0087% | 0.88% |
| Maximum | 8.3% | 15.0% |
| Range | 8.3% | 14.1% |
| Mean | 1.6% | 5.4% |
| Median | 1.1% | 4.9% |
| Interquartile 25% (IQ1) | 0.56% | 3.7% |
| Interquartile 75% (IQ3) | 1.9% | 6.7% |
| Interquartile Range (IQR) | 1.4% | 3.0% |
| Standard Deviation (Sample) | 1.6% | 2.9% |
| Standard Deviation (Population) | 1.6% | 2.8% |
Correlation Details
| Chinese Percentile | Sample Size | Disability Age 5 to 17 |
[ 0.0% - 0.5% ] 0.0087% | 53,052,254 | 5.4% |
[ 0.0% - 0.5% ] 0.059% | 5,049,043 | 5.4% |
[ 0.0% - 0.5% ] 0.10% | 1,537,362 | 5.2% |
[ 0.0% - 0.5% ] 0.14% | 1,149,266 | 5.9% |
[ 0.0% - 0.5% ] 0.19% | 525,090 | 5.1% |
[ 0.0% - 0.5% ] 0.22% | 235,528 | 5.2% |
[ 0.0% - 0.5% ] 0.27% | 234,960 | 4.7% |
[ 0.0% - 0.5% ] 0.31% | 264,410 | 4.7% |
[ 0.0% - 0.5% ] 0.35% | 172,813 | 5.8% |
[ 0.0% - 0.5% ] 0.39% | 104,141 | 7.5% |
[ 0.0% - 0.5% ] 0.43% | 144,779 | 4.4% |
[ 0.0% - 0.5% ] 0.47% | 75,366 | 7.9% |
[ 0.5% - 1.0% ] 0.52% | 113,310 | 5.7% |
[ 0.5% - 1.0% ] 0.56% | 75,522 | 7.3% |
[ 0.5% - 1.0% ] 0.60% | 255,941 | 3.8% |
[ 0.5% - 1.0% ] 0.65% | 95,177 | 4.0% |
[ 0.5% - 1.0% ] 0.70% | 112,706 | 4.6% |
[ 0.5% - 1.0% ] 0.72% | 82,656 | 5.1% |
[ 0.5% - 1.0% ] 0.78% | 454,777 | 3.9% |
[ 0.5% - 1.0% ] 0.82% | 23,358 | 1.6% |
[ 0.5% - 1.0% ] 0.84% | 151,355 | 4.6% |
[ 0.5% - 1.0% ] 0.89% | 66,721 | 4.0% |
[ 0.5% - 1.0% ] 0.98% | 40,323 | 2.9% |
[ 1.0% - 1.5% ] 1.00% | 54,182 | 7.8% |
[ 1.0% - 1.5% ] 1.05% | 13,105 | 1.8% |
[ 1.0% - 1.5% ] 1.09% | 38,054 | 3.3% |
[ 1.0% - 1.5% ] 1.12% | 21,546 | 8.6% |
[ 1.0% - 1.5% ] 1.17% | 30,508 | 2.6% |
[ 1.0% - 1.5% ] 1.21% | 77,415 | 3.7% |
[ 1.0% - 1.5% ] 1.27% | 54,362 | 6.6% |
[ 1.0% - 1.5% ] 1.33% | 25,957 | 3.6% |
[ 1.0% - 1.5% ] 1.37% | 11,138 | 4.6% |
[ 1.0% - 1.5% ] 1.44% | 50,142 | 5.4% |
[ 1.5% - 2.0% ] 1.57% | 27,423 | 4.3% |
[ 1.5% - 2.0% ] 1.63% | 45,392 | 3.7% |
[ 1.5% - 2.0% ] 1.67% | 48,494 | 2.3% |
[ 1.5% - 2.0% ] 1.70% | 18,802 | 2.0% |
[ 1.5% - 2.0% ] 1.77% | 35,493 | 0.88% |
[ 1.5% - 2.0% ] 1.84% | 41,560 | 3.4% |
[ 1.5% - 2.0% ] 1.87% | 10,801 | 7.5% |
[ 1.5% - 2.0% ] 1.94% | 465 | 6.7% |
[ 1.5% - 2.0% ] 1.95% | 8,543 | 2.1% |
[ 2.0% - 2.5% ] 2.14% | 63,439 | 1.6% |
[ 2.0% - 2.5% ] 2.19% | 1,555 | 8.2% |
[ 2.0% - 2.5% ] 2.26% | 1,507 | 3.4% |
[ 2.0% - 2.5% ] 2.28% | 1,576 | 8.6% |
[ 2.5% - 3.0% ] 2.61% | 8,571 | 5.1% |
[ 3.0% - 3.5% ] 3.23% | 279 | 6.7% |
[ 3.0% - 3.5% ] 3.39% | 3,627 | 12.8% |
[ 4.0% - 4.5% ] 4.04% | 4,135 | 11.4% |
[ 4.0% - 4.5% ] 4.14% | 9,571 | 4.2% |
[ 4.5% - 5.0% ] 4.56% | 548 | 12.3% |
[ 6.5% - 7.0% ] 6.68% | 853 | 6.9% |
[ 8.0% - 8.5% ] 8.28% | 157 | 15.0% |