Immigrants from Brazil Disability Age 5 to 17
COMPARE
Immigrants from Brazil
Select to Compare
Disability Age 5 to 17
Immigrants from Brazil Disability Age 5 to 17
5.8%
DISABILITY | AGE 5 TO 17
3.2/ 100
METRIC RATING
236th/ 347
METRIC RANK
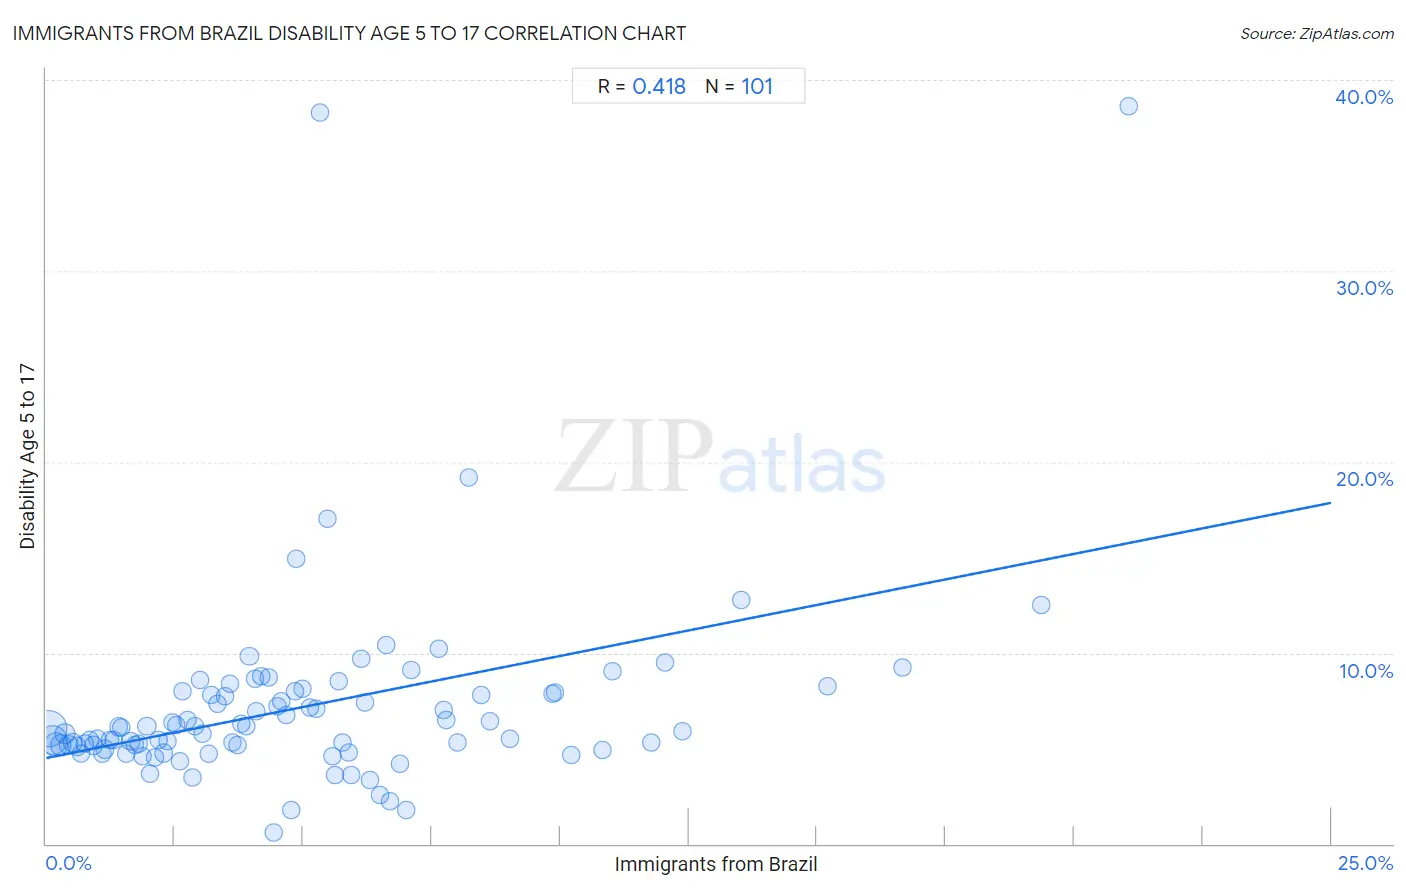
Immigrants from Brazil Disability Age 5 to 17 Correlation Chart
The statistical analysis conducted on geographies consisting of 340,728,736 people shows a moderate positive correlation between the proportion of Immigrants from Brazil and percentage of population with a disability between the ages 5 and 17 in the United States with a correlation coefficient (R) of 0.418 and weighted average of 5.8%. On average, for every 1% (one percent) increase in Immigrants from Brazil within a typical geography, there is an increase of 0.53% in percentage of population with a disability between the ages 5 and 17.
It is essential to understand that the correlation between the percentage of Immigrants from Brazil and percentage of population with a disability between the ages 5 and 17 does not imply a direct cause-and-effect relationship. It remains uncertain whether the presence of Immigrants from Brazil influences an upward or downward trend in the level of percentage of population with a disability between the ages 5 and 17 within an area, or if Immigrants from Brazil simply ended up residing in those areas with higher or lower levels of percentage of population with a disability between the ages 5 and 17 due to other factors.
Demographics Similar to Immigrants from Brazil by Disability Age 5 to 17
In terms of disability age 5 to 17, the demographic groups most similar to Immigrants from Brazil are Malaysian (5.8%, a difference of 0.060%), Immigrants from Kenya (5.8%, a difference of 0.070%), Immigrants from West Indies (5.8%, a difference of 0.11%), Sudanese (5.8%, a difference of 0.15%), and Immigrants from Laos (5.8%, a difference of 0.20%).
| Demographics | Rating | Rank | Disability Age 5 to 17 |
| Bangladeshis | 4.8 /100 | #229 | Tragic 5.8% |
| Ghanaians | 4.7 /100 | #230 | Tragic 5.8% |
| Europeans | 4.5 /100 | #231 | Tragic 5.8% |
| Immigrants from Laos | 3.8 /100 | #232 | Tragic 5.8% |
| Immigrants from West Indies | 3.5 /100 | #233 | Tragic 5.8% |
| Immigrants from Kenya | 3.4 /100 | #234 | Tragic 5.8% |
| Malaysians | 3.4 /100 | #235 | Tragic 5.8% |
| Immigrants from Brazil | 3.2 /100 | #236 | Tragic 5.8% |
| Sudanese | 2.9 /100 | #237 | Tragic 5.8% |
| Hungarians | 2.6 /100 | #238 | Tragic 5.8% |
| German Russians | 2.4 /100 | #239 | Tragic 5.9% |
| West Indians | 2.4 /100 | #240 | Tragic 5.9% |
| Immigrants from Caribbean | 2.1 /100 | #241 | Tragic 5.9% |
| Spaniards | 2.0 /100 | #242 | Tragic 5.9% |
| Indonesians | 2.0 /100 | #243 | Tragic 5.9% |
Immigrants from Brazil Disability Age 5 to 17 Correlation Summary
| Measurement | Immigrants from Brazil Data | Disability Age 5 to 17 Data |
| Minimum | 0.039% | 0.57% |
| Maximum | 21.1% | 38.7% |
| Range | 21.0% | 38.1% |
| Mean | 5.0% | 7.2% |
| Median | 4.1% | 6.0% |
| Interquartile 25% (IQ1) | 2.0% | 5.1% |
| Interquartile 75% (IQ3) | 6.7% | 8.0% |
| Interquartile Range (IQR) | 4.7% | 2.8% |
| Standard Deviation (Sample) | 4.1% | 5.3% |
| Standard Deviation (Population) | 4.1% | 5.3% |
Correlation Details
| Immigrants from Brazil Percentile | Sample Size | Disability Age 5 to 17 |
[ 0.0% - 0.5% ] 0.039% | 128,294,475 | 6.0% |
[ 0.0% - 0.5% ] 0.12% | 75,797,514 | 5.4% |
[ 0.0% - 0.5% ] 0.19% | 46,822,604 | 5.2% |
[ 0.0% - 0.5% ] 0.28% | 22,431,295 | 5.1% |
[ 0.0% - 0.5% ] 0.36% | 16,772,544 | 5.8% |
[ 0.0% - 0.5% ] 0.44% | 11,020,462 | 5.2% |
[ 0.5% - 1.0% ] 0.52% | 6,274,482 | 5.3% |
[ 0.5% - 1.0% ] 0.60% | 5,654,455 | 5.1% |
[ 0.5% - 1.0% ] 0.68% | 2,835,713 | 4.7% |
[ 0.5% - 1.0% ] 0.75% | 3,247,693 | 5.2% |
[ 0.5% - 1.0% ] 0.84% | 2,246,639 | 5.5% |
[ 0.5% - 1.0% ] 0.91% | 2,540,029 | 5.1% |
[ 0.5% - 1.0% ] 1.00% | 1,690,757 | 5.5% |
[ 1.0% - 1.5% ] 1.08% | 1,231,045 | 4.7% |
[ 1.0% - 1.5% ] 1.15% | 1,348,847 | 5.0% |
[ 1.0% - 1.5% ] 1.24% | 916,822 | 5.4% |
[ 1.0% - 1.5% ] 1.31% | 799,453 | 5.4% |
[ 1.0% - 1.5% ] 1.40% | 477,410 | 6.1% |
[ 1.0% - 1.5% ] 1.47% | 478,946 | 6.1% |
[ 1.5% - 2.0% ] 1.56% | 487,052 | 4.7% |
[ 1.5% - 2.0% ] 1.64% | 601,665 | 5.4% |
[ 1.5% - 2.0% ] 1.72% | 253,650 | 5.2% |
[ 1.5% - 2.0% ] 1.81% | 627,205 | 5.3% |
[ 1.5% - 2.0% ] 1.88% | 518,414 | 4.6% |
[ 1.5% - 2.0% ] 1.96% | 458,656 | 6.2% |
[ 2.0% - 2.5% ] 2.02% | 127,530 | 3.7% |
[ 2.0% - 2.5% ] 2.12% | 318,593 | 4.5% |
[ 2.0% - 2.5% ] 2.19% | 510,944 | 5.4% |
[ 2.0% - 2.5% ] 2.28% | 376,634 | 4.7% |
[ 2.0% - 2.5% ] 2.36% | 232,964 | 5.4% |
[ 2.0% - 2.5% ] 2.45% | 55,570 | 6.3% |
[ 2.5% - 3.0% ] 2.52% | 111,210 | 6.2% |
[ 2.5% - 3.0% ] 2.59% | 139,421 | 4.3% |
[ 2.5% - 3.0% ] 2.66% | 76,869 | 8.0% |
[ 2.5% - 3.0% ] 2.75% | 414,794 | 6.5% |
[ 2.5% - 3.0% ] 2.84% | 138,433 | 3.5% |
[ 2.5% - 3.0% ] 2.89% | 418,868 | 6.2% |
[ 3.0% - 3.5% ] 3.00% | 171,709 | 8.6% |
[ 3.0% - 3.5% ] 3.04% | 149,280 | 5.8% |
[ 3.0% - 3.5% ] 3.17% | 72,095 | 4.7% |
[ 3.0% - 3.5% ] 3.21% | 111,719 | 7.8% |
[ 3.0% - 3.5% ] 3.34% | 209,912 | 7.3% |
[ 3.0% - 3.5% ] 3.47% | 34,239 | 7.7% |
[ 3.5% - 4.0% ] 3.57% | 49,770 | 8.3% |
[ 3.5% - 4.0% ] 3.62% | 39,921 | 5.3% |
[ 3.5% - 4.0% ] 3.73% | 63,264 | 5.2% |
[ 3.5% - 4.0% ] 3.79% | 75,805 | 6.3% |
[ 3.5% - 4.0% ] 3.88% | 51,896 | 6.1% |
[ 3.5% - 4.0% ] 3.95% | 335,694 | 9.8% |
[ 4.0% - 4.5% ] 4.07% | 27,996 | 8.6% |
[ 4.0% - 4.5% ] 4.09% | 157,704 | 7.0% |
[ 4.0% - 4.5% ] 4.18% | 64,839 | 8.8% |
[ 4.0% - 4.5% ] 4.33% | 327,503 | 8.7% |
[ 4.0% - 4.5% ] 4.43% | 10,335 | 0.57% |
[ 4.5% - 5.0% ] 4.51% | 33,414 | 7.2% |
[ 4.5% - 5.0% ] 4.56% | 86,913 | 7.5% |
[ 4.5% - 5.0% ] 4.67% | 15,439 | 6.7% |
[ 4.5% - 5.0% ] 4.78% | 6,027 | 1.8% |
[ 4.5% - 5.0% ] 4.84% | 43,421 | 8.0% |
[ 4.5% - 5.0% ] 4.87% | 28,893 | 14.9% |
[ 4.5% - 5.0% ] 4.98% | 28,729 | 8.1% |
[ 5.0% - 5.5% ] 5.14% | 139,266 | 7.1% |
[ 5.0% - 5.5% ] 5.26% | 68,427 | 7.1% |
[ 5.0% - 5.5% ] 5.33% | 863 | 38.3% |
[ 5.0% - 5.5% ] 5.46% | 9,246 | 17.0% |
[ 5.5% - 6.0% ] 5.56% | 16,684 | 4.6% |
[ 5.5% - 6.0% ] 5.62% | 130,926 | 3.6% |
[ 5.5% - 6.0% ] 5.70% | 48,283 | 8.5% |
[ 5.5% - 6.0% ] 5.77% | 132,036 | 5.3% |
[ 5.5% - 6.0% ] 5.88% | 10,018 | 4.8% |
[ 5.5% - 6.0% ] 5.93% | 65,215 | 3.6% |
[ 6.0% - 6.5% ] 6.13% | 7,649 | 9.7% |
[ 6.0% - 6.5% ] 6.21% | 54,125 | 7.4% |
[ 6.0% - 6.5% ] 6.29% | 36,494 | 3.4% |
[ 6.5% - 7.0% ] 6.50% | 46,595 | 2.6% |
[ 6.5% - 7.0% ] 6.62% | 10,623 | 10.4% |
[ 6.5% - 7.0% ] 6.69% | 2,826 | 2.2% |
[ 6.5% - 7.0% ] 6.88% | 33,691 | 4.2% |
[ 6.5% - 7.0% ] 6.99% | 58,595 | 1.8% |
[ 7.0% - 7.5% ] 7.09% | 48,922 | 9.1% |
[ 7.5% - 8.0% ] 7.63% | 32,076 | 10.2% |
[ 7.5% - 8.0% ] 7.73% | 54,957 | 7.0% |
[ 7.5% - 8.0% ] 7.78% | 13,154 | 6.5% |
[ 8.0% - 8.5% ] 8.01% | 11,929 | 5.3% |
[ 8.0% - 8.5% ] 8.22% | 608 | 19.2% |
[ 8.0% - 8.5% ] 8.46% | 86,455 | 7.8% |
[ 8.5% - 9.0% ] 8.64% | 3,589 | 6.4% |
[ 9.0% - 9.5% ] 9.02% | 11,551 | 5.5% |
[ 9.5% - 10.0% ] 9.85% | 32,091 | 7.8% |
[ 9.5% - 10.0% ] 9.90% | 31,932 | 7.9% |
[ 10.0% - 10.5% ] 10.22% | 60,009 | 4.6% |
[ 10.5% - 11.0% ] 10.82% | 152,106 | 4.9% |
[ 11.0% - 11.5% ] 11.02% | 82,782 | 9.1% |
[ 11.5% - 12.0% ] 11.77% | 27,569 | 5.3% |
[ 12.0% - 12.5% ] 12.04% | 97,370 | 9.5% |
[ 12.0% - 12.5% ] 12.37% | 45,694 | 5.9% |
[ 13.5% - 14.0% ] 13.52% | 17,178 | 12.8% |
[ 15.0% - 15.5% ] 15.21% | 4,418 | 8.3% |
[ 16.5% - 17.0% ] 16.65% | 38,898 | 9.2% |
[ 19.0% - 19.5% ] 19.37% | 56,696 | 12.5% |
[ 21.0% - 21.5% ] 21.06% | 1,016 | 38.7% |