Dutch West Indian Disability Age 5 to 17
COMPARE
Dutch West Indian
Select to Compare
Disability Age 5 to 17
Dutch West Indian Disability Age 5 to 17
6.7%
DISABILITY | AGE 5 TO 17
0.0/ 100
METRIC RATING
330th/ 347
METRIC RANK
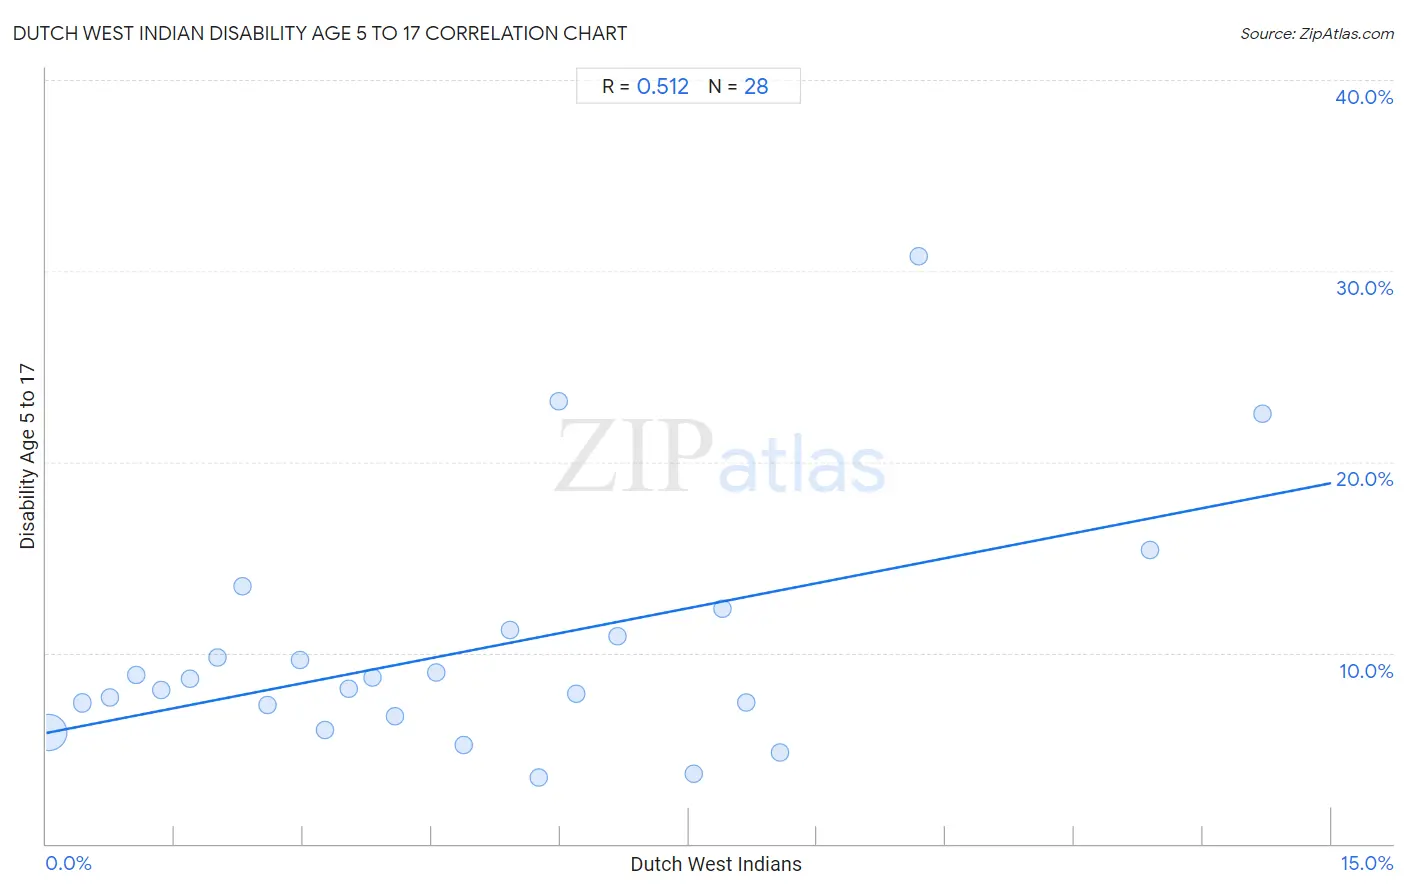
Dutch West Indian Disability Age 5 to 17 Correlation Chart
The statistical analysis conducted on geographies consisting of 85,576,125 people shows a substantial positive correlation between the proportion of Dutch West Indians and percentage of population with a disability between the ages 5 and 17 in the United States with a correlation coefficient (R) of 0.512 and weighted average of 6.7%. On average, for every 1% (one percent) increase in Dutch West Indians within a typical geography, there is an increase of 0.87% in percentage of population with a disability between the ages 5 and 17.
It is essential to understand that the correlation between the percentage of Dutch West Indians and percentage of population with a disability between the ages 5 and 17 does not imply a direct cause-and-effect relationship. It remains uncertain whether the presence of Dutch West Indians influences an upward or downward trend in the level of percentage of population with a disability between the ages 5 and 17 within an area, or if Dutch West Indians simply ended up residing in those areas with higher or lower levels of percentage of population with a disability between the ages 5 and 17 due to other factors.
Demographics Similar to Dutch West Indians by Disability Age 5 to 17
In terms of disability age 5 to 17, the demographic groups most similar to Dutch West Indians are French Canadian (6.7%, a difference of 0.080%), Immigrants from the Azores (6.7%, a difference of 0.10%), Black/African American (6.8%, a difference of 0.69%), Seminole (6.8%, a difference of 0.74%), and Ottawa (6.8%, a difference of 1.5%).
| Demographics | Rating | Rank | Disability Age 5 to 17 |
| Osage | 0.0 /100 | #323 | Tragic 6.5% |
| Dominicans | 0.0 /100 | #324 | Tragic 6.5% |
| Americans | 0.0 /100 | #325 | Tragic 6.5% |
| Potawatomi | 0.0 /100 | #326 | Tragic 6.5% |
| French American Indians | 0.0 /100 | #327 | Tragic 6.6% |
| Pennsylvania Germans | 0.0 /100 | #328 | Tragic 6.6% |
| Blackfeet | 0.0 /100 | #329 | Tragic 6.6% |
| Dutch West Indians | 0.0 /100 | #330 | Tragic 6.7% |
| French Canadians | 0.0 /100 | #331 | Tragic 6.7% |
| Immigrants from the Azores | 0.0 /100 | #332 | Tragic 6.7% |
| Blacks/African Americans | 0.0 /100 | #333 | Tragic 6.8% |
| Seminole | 0.0 /100 | #334 | Tragic 6.8% |
| Ottawa | 0.0 /100 | #335 | Tragic 6.8% |
| Chickasaw | 0.0 /100 | #336 | Tragic 6.8% |
| Creek | 0.0 /100 | #337 | Tragic 6.9% |
Dutch West Indian Disability Age 5 to 17 Correlation Summary
| Measurement | Dutch West Indian Data | Disability Age 5 to 17 Data |
| Minimum | 0.033% | 3.5% |
| Maximum | 14.2% | 30.8% |
| Range | 14.2% | 27.3% |
| Mean | 5.0% | 10.1% |
| Median | 4.3% | 8.4% |
| Interquartile 25% (IQ1) | 2.1% | 7.0% |
| Interquartile 75% (IQ3) | 7.1% | 11.0% |
| Interquartile Range (IQR) | 5.0% | 4.1% |
| Standard Deviation (Sample) | 3.6% | 6.2% |
| Standard Deviation (Population) | 3.6% | 6.1% |
Correlation Details
| Dutch West Indian Percentile | Sample Size | Disability Age 5 to 17 |
[ 0.0% - 0.5% ] 0.033% | 82,869,963 | 5.8% |
[ 0.0% - 0.5% ] 0.42% | 1,774,471 | 7.4% |
[ 0.5% - 1.0% ] 0.74% | 476,046 | 7.7% |
[ 1.0% - 1.5% ] 1.05% | 179,019 | 8.9% |
[ 1.0% - 1.5% ] 1.34% | 94,738 | 8.0% |
[ 1.5% - 2.0% ] 1.68% | 58,327 | 8.7% |
[ 2.0% - 2.5% ] 2.00% | 42,421 | 9.8% |
[ 2.0% - 2.5% ] 2.29% | 11,481 | 13.5% |
[ 2.5% - 3.0% ] 2.59% | 25,570 | 7.2% |
[ 2.5% - 3.0% ] 2.95% | 12,319 | 9.6% |
[ 3.0% - 3.5% ] 3.26% | 8,937 | 5.9% |
[ 3.5% - 4.0% ] 3.53% | 4,500 | 8.1% |
[ 3.5% - 4.0% ] 3.80% | 2,972 | 8.7% |
[ 4.0% - 4.5% ] 4.06% | 6,200 | 6.7% |
[ 4.5% - 5.0% ] 4.56% | 373 | 9.0% |
[ 4.5% - 5.0% ] 4.88% | 1,086 | 5.2% |
[ 5.0% - 5.5% ] 5.42% | 886 | 11.2% |
[ 5.5% - 6.0% ] 5.75% | 1,462 | 3.5% |
[ 5.5% - 6.0% ] 5.99% | 501 | 23.2% |
[ 6.0% - 6.5% ] 6.18% | 728 | 7.8% |
[ 6.5% - 7.0% ] 6.67% | 405 | 10.9% |
[ 7.5% - 8.0% ] 7.55% | 662 | 3.6% |
[ 7.5% - 8.0% ] 7.89% | 1,356 | 12.3% |
[ 8.0% - 8.5% ] 8.17% | 208 | 7.4% |
[ 8.5% - 9.0% ] 8.56% | 888 | 4.8% |
[ 10.0% - 10.5% ] 10.19% | 157 | 30.8% |
[ 12.5% - 13.0% ] 12.88% | 132 | 15.4% |
[ 14.0% - 14.5% ] 14.20% | 317 | 22.5% |