Immigrants from Haiti Disability Age 5 to 17
COMPARE
Immigrants from Haiti
Select to Compare
Disability Age 5 to 17
Immigrants from Haiti Disability Age 5 to 17
5.8%
DISABILITY | AGE 5 TO 17
9.5/ 100
METRIC RATING
210th/ 347
METRIC RANK
Immigrants from Haiti Disability Age 5 to 17 Correlation Chart
The statistical analysis conducted on geographies consisting of 224,112,942 people shows a weak negative correlation between the proportion of Immigrants from Haiti and percentage of population with a disability between the ages 5 and 17 in the United States with a correlation coefficient (R) of -0.249 and weighted average of 5.8%. On average, for every 1% (one percent) increase in Immigrants from Haiti within a typical geography, there is a decrease of 0.068% in percentage of population with a disability between the ages 5 and 17.
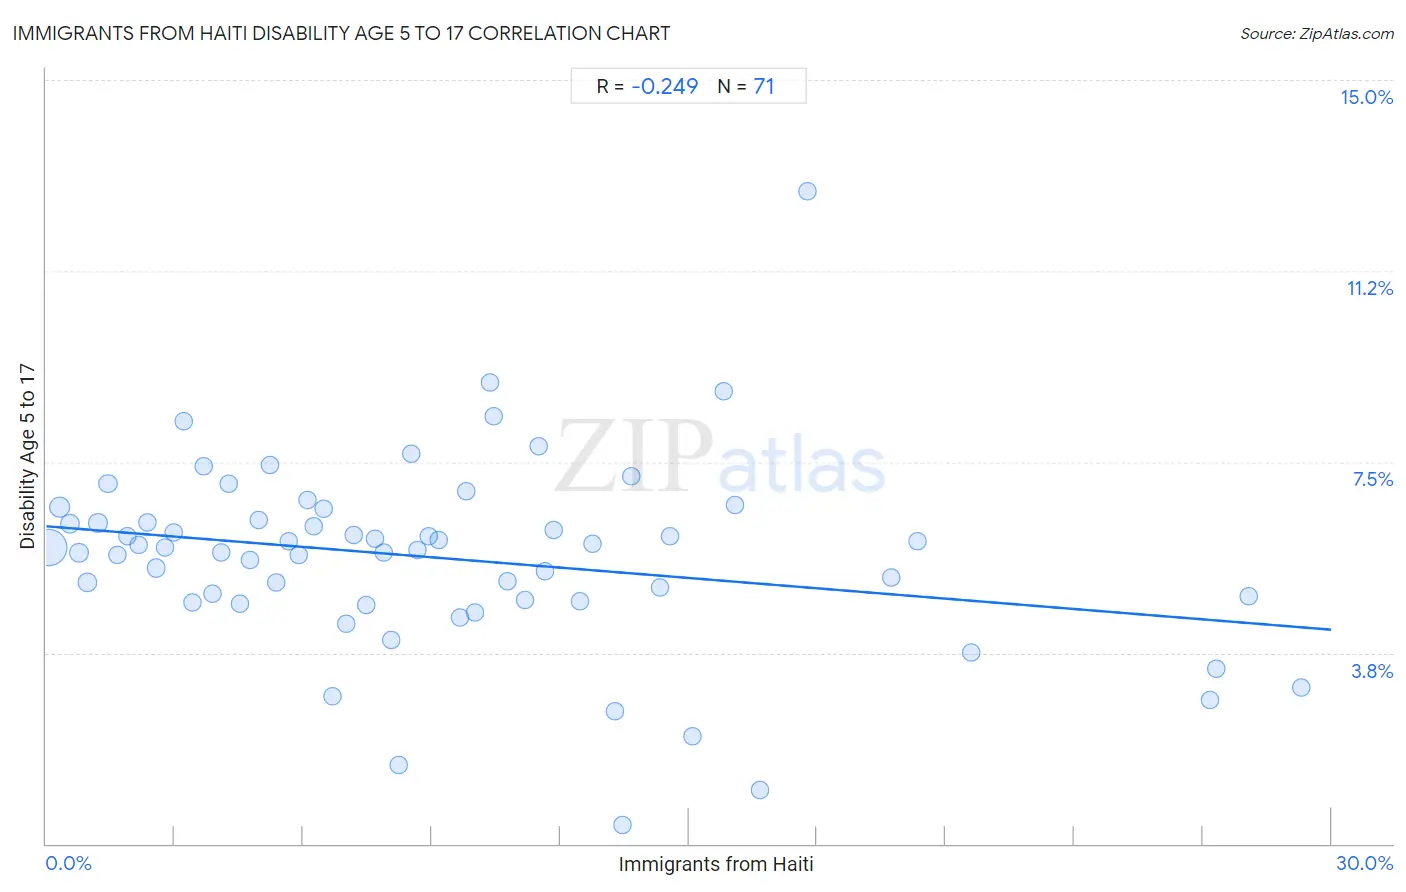
It is essential to understand that the correlation between the percentage of Immigrants from Haiti and percentage of population with a disability between the ages 5 and 17 does not imply a direct cause-and-effect relationship. It remains uncertain whether the presence of Immigrants from Haiti influences an upward or downward trend in the level of percentage of population with a disability between the ages 5 and 17 within an area, or if Immigrants from Haiti simply ended up residing in those areas with higher or lower levels of percentage of population with a disability between the ages 5 and 17 due to other factors.
Demographics Similar to Immigrants from Haiti by Disability Age 5 to 17
In terms of disability age 5 to 17, the demographic groups most similar to Immigrants from Haiti are Immigrants from Uganda (5.8%, a difference of 0.030%), Yugoslavian (5.8%, a difference of 0.050%), Kenyan (5.8%, a difference of 0.070%), Moroccan (5.7%, a difference of 0.12%), and Immigrants from Panama (5.8%, a difference of 0.12%).
| Demographics | Rating | Rank | Disability Age 5 to 17 |
| Spanish American Indians | 12.8 /100 | #203 | Poor 5.7% |
| Paiute | 11.2 /100 | #204 | Poor 5.7% |
| Trinidadians and Tobagonians | 10.8 /100 | #205 | Poor 5.7% |
| Immigrants from Africa | 10.8 /100 | #206 | Poor 5.7% |
| Moroccans | 10.4 /100 | #207 | Poor 5.7% |
| Kenyans | 10.0 /100 | #208 | Poor 5.8% |
| Immigrants from Uganda | 9.7 /100 | #209 | Tragic 5.8% |
| Immigrants from Haiti | 9.5 /100 | #210 | Tragic 5.8% |
| Yugoslavians | 9.1 /100 | #211 | Tragic 5.8% |
| Immigrants from Panama | 8.7 /100 | #212 | Tragic 5.8% |
| Immigrants from Cameroon | 8.3 /100 | #213 | Tragic 5.8% |
| Immigrants from Morocco | 8.3 /100 | #214 | Tragic 5.8% |
| Swedes | 8.1 /100 | #215 | Tragic 5.8% |
| Nigerians | 7.5 /100 | #216 | Tragic 5.8% |
| Czechs | 7.4 /100 | #217 | Tragic 5.8% |
Immigrants from Haiti Disability Age 5 to 17 Correlation Summary
| Measurement | Immigrants from Haiti Data | Disability Age 5 to 17 Data |
| Minimum | 0.058% | 0.37% |
| Maximum | 29.3% | 12.8% |
| Range | 29.2% | 12.4% |
| Mean | 9.2% | 5.6% |
| Median | 7.9% | 5.8% |
| Interquartile 25% (IQ1) | 3.9% | 4.8% |
| Interquartile 75% (IQ3) | 12.8% | 6.4% |
| Interquartile Range (IQR) | 8.9% | 1.6% |
| Standard Deviation (Sample) | 7.0% | 1.9% |
| Standard Deviation (Population) | 6.9% | 1.9% |
Correlation Details
| Immigrants from Haiti Percentile | Sample Size | Disability Age 5 to 17 |
[ 0.0% - 0.5% ] 0.058% | 149,253,526 | 5.8% |
[ 0.0% - 0.5% ] 0.32% | 25,508,107 | 6.6% |
[ 0.5% - 1.0% ] 0.55% | 10,762,363 | 6.3% |
[ 0.5% - 1.0% ] 0.76% | 5,292,786 | 5.7% |
[ 0.5% - 1.0% ] 0.96% | 11,534,360 | 5.1% |
[ 1.0% - 1.5% ] 1.21% | 2,341,137 | 6.3% |
[ 1.0% - 1.5% ] 1.44% | 2,317,737 | 7.1% |
[ 1.5% - 2.0% ] 1.66% | 1,806,393 | 5.7% |
[ 1.5% - 2.0% ] 1.90% | 1,286,854 | 6.0% |
[ 2.0% - 2.5% ] 2.15% | 1,363,759 | 5.9% |
[ 2.0% - 2.5% ] 2.36% | 1,519,279 | 6.3% |
[ 2.5% - 3.0% ] 2.56% | 1,063,069 | 5.4% |
[ 2.5% - 3.0% ] 2.77% | 435,899 | 5.8% |
[ 2.5% - 3.0% ] 2.97% | 661,460 | 6.1% |
[ 3.0% - 3.5% ] 3.22% | 355,281 | 8.3% |
[ 3.0% - 3.5% ] 3.41% | 546,363 | 4.7% |
[ 3.5% - 4.0% ] 3.68% | 399,105 | 7.4% |
[ 3.5% - 4.0% ] 3.87% | 580,367 | 4.9% |
[ 4.0% - 4.5% ] 4.09% | 708,303 | 5.7% |
[ 4.0% - 4.5% ] 4.26% | 189,264 | 7.1% |
[ 4.5% - 5.0% ] 4.53% | 547,397 | 4.7% |
[ 4.5% - 5.0% ] 4.77% | 434,151 | 5.6% |
[ 4.5% - 5.0% ] 4.96% | 211,143 | 6.4% |
[ 5.0% - 5.5% ] 5.23% | 260,260 | 7.5% |
[ 5.0% - 5.5% ] 5.38% | 192,370 | 5.1% |
[ 5.5% - 6.0% ] 5.66% | 286,316 | 6.0% |
[ 5.5% - 6.0% ] 5.89% | 207,895 | 5.7% |
[ 6.0% - 6.5% ] 6.09% | 164,952 | 6.8% |
[ 6.0% - 6.5% ] 6.25% | 70,731 | 6.2% |
[ 6.0% - 6.5% ] 6.49% | 385,906 | 6.6% |
[ 6.5% - 7.0% ] 6.69% | 60,922 | 2.9% |
[ 6.5% - 7.0% ] 7.00% | 103,459 | 4.3% |
[ 7.0% - 7.5% ] 7.18% | 144,847 | 6.1% |
[ 7.0% - 7.5% ] 7.48% | 99,835 | 4.7% |
[ 7.5% - 8.0% ] 7.66% | 84,507 | 6.0% |
[ 7.5% - 8.0% ] 7.88% | 178,368 | 5.7% |
[ 8.0% - 8.5% ] 8.07% | 27,845 | 4.0% |
[ 8.0% - 8.5% ] 8.22% | 3,794 | 1.5% |
[ 8.5% - 9.0% ] 8.54% | 34,411 | 7.7% |
[ 8.5% - 9.0% ] 8.68% | 46,881 | 5.8% |
[ 8.5% - 9.0% ] 8.92% | 81,517 | 6.0% |
[ 9.0% - 9.5% ] 9.16% | 259,345 | 6.0% |
[ 9.5% - 10.0% ] 9.66% | 175,517 | 4.5% |
[ 9.5% - 10.0% ] 9.82% | 171,255 | 6.9% |
[ 10.0% - 10.5% ] 10.02% | 320,218 | 4.5% |
[ 10.0% - 10.5% ] 10.37% | 38,809 | 9.1% |
[ 10.0% - 10.5% ] 10.45% | 20,503 | 8.4% |
[ 10.5% - 11.0% ] 10.77% | 138,859 | 5.2% |
[ 11.0% - 11.5% ] 11.18% | 70,829 | 4.8% |
[ 11.5% - 12.0% ] 11.50% | 62,827 | 7.8% |
[ 11.5% - 12.0% ] 11.65% | 234,322 | 5.4% |
[ 11.5% - 12.0% ] 11.86% | 103,175 | 6.2% |
[ 12.0% - 12.5% ] 12.46% | 114,188 | 4.8% |
[ 12.5% - 13.0% ] 12.77% | 109,896 | 5.9% |
[ 13.0% - 13.5% ] 13.26% | 39,498 | 2.6% |
[ 13.0% - 13.5% ] 13.45% | 1,904 | 0.37% |
[ 13.5% - 14.0% ] 13.65% | 7,054 | 7.2% |
[ 14.0% - 14.5% ] 14.32% | 93,515 | 5.0% |
[ 14.5% - 15.0% ] 14.56% | 32,963 | 6.0% |
[ 15.0% - 15.5% ] 15.08% | 8,996 | 2.1% |
[ 15.5% - 16.0% ] 15.82% | 83,221 | 8.9% |
[ 16.0% - 16.5% ] 16.08% | 105,835 | 6.7% |
[ 16.5% - 17.0% ] 16.67% | 37,533 | 1.1% |
[ 17.5% - 18.0% ] 17.78% | 35,914 | 12.8% |
[ 19.5% - 20.0% ] 19.73% | 22,823 | 5.2% |
[ 20.0% - 20.5% ] 20.35% | 31,807 | 6.0% |
[ 21.5% - 22.0% ] 21.60% | 48,326 | 3.8% |
[ 27.0% - 27.5% ] 27.17% | 83,312 | 2.8% |
[ 27.0% - 27.5% ] 27.32% | 34,725 | 3.4% |
[ 28.0% - 28.5% ] 28.08% | 20,030 | 4.9% |
[ 29.0% - 29.5% ] 29.30% | 52,824 | 3.1% |