Immigrants from Lithuania Disability Age 5 to 17
COMPARE
Immigrants from Lithuania
Select to Compare
Disability Age 5 to 17
Immigrants from Lithuania Disability Age 5 to 17
5.1%
DISABILITY | AGE 5 TO 17
99.9/ 100
METRIC RATING
53rd/ 347
METRIC RANK
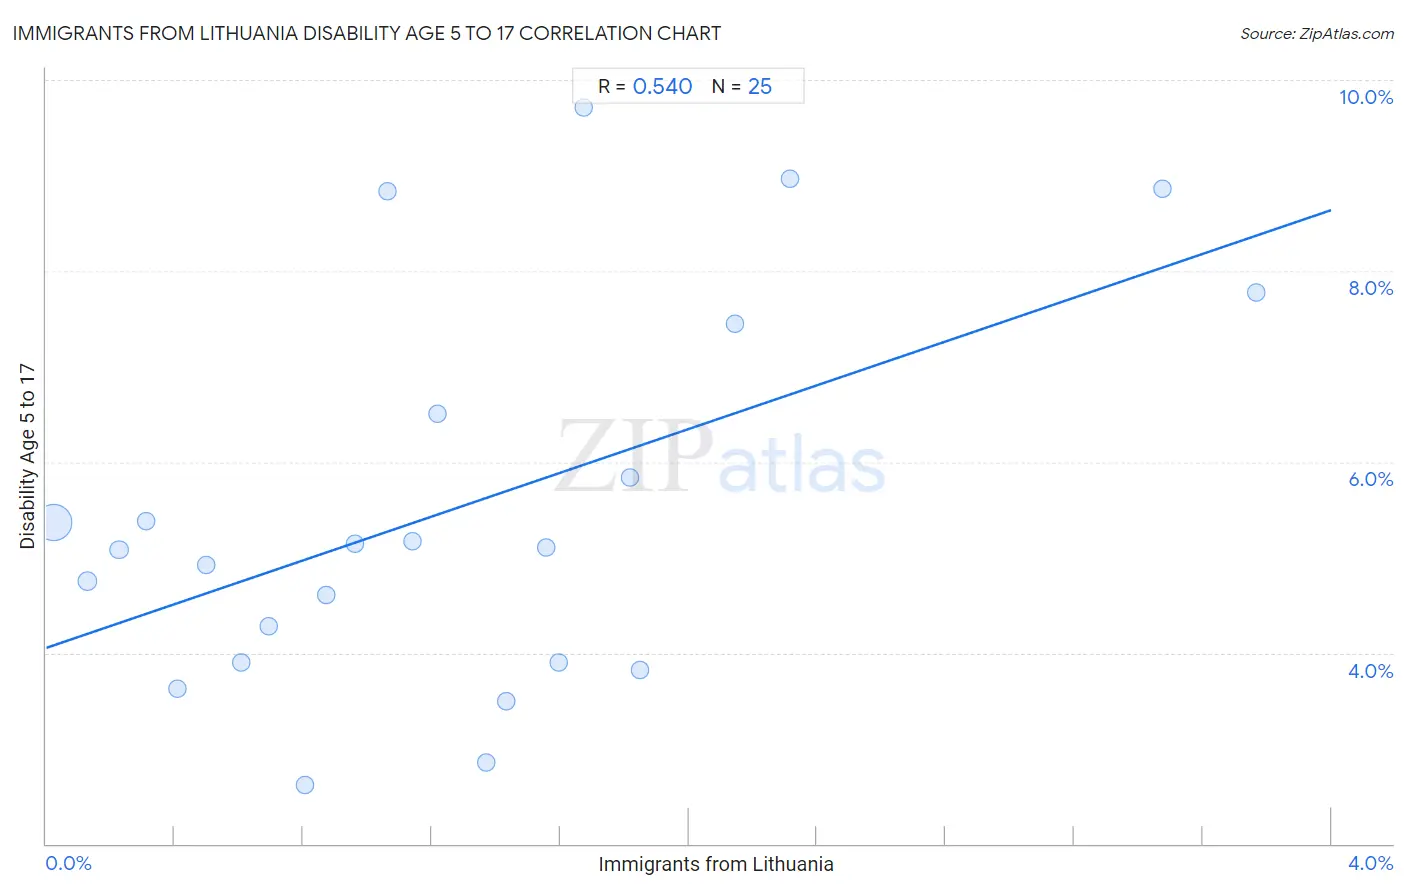
Immigrants from Lithuania Disability Age 5 to 17 Correlation Chart
The statistical analysis conducted on geographies consisting of 117,321,416 people shows a substantial positive correlation between the proportion of Immigrants from Lithuania and percentage of population with a disability between the ages 5 and 17 in the United States with a correlation coefficient (R) of 0.540 and weighted average of 5.1%. On average, for every 1% (one percent) increase in Immigrants from Lithuania within a typical geography, there is an increase of 1.1% in percentage of population with a disability between the ages 5 and 17.
It is essential to understand that the correlation between the percentage of Immigrants from Lithuania and percentage of population with a disability between the ages 5 and 17 does not imply a direct cause-and-effect relationship. It remains uncertain whether the presence of Immigrants from Lithuania influences an upward or downward trend in the level of percentage of population with a disability between the ages 5 and 17 within an area, or if Immigrants from Lithuania simply ended up residing in those areas with higher or lower levels of percentage of population with a disability between the ages 5 and 17 due to other factors.
Demographics Similar to Immigrants from Lithuania by Disability Age 5 to 17
In terms of disability age 5 to 17, the demographic groups most similar to Immigrants from Lithuania are Paraguayan (5.1%, a difference of 0.030%), Immigrants from Fiji (5.1%, a difference of 0.050%), Laotian (5.1%, a difference of 0.070%), Immigrants from Turkey (5.1%, a difference of 0.090%), and Turkish (5.1%, a difference of 0.14%).
| Demographics | Rating | Rank | Disability Age 5 to 17 |
| Assyrians/Chaldeans/Syriacs | 100.0 /100 | #46 | Exceptional 5.0% |
| Vietnamese | 100.0 /100 | #47 | Exceptional 5.1% |
| Koreans | 100.0 /100 | #48 | Exceptional 5.1% |
| Immigrants from Western Asia | 100.0 /100 | #49 | Exceptional 5.1% |
| Argentineans | 99.9 /100 | #50 | Exceptional 5.1% |
| Turks | 99.9 /100 | #51 | Exceptional 5.1% |
| Immigrants from Fiji | 99.9 /100 | #52 | Exceptional 5.1% |
| Immigrants from Lithuania | 99.9 /100 | #53 | Exceptional 5.1% |
| Paraguayans | 99.9 /100 | #54 | Exceptional 5.1% |
| Laotians | 99.9 /100 | #55 | Exceptional 5.1% |
| Immigrants from Turkey | 99.9 /100 | #56 | Exceptional 5.1% |
| Immigrants from Poland | 99.9 /100 | #57 | Exceptional 5.1% |
| Immigrants from Ukraine | 99.9 /100 | #58 | Exceptional 5.1% |
| Immigrants from North Macedonia | 99.9 /100 | #59 | Exceptional 5.1% |
| Immigrants from Eastern Europe | 99.9 /100 | #60 | Exceptional 5.1% |
Immigrants from Lithuania Disability Age 5 to 17 Correlation Summary
| Measurement | Immigrants from Lithuania Data | Disability Age 5 to 17 Data |
| Minimum | 0.022% | 2.6% |
| Maximum | 3.8% | 9.7% |
| Range | 3.7% | 7.1% |
| Mean | 1.3% | 5.5% |
| Median | 1.1% | 5.1% |
| Interquartile 25% (IQ1) | 0.55% | 3.9% |
| Interquartile 75% (IQ3) | 1.7% | 7.0% |
| Interquartile Range (IQR) | 1.2% | 3.1% |
| Standard Deviation (Sample) | 0.95% | 2.0% |
| Standard Deviation (Population) | 0.93% | 2.0% |
Correlation Details
| Immigrants from Lithuania Percentile | Sample Size | Disability Age 5 to 17 |
[ 0.0% - 0.5% ] 0.022% | 102,938,440 | 5.4% |
[ 0.0% - 0.5% ] 0.13% | 8,070,291 | 4.8% |
[ 0.0% - 0.5% ] 0.23% | 3,110,609 | 5.1% |
[ 0.0% - 0.5% ] 0.31% | 1,180,824 | 5.4% |
[ 0.0% - 0.5% ] 0.41% | 558,439 | 3.6% |
[ 0.0% - 0.5% ] 0.50% | 353,538 | 4.9% |
[ 0.5% - 1.0% ] 0.61% | 268,661 | 3.9% |
[ 0.5% - 1.0% ] 0.69% | 184,189 | 4.3% |
[ 0.5% - 1.0% ] 0.80% | 60,545 | 2.6% |
[ 0.5% - 1.0% ] 0.87% | 106,892 | 4.6% |
[ 0.5% - 1.0% ] 0.96% | 19,741 | 5.1% |
[ 1.0% - 1.5% ] 1.06% | 56,209 | 8.8% |
[ 1.0% - 1.5% ] 1.14% | 118,371 | 5.2% |
[ 1.0% - 1.5% ] 1.22% | 6,743 | 6.5% |
[ 1.0% - 1.5% ] 1.37% | 33,093 | 2.9% |
[ 1.0% - 1.5% ] 1.43% | 54,197 | 3.5% |
[ 1.5% - 2.0% ] 1.56% | 27,051 | 5.1% |
[ 1.5% - 2.0% ] 1.60% | 35,501 | 3.9% |
[ 1.5% - 2.0% ] 1.67% | 12,778 | 9.7% |
[ 1.5% - 2.0% ] 1.82% | 16,833 | 5.8% |
[ 1.5% - 2.0% ] 1.85% | 51,206 | 3.8% |
[ 2.0% - 2.5% ] 2.15% | 10,069 | 7.4% |
[ 2.0% - 2.5% ] 2.31% | 4,968 | 9.0% |
[ 3.0% - 3.5% ] 3.47% | 24,670 | 8.9% |
[ 3.5% - 4.0% ] 3.76% | 17,558 | 7.8% |