Immigrants from Kuwait Disability Age 5 to 17

COMPARE

Immigrants from Kuwait
Race
Ancestry
AfghanAfricanAlaska NativeAlaskan AthabascanAlbanianAleutAlsatianAmericanApacheArabArapahoArgentineanArmenianAssyrian/Chaldean/SyriacAustralianAustrianBahamianBangladeshiBarbadianBasqueBelgianBelizeanBermudanBhutaneseBlackfeetBolivianBrazilianBritishBritish West IndianBulgarianBurmeseCajunCambodianCanadianCape VerdeanCarpatho RusynCelticCentral AmericanCentral American IndianCherokeeCheyenneChickasawChileanChineseChippewaChoctawColombianColvilleComancheCosta RicanCreeCreekCroatianCrowCubanCypriotCzechCzechoslovakianDanishDelawareDominicanDutchDutch West IndianEastern EuropeanEcuadorianEgyptianEnglishEstonianEthiopianEuropeanFijianFilipinoFinnishFrenchFrench American IndianFrench CanadianGermanGerman RussianGhanaianGreekGuamanian/ChamorroGuatemalanGuyaneseHaitianHmongHonduranHopiHoumaHungarianIcelanderIndian (Asian)IndonesianInupiatIranianIraqiIrishIroquoisIsraeliItalianJamaicanJapaneseJordanianKenyanKiowaKoreanLaotianLatvianLebaneseLiberianLithuanianLumbeeLuxembourgerMacedonianMalaysianMalteseMarshalleseMenomineeMexicanMexican American IndianMongolianMoroccanNative HawaiianNavajoNepaleseNew ZealanderNicaraguanNigerianNorthern EuropeanNorwegianOkinawanOsageOttawaPaiutePakistaniPalestinianPanamanianParaguayanPennsylvania GermanPeruvianPimaPolishPortuguesePotawatomiPuebloPuerto RicanPuget Sound SalishRomanianRussianSalvadoranSamoanScandinavianScotch-IrishScottishSeminoleSenegaleseSerbianShoshoneSierra LeoneanSiouxSlavicSlovakSloveneSomaliSouth AfricanSouth AmericanSouth American IndianSoviet UnionSpaniardSpanishSpanish AmericanSpanish American IndianSri LankanSubsaharan AfricanSudaneseSwedishSwissSyrianTaiwaneseThaiTlingit-HaidaTohono O'OdhamTonganTrinidadian and TobagonianTsimshianTurkishU.S. Virgin IslanderUgandanUkrainianUruguayanUteVenezuelanVietnameseWelshWest IndianYakamaYaquiYugoslavianYumanYup'ikZimbabwean
Immigration
NonimmigrantsImmigrantsAfghanistanAfricaAlbaniaArgentinaArmeniaAsiaAustraliaAustriaBahamasBangladeshBarbadosBelarusBelgiumBelizeBoliviaBosnia and HerzegovinaBrazilBulgariaBurma/MyanmarCabo VerdeCambodiaCameroonCanadaCaribbeanCentral AmericaChileChinaColombiaCongoCosta RicaCroatiaCubaCzechoslovakiaDenmarkDominicaDominican RepublicEastern AfricaEastern AsiaEastern EuropeEcuadorEgyptEl SalvadorEnglandEritreaEthiopiaEuropeFijiFranceGermanyGhanaGreeceGrenadaGuatemalaGuyanaHaitiHondurasHong KongHungaryIndiaIndonesiaIranIraqIrelandIsraelItalyJamaicaJapanJordanKazakhstanKenyaKoreaKuwaitLaosLatin AmericaLatviaLebanonLiberiaLithuaniaMalaysiaMexicoMicronesiaMiddle AfricaMoldovaMoroccoNepalNetherlandsNicaraguaNigeriaNorth AmericaNorth MacedoniaNorthern AfricaNorthern EuropeNorwayOceaniaPakistanPanamaPeruPhilippinesPolandPortugalRomaniaRussiaSaudi ArabiaScotlandSenegalSerbiaSierra LeoneSingaporeSomaliaSouth AfricaSouth AmericaSouth Central AsiaSouth Eastern AsiaSouthern EuropeSpainSri LankaSt. Vincent and the GrenadinesSudanSwedenSwitzerlandSyriaTaiwanThailandTrinidad and TobagoTurkeyUgandaUkraineUruguayUzbekistanVenezuelaVietnamWest IndiesWestern AfricaWestern AsiaWestern EuropeYemenZaireZimbabweAzores
Select to Compare
Race
Ancestry
AfghanAfricanAlaska NativeAlaskan AthabascanAlbanianAleutAlsatianAmericanApacheArabArapahoArgentineanArmenianAssyrian/Chaldean/SyriacAustralianAustrianBahamianBangladeshiBarbadianBasqueBelgianBelizeanBermudanBhutaneseBlackfeetBolivianBrazilianBritishBritish West IndianBulgarianBurmeseCajunCambodianCanadianCape VerdeanCarpatho RusynCelticCentral AmericanCentral American IndianCherokeeCheyenneChickasawChileanChineseChippewaChoctawColombianColvilleComancheCosta RicanCreeCreekCroatianCrowCubanCypriotCzechCzechoslovakianDanishDelawareDominicanDutchDutch West IndianEastern EuropeanEcuadorianEgyptianEnglishEstonianEthiopianEuropeanFijianFilipinoFinnishFrenchFrench American IndianFrench CanadianGermanGerman RussianGhanaianGreekGuamanian/ChamorroGuatemalanGuyaneseHaitianHmongHonduranHopiHoumaHungarianIcelanderIndian (Asian)IndonesianInupiatIranianIraqiIrishIroquoisIsraeliItalianJamaicanJapaneseJordanianKenyanKiowaKoreanLaotianLatvianLebaneseLiberianLithuanianLumbeeLuxembourgerMacedonianMalaysianMalteseMarshalleseMenomineeMexicanMexican American IndianMongolianMoroccanNative HawaiianNavajoNepaleseNew ZealanderNicaraguanNigerianNorthern EuropeanNorwegianOkinawanOsageOttawaPaiutePakistaniPalestinianPanamanianParaguayanPennsylvania GermanPeruvianPimaPolishPortuguesePotawatomiPuebloPuerto RicanPuget Sound SalishRomanianRussianSalvadoranSamoanScandinavianScotch-IrishScottishSeminoleSenegaleseSerbianShoshoneSierra LeoneanSiouxSlavicSlovakSloveneSomaliSouth AfricanSouth AmericanSouth American IndianSoviet UnionSpaniardSpanishSpanish AmericanSpanish American IndianSri LankanSubsaharan AfricanSudaneseSwedishSwissSyrianTaiwaneseThaiTlingit-HaidaTohono O'OdhamTonganTrinidadian and TobagonianTsimshianTurkishU.S. Virgin IslanderUgandanUkrainianUruguayanUteVenezuelanVietnameseWelshWest IndianYakamaYaquiYugoslavianYumanYup'ikZimbabwean
Immigration
NonimmigrantsImmigrantsAfghanistanAfricaAlbaniaArgentinaArmeniaAsiaAustraliaAustriaBahamasBangladeshBarbadosBelarusBelgiumBelizeBoliviaBosnia and HerzegovinaBrazilBulgariaBurma/MyanmarCabo VerdeCambodiaCameroonCanadaCaribbeanCentral AmericaChileChinaColombiaCongoCosta RicaCroatiaCubaCzechoslovakiaDenmarkDominicaDominican RepublicEastern AfricaEastern AsiaEastern EuropeEcuadorEgyptEl SalvadorEnglandEritreaEthiopiaEuropeFijiFranceGermanyGhanaGreeceGrenadaGuatemalaGuyanaHaitiHondurasHong KongHungaryIndiaIndonesiaIranIraqIrelandIsraelItalyJamaicaJapanJordanKazakhstanKenyaKoreaLaosLatin AmericaLatviaLebanonLiberiaLithuaniaMalaysiaMexicoMicronesiaMiddle AfricaMoldovaMoroccoNepalNetherlandsNicaraguaNigeriaNorth AmericaNorth MacedoniaNorthern AfricaNorthern EuropeNorwayOceaniaPakistanPanamaPeruPhilippinesPolandPortugalRomaniaRussiaSaudi ArabiaScotlandSenegalSerbiaSierra LeoneSingaporeSomaliaSouth AfricaSouth AmericaSouth Central AsiaSouth Eastern AsiaSouthern EuropeSpainSri LankaSt. Vincent and the GrenadinesSudanSwedenSwitzerlandSyriaTaiwanThailandTrinidad and TobagoTurkeyUgandaUkraineUruguayUzbekistanVenezuelaVietnamWest IndiesWestern AfricaWestern AsiaWestern EuropeYemenZaireZimbabweAzores
Disability Age 5 to 17
Income
Poverty
Unemployment
Labor Participation
Family Structure
Vehicle Availability
Education Level
Disability

Immigrants from Kuwait Disability Age 5 to 17
Exceptional

5.3%
DISABILITY | AGE 5 TO 17
99.4/ 100
METRIC RATING
90th/ 347
METRIC RANK

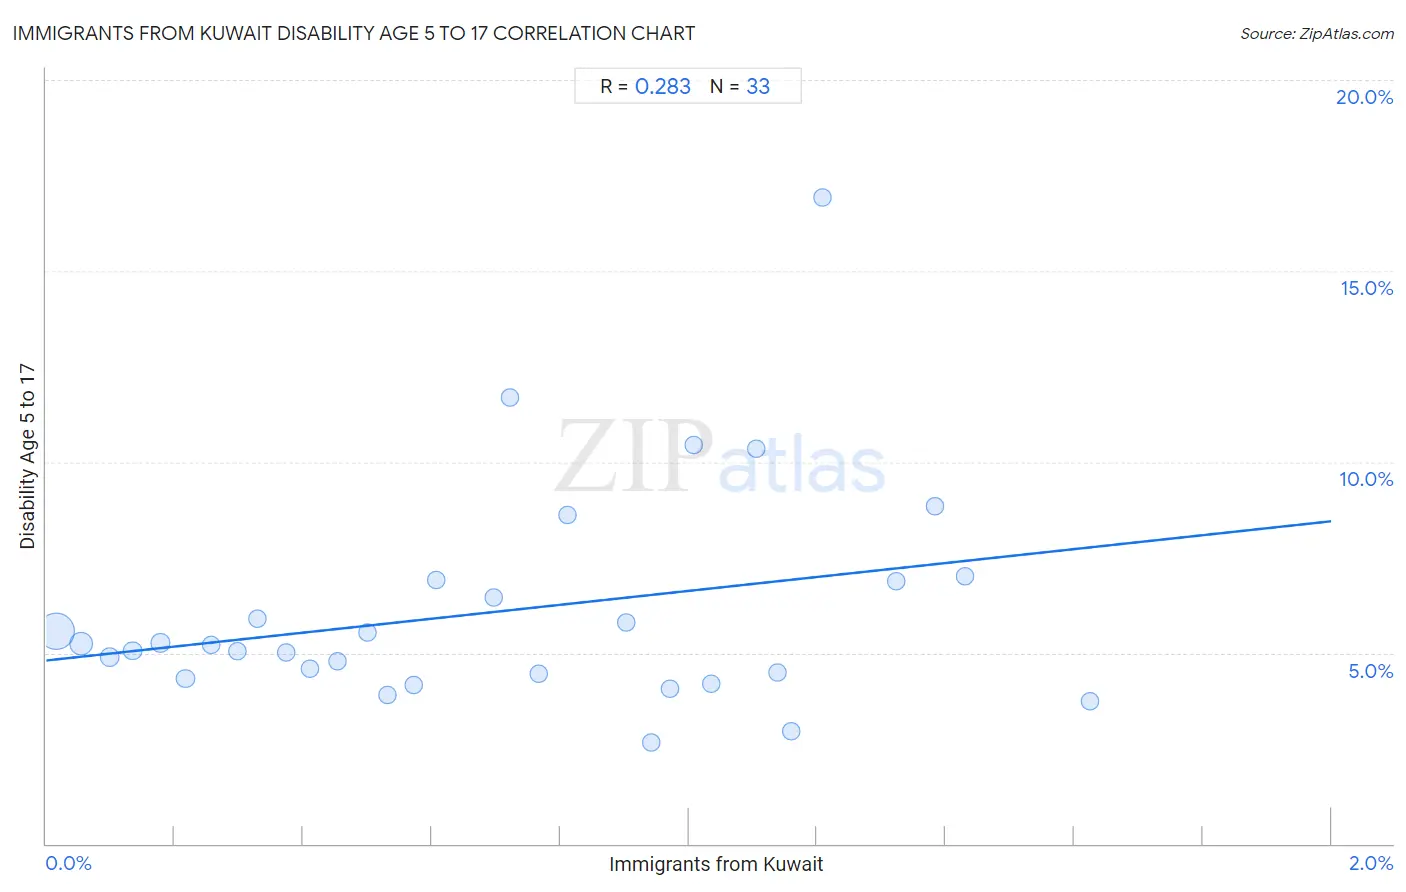
Immigrants from Kuwait Disability Age 5 to 17 Correlation Chart

The statistical analysis conducted on geographies consisting of 136,559,233 people shows a weak positive correlation between the proportion of Immigrants from Kuwait and percentage of population with a disability between the ages 5 and 17 in the United States with a correlation coefficient (R) of 0.283 and weighted average of 5.3%. On average, for every 1% (one percent) increase in Immigrants from Kuwait within a typical geography, there is an increase of 1.8% in percentage of population with a disability between the ages 5 and 17.
Immigrants from Kuwait Disability Age 5 to 17
It is essential to understand that the correlation between the percentage of Immigrants from Kuwait and percentage of population with a disability between the ages 5 and 17 does not imply a direct cause-and-effect relationship. It remains uncertain whether the presence of Immigrants from Kuwait influences an upward or downward trend in the level of percentage of population with a disability between the ages 5 and 17 within an area, or if Immigrants from Kuwait simply ended up residing in those areas with higher or lower levels of percentage of population with a disability between the ages 5 and 17 due to other factors.

Demographics Similar to Immigrants from Kuwait by Disability Age 5 to 17

In terms of disability age 5 to 17, the demographic groups most similar to Immigrants from Kuwait are Immigrants from Croatia (5.2%, a difference of 0.050%), Immigrants from Spain (5.2%, a difference of 0.050%), Eastern European (5.2%, a difference of 0.080%), Immigrants from St. Vincent and the Grenadines (5.2%, a difference of 0.13%), and Bulgarian (5.2%, a difference of 0.17%).
DemographicsRating | RankDisability Age 5 to 17
Immigrants from France
99.5
/100
|
#83
Exceptional
5.2%
Immigrants from Nicaragua
99.5
/100
|
#84
Exceptional
5.2%
Bulgarians
99.4
/100
|
#85
Exceptional
5.2%
Immigrants from St. Vincent and the Grenadines
99.4
/100
|
#86
Exceptional
5.2%
Eastern Europeans
99.4
/100
|
#87
Exceptional
5.2%
Immigrants from Croatia
99.4
/100
|
#88
Exceptional
5.2%
Immigrants from Spain
99.4
/100
|
#89
Exceptional
5.2%
Immigrants from Kuwait
99.4
/100
|
#90
Exceptional
5.3%
Mongolians
99.2
/100
|
#91
Exceptional
5.3%
Luxembourgers
99.2
/100
|
#92
Exceptional
5.3%
Immigrants from Peru
99.1
/100
|
#93
Exceptional
5.3%
Immigrants from Jordan
99.1
/100
|
#94
Exceptional
5.3%
Immigrants from Grenada
99.1
/100
|
#95
Exceptional
5.3%
Immigrants from El Salvador
99.0
/100
|
#96
Exceptional
5.3%
Immigrants from Europe
99.0
/100
|
#97
Exceptional
5.3%

Immigrants from Kuwait Disability Age 5 to 17 Correlation Summary

MeasurementImmigrants from Kuwait DataDisability Age 5 to 17 Data
Minimum0.016%2.7%
Maximum1.6%16.9%
Range1.6%14.3%
Mean0.70%6.1%
Median0.70%5.2%
Interquartile 25% (IQ1)0.31%4.4%
Interquartile 75% (IQ3)1.1%6.9%
Interquartile Range (IQR)0.76%2.5%
Standard Deviation (Sample)0.45%2.9%
Standard Deviation (Population)0.44%2.8%

Correlation Details

Immigrants from Kuwait PercentileSample SizeDisability Age 5 to 17
[
0.0%
-
0.5%
]
0.016%
90,380,8345.6%
[
0.0%
-
0.5%
]
0.055%
24,979,6765.2%
[
0.0%
-
0.5%
]
0.098%
9,235,4984.9%
[
0.0%
-
0.5%
]
0.14%
4,617,4725.1%
[
0.0%
-
0.5%
]
0.18%
2,147,3965.3%
[
0.0%
-
0.5%
]
0.22%
1,581,4064.3%
[
0.0%
-
0.5%
]
0.26%
931,2205.2%
[
0.0%
-
0.5%
]
0.30%
604,4955.0%
[
0.0%
-
0.5%
]
0.33%
394,8925.9%
[
0.0%
-
0.5%
]
0.37%
343,2395.0%
[
0.0%
-
0.5%
]
0.41%
444,7294.6%
[
0.0%
-
0.5%
]
0.45%
150,2984.8%
[
0.0%
-
0.5%
]
0.50%
118,9105.5%
[
0.5%
-
1.0%
]
0.53%
141,2223.9%
[
0.5%
-
1.0%
]
0.57%
65,6324.1%
[
0.5%
-
1.0%
]
0.61%
42,3646.9%
[
0.5%
-
1.0%
]
0.70%
47,5506.4%
[
0.5%
-
1.0%
]
0.72%
10,39311.7%
[
0.5%
-
1.0%
]
0.77%
21,7984.5%
[
0.5%
-
1.0%
]
0.81%
37,5838.6%
[
0.5%
-
1.0%
]
0.90%
23,1365.8%
[
0.5%
-
1.0%
]
0.94%
11,2652.7%
[
0.5%
-
1.0%
]
0.97%
41,4994.1%
[
1.0%
-
1.5%
]
1.01%
12,00710.4%
[
1.0%
-
1.5%
]
1.04%
8,4034.2%
[
1.0%
-
1.5%
]
1.11%
1,35710.3%
[
1.0%
-
1.5%
]
1.14%
30,2204.5%
[
1.0%
-
1.5%
]
1.16%
8632.9%
[
1.0%
-
1.5%
]
1.21%
21,34216.9%
[
1.0%
-
1.5%
]
1.32%
46,4736.9%
[
1.0%
-
1.5%
]
1.38%
5,2058.8%
[
1.0%
-
1.5%
]
1.43%
34,1487.0%
[
1.5%
-
2.0%
]
1.62%
26,7083.7%