Immigrants from Netherlands Disability Age 5 to 17

COMPARE

Immigrants from Netherlands
Race
Ancestry
AfghanAfricanAlaska NativeAlaskan AthabascanAlbanianAleutAlsatianAmericanApacheArabArapahoArgentineanArmenianAssyrian/Chaldean/SyriacAustralianAustrianBahamianBangladeshiBarbadianBasqueBelgianBelizeanBermudanBhutaneseBlackfeetBolivianBrazilianBritishBritish West IndianBulgarianBurmeseCajunCambodianCanadianCape VerdeanCarpatho RusynCelticCentral AmericanCentral American IndianCherokeeCheyenneChickasawChileanChineseChippewaChoctawColombianColvilleComancheCosta RicanCreeCreekCroatianCrowCubanCypriotCzechCzechoslovakianDanishDelawareDominicanDutchDutch West IndianEastern EuropeanEcuadorianEgyptianEnglishEstonianEthiopianEuropeanFijianFilipinoFinnishFrenchFrench American IndianFrench CanadianGermanGerman RussianGhanaianGreekGuamanian/ChamorroGuatemalanGuyaneseHaitianHmongHonduranHopiHoumaHungarianIcelanderIndian (Asian)IndonesianInupiatIranianIraqiIrishIroquoisIsraeliItalianJamaicanJapaneseJordanianKenyanKiowaKoreanLaotianLatvianLebaneseLiberianLithuanianLumbeeLuxembourgerMacedonianMalaysianMalteseMarshalleseMenomineeMexicanMexican American IndianMongolianMoroccanNative HawaiianNavajoNepaleseNew ZealanderNicaraguanNigerianNorthern EuropeanNorwegianOkinawanOsageOttawaPaiutePakistaniPalestinianPanamanianParaguayanPennsylvania GermanPeruvianPimaPolishPortuguesePotawatomiPuebloPuerto RicanPuget Sound SalishRomanianRussianSalvadoranSamoanScandinavianScotch-IrishScottishSeminoleSenegaleseSerbianShoshoneSierra LeoneanSiouxSlavicSlovakSloveneSomaliSouth AfricanSouth AmericanSouth American IndianSoviet UnionSpaniardSpanishSpanish AmericanSpanish American IndianSri LankanSubsaharan AfricanSudaneseSwedishSwissSyrianTaiwaneseThaiTlingit-HaidaTohono O'OdhamTonganTrinidadian and TobagonianTsimshianTurkishU.S. Virgin IslanderUgandanUkrainianUruguayanUteVenezuelanVietnameseWelshWest IndianYakamaYaquiYugoslavianYumanYup'ikZimbabwean
Immigration
NonimmigrantsImmigrantsAfghanistanAfricaAlbaniaArgentinaArmeniaAsiaAustraliaAustriaBahamasBangladeshBarbadosBelarusBelgiumBelizeBoliviaBosnia and HerzegovinaBrazilBulgariaBurma/MyanmarCabo VerdeCambodiaCameroonCanadaCaribbeanCentral AmericaChileChinaColombiaCongoCosta RicaCroatiaCubaCzechoslovakiaDenmarkDominicaDominican RepublicEastern AfricaEastern AsiaEastern EuropeEcuadorEgyptEl SalvadorEnglandEritreaEthiopiaEuropeFijiFranceGermanyGhanaGreeceGrenadaGuatemalaGuyanaHaitiHondurasHong KongHungaryIndiaIndonesiaIranIraqIrelandIsraelItalyJamaicaJapanJordanKazakhstanKenyaKoreaKuwaitLaosLatin AmericaLatviaLebanonLiberiaLithuaniaMalaysiaMexicoMicronesiaMiddle AfricaMoldovaMoroccoNepalNetherlandsNicaraguaNigeriaNorth AmericaNorth MacedoniaNorthern AfricaNorthern EuropeNorwayOceaniaPakistanPanamaPeruPhilippinesPolandPortugalRomaniaRussiaSaudi ArabiaScotlandSenegalSerbiaSierra LeoneSingaporeSomaliaSouth AfricaSouth AmericaSouth Central AsiaSouth Eastern AsiaSouthern EuropeSpainSri LankaSt. Vincent and the GrenadinesSudanSwedenSwitzerlandSyriaTaiwanThailandTrinidad and TobagoTurkeyUgandaUkraineUruguayUzbekistanVenezuelaVietnamWest IndiesWestern AfricaWestern AsiaWestern EuropeYemenZaireZimbabweAzores
Select to Compare
Race
Ancestry
AfghanAfricanAlaska NativeAlaskan AthabascanAlbanianAleutAlsatianAmericanApacheArabArapahoArgentineanArmenianAssyrian/Chaldean/SyriacAustralianAustrianBahamianBangladeshiBarbadianBasqueBelgianBelizeanBermudanBhutaneseBlackfeetBolivianBrazilianBritishBritish West IndianBulgarianBurmeseCajunCambodianCanadianCape VerdeanCarpatho RusynCelticCentral AmericanCentral American IndianCherokeeCheyenneChickasawChileanChineseChippewaChoctawColombianColvilleComancheCosta RicanCreeCreekCroatianCrowCubanCypriotCzechCzechoslovakianDanishDelawareDominicanDutchDutch West IndianEastern EuropeanEcuadorianEgyptianEnglishEstonianEthiopianEuropeanFijianFilipinoFinnishFrenchFrench American IndianFrench CanadianGermanGerman RussianGhanaianGreekGuamanian/ChamorroGuatemalanGuyaneseHaitianHmongHonduranHopiHoumaHungarianIcelanderIndian (Asian)IndonesianInupiatIranianIraqiIrishIroquoisIsraeliItalianJamaicanJapaneseJordanianKenyanKiowaKoreanLaotianLatvianLebaneseLiberianLithuanianLumbeeLuxembourgerMacedonianMalaysianMalteseMarshalleseMenomineeMexicanMexican American IndianMongolianMoroccanNative HawaiianNavajoNepaleseNew ZealanderNicaraguanNigerianNorthern EuropeanNorwegianOkinawanOsageOttawaPaiutePakistaniPalestinianPanamanianParaguayanPennsylvania GermanPeruvianPimaPolishPortuguesePotawatomiPuebloPuerto RicanPuget Sound SalishRomanianRussianSalvadoranSamoanScandinavianScotch-IrishScottishSeminoleSenegaleseSerbianShoshoneSierra LeoneanSiouxSlavicSlovakSloveneSomaliSouth AfricanSouth AmericanSouth American IndianSoviet UnionSpaniardSpanishSpanish AmericanSpanish American IndianSri LankanSubsaharan AfricanSudaneseSwedishSwissSyrianTaiwaneseThaiTlingit-HaidaTohono O'OdhamTonganTrinidadian and TobagonianTsimshianTurkishU.S. Virgin IslanderUgandanUkrainianUruguayanUteVenezuelanVietnameseWelshWest IndianYakamaYaquiYugoslavianYumanYup'ikZimbabwean
Immigration
NonimmigrantsImmigrantsAfghanistanAfricaAlbaniaArgentinaArmeniaAsiaAustraliaAustriaBahamasBangladeshBarbadosBelarusBelgiumBelizeBoliviaBosnia and HerzegovinaBrazilBulgariaBurma/MyanmarCabo VerdeCambodiaCameroonCanadaCaribbeanCentral AmericaChileChinaColombiaCongoCosta RicaCroatiaCubaCzechoslovakiaDenmarkDominicaDominican RepublicEastern AfricaEastern AsiaEastern EuropeEcuadorEgyptEl SalvadorEnglandEritreaEthiopiaEuropeFijiFranceGermanyGhanaGreeceGrenadaGuatemalaGuyanaHaitiHondurasHong KongHungaryIndiaIndonesiaIranIraqIrelandIsraelItalyJamaicaJapanJordanKazakhstanKenyaKoreaKuwaitLaosLatin AmericaLatviaLebanonLiberiaLithuaniaMalaysiaMexicoMicronesiaMiddle AfricaMoldovaMoroccoNepalNicaraguaNigeriaNorth AmericaNorth MacedoniaNorthern AfricaNorthern EuropeNorwayOceaniaPakistanPanamaPeruPhilippinesPolandPortugalRomaniaRussiaSaudi ArabiaScotlandSenegalSerbiaSierra LeoneSingaporeSomaliaSouth AfricaSouth AmericaSouth Central AsiaSouth Eastern AsiaSouthern EuropeSpainSri LankaSt. Vincent and the GrenadinesSudanSwedenSwitzerlandSyriaTaiwanThailandTrinidad and TobagoTurkeyUgandaUkraineUruguayUzbekistanVenezuelaVietnamWest IndiesWestern AfricaWestern AsiaWestern EuropeYemenZaireZimbabweAzores
Disability Age 5 to 17
Income
Poverty
Unemployment
Labor Participation
Family Structure
Vehicle Availability
Education Level
Disability

Immigrants from Netherlands Disability Age 5 to 17
Exceptional

5.4%
DISABILITY | AGE 5 TO 17
90.5/ 100
METRIC RATING
140th/ 347
METRIC RANK

Immigrants from Netherlands Disability Age 5 to 17 Correlation Chart

The statistical analysis conducted on geographies consisting of 236,298,961 people shows a weak positive correlation between the proportion of Immigrants from Netherlands and percentage of population with a disability between the ages 5 and 17 in the United States with a correlation coefficient (R) of 0.269 and weighted average of 5.4%. On average, for every 1% (one percent) increase in Immigrants from Netherlands within a typical geography, there is an increase of 0.83% in percentage of population with a disability between the ages 5 and 17.
Immigrants from Netherlands Disability Age 5 to 17
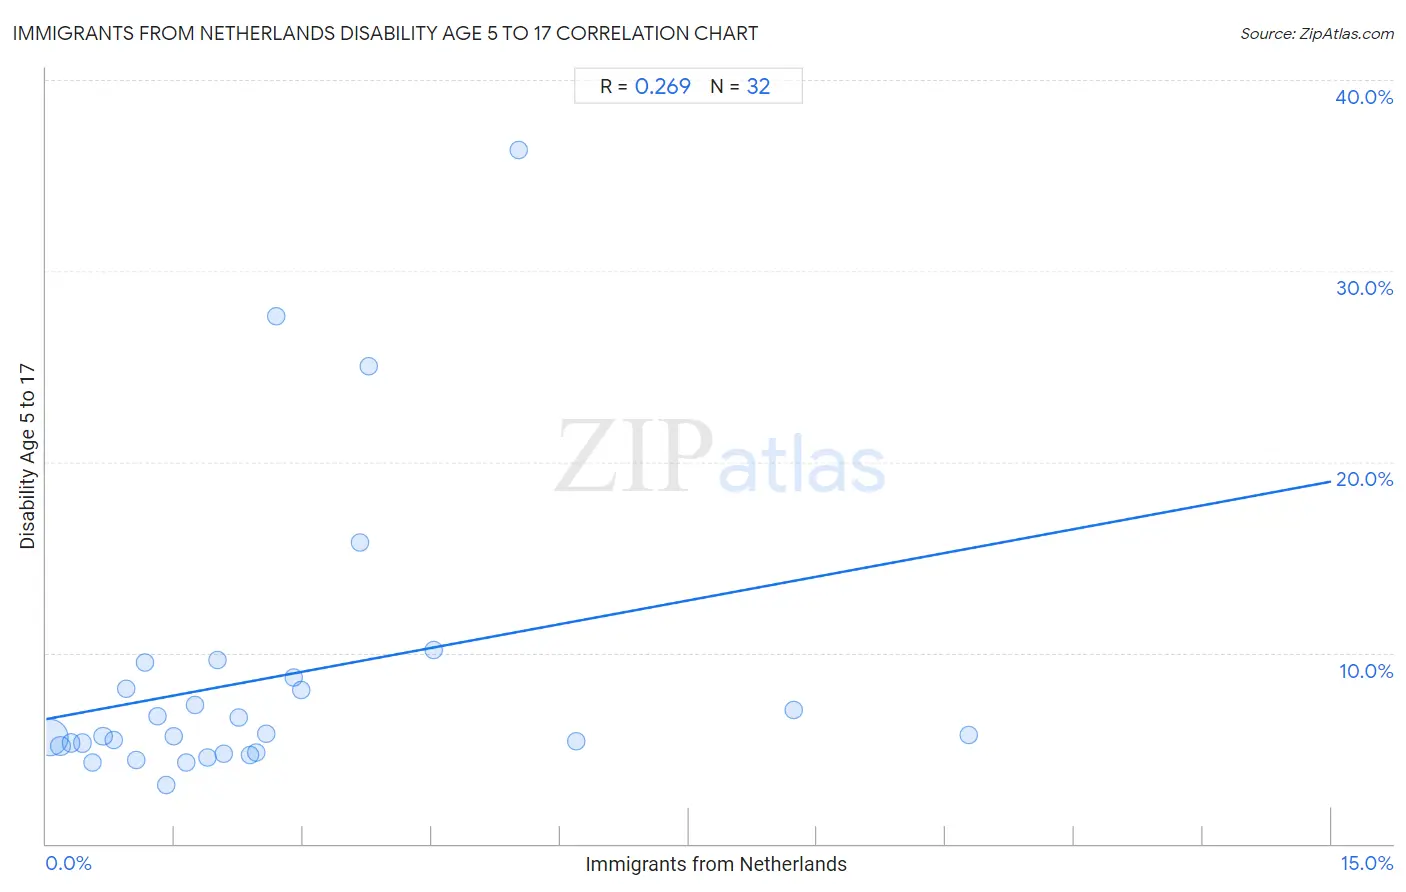
It is essential to understand that the correlation between the percentage of Immigrants from Netherlands and percentage of population with a disability between the ages 5 and 17 does not imply a direct cause-and-effect relationship. It remains uncertain whether the presence of Immigrants from Netherlands influences an upward or downward trend in the level of percentage of population with a disability between the ages 5 and 17 within an area, or if Immigrants from Netherlands simply ended up residing in those areas with higher or lower levels of percentage of population with a disability between the ages 5 and 17 due to other factors.

Demographics Similar to Immigrants from Netherlands by Disability Age 5 to 17

In terms of disability age 5 to 17, the demographic groups most similar to Immigrants from Netherlands are Immigrants from Oceania (5.4%, a difference of 0.050%), Belizean (5.4%, a difference of 0.050%), Navajo (5.4%, a difference of 0.060%), Immigrants from Denmark (5.4%, a difference of 0.14%), and South American Indian (5.5%, a difference of 0.17%).
DemographicsRating | RankDisability Age 5 to 17
Venezuelans
92.7
/100
|
#133
Exceptional
5.4%
Yuman
92.3
/100
|
#134
Exceptional
5.4%
Immigrants from Belize
91.7
/100
|
#135
Exceptional
5.4%
Immigrants from Denmark
91.4
/100
|
#136
Exceptional
5.4%
Navajo
90.9
/100
|
#137
Exceptional
5.4%
Immigrants from Oceania
90.8
/100
|
#138
Exceptional
5.4%
Belizeans
90.8
/100
|
#139
Exceptional
5.4%
Immigrants from Netherlands
90.5
/100
|
#140
Exceptional
5.4%
South American Indians
89.3
/100
|
#141
Excellent
5.5%
Colombians
88.0
/100
|
#142
Excellent
5.5%
Immigrants from Hungary
87.9
/100
|
#143
Excellent
5.5%
Pakistanis
87.3
/100
|
#144
Excellent
5.5%
Immigrants from Guatemala
86.6
/100
|
#145
Excellent
5.5%
Albanians
83.7
/100
|
#146
Excellent
5.5%
Immigrants from Albania
83.1
/100
|
#147
Excellent
5.5%

Immigrants from Netherlands Disability Age 5 to 17 Correlation Summary

MeasurementImmigrants from Netherlands DataDisability Age 5 to 17 Data
Minimum0.037%3.1%
Maximum10.8%36.4%
Range10.7%33.3%
Mean2.5%8.6%
Median1.9%5.7%
Interquartile 25% (IQ1)0.99%5.0%
Interquartile 75% (IQ3)2.9%8.4%
Interquartile Range (IQR)1.9%3.5%
Standard Deviation (Sample)2.4%7.4%
Standard Deviation (Population)2.4%7.3%

Correlation Details

Immigrants from Netherlands PercentileSample SizeDisability Age 5 to 17
[
0.0%
-
0.5%
]
0.037%
210,328,0885.6%
[
0.0%
-
0.5%
]
0.17%
18,578,4805.1%
[
0.0%
-
0.5%
]
0.29%
4,264,2425.3%
[
0.0%
-
0.5%
]
0.42%
1,460,3455.3%
[
0.5%
-
1.0%
]
0.54%
598,9244.3%
[
0.5%
-
1.0%
]
0.66%
301,3985.6%
[
0.5%
-
1.0%
]
0.79%
313,6945.4%
[
0.5%
-
1.0%
]
0.93%
72,4668.1%
[
1.0%
-
1.5%
]
1.05%
110,6744.4%
[
1.0%
-
1.5%
]
1.15%
58,4509.5%
[
1.0%
-
1.5%
]
1.29%
39,1526.7%
[
1.0%
-
1.5%
]
1.40%
55,9113.1%
[
1.0%
-
1.5%
]
1.49%
31,4305.6%
[
1.5%
-
2.0%
]
1.64%
11,5544.2%
[
1.5%
-
2.0%
]
1.73%
5,8407.3%
[
1.5%
-
2.0%
]
1.88%
3,0334.5%
[
1.5%
-
2.0%
]
2.00%
9,8509.6%
[
2.0%
-
2.5%
]
2.07%
22,8424.7%
[
2.0%
-
2.5%
]
2.24%
9376.6%
[
2.0%
-
2.5%
]
2.37%
13,8574.6%
[
2.0%
-
2.5%
]
2.45%
3,9614.8%
[
2.5%
-
3.0%
]
2.57%
5,2885.8%
[
2.5%
-
3.0%
]
2.69%
40927.7%
[
2.5%
-
3.0%
]
2.89%
2,5278.7%
[
2.5%
-
3.0%
]
2.97%
6738.0%
[
3.5%
-
4.0%
]
3.67%
40915.8%
[
3.5%
-
4.0%
]
3.77%
87525.0%
[
4.5%
-
5.0%
]
4.52%
46510.1%
[
5.5%
-
6.0%
]
5.52%
67036.4%
[
6.0%
-
6.5%
]
6.18%
1,3595.4%
[
8.5%
-
9.0%
]
8.72%
9637.0%
[
10.5%
-
11.0%
]
10.77%
1955.7%