Lithuanian Disability Age 5 to 17
COMPARE
Lithuanian
Select to Compare
Disability Age 5 to 17
Lithuanian Disability Age 5 to 17
5.8%
DISABILITY | AGE 5 TO 17
6.7/ 100
METRIC RATING
221st/ 347
METRIC RANK
Lithuanian Disability Age 5 to 17 Correlation Chart
The statistical analysis conducted on geographies consisting of 416,867,041 people shows a moderate positive correlation between the proportion of Lithuanians and percentage of population with a disability between the ages 5 and 17 in the United States with a correlation coefficient (R) of 0.413 and weighted average of 5.8%. On average, for every 1% (one percent) increase in Lithuanians within a typical geography, there is an increase of 0.79% in percentage of population with a disability between the ages 5 and 17.
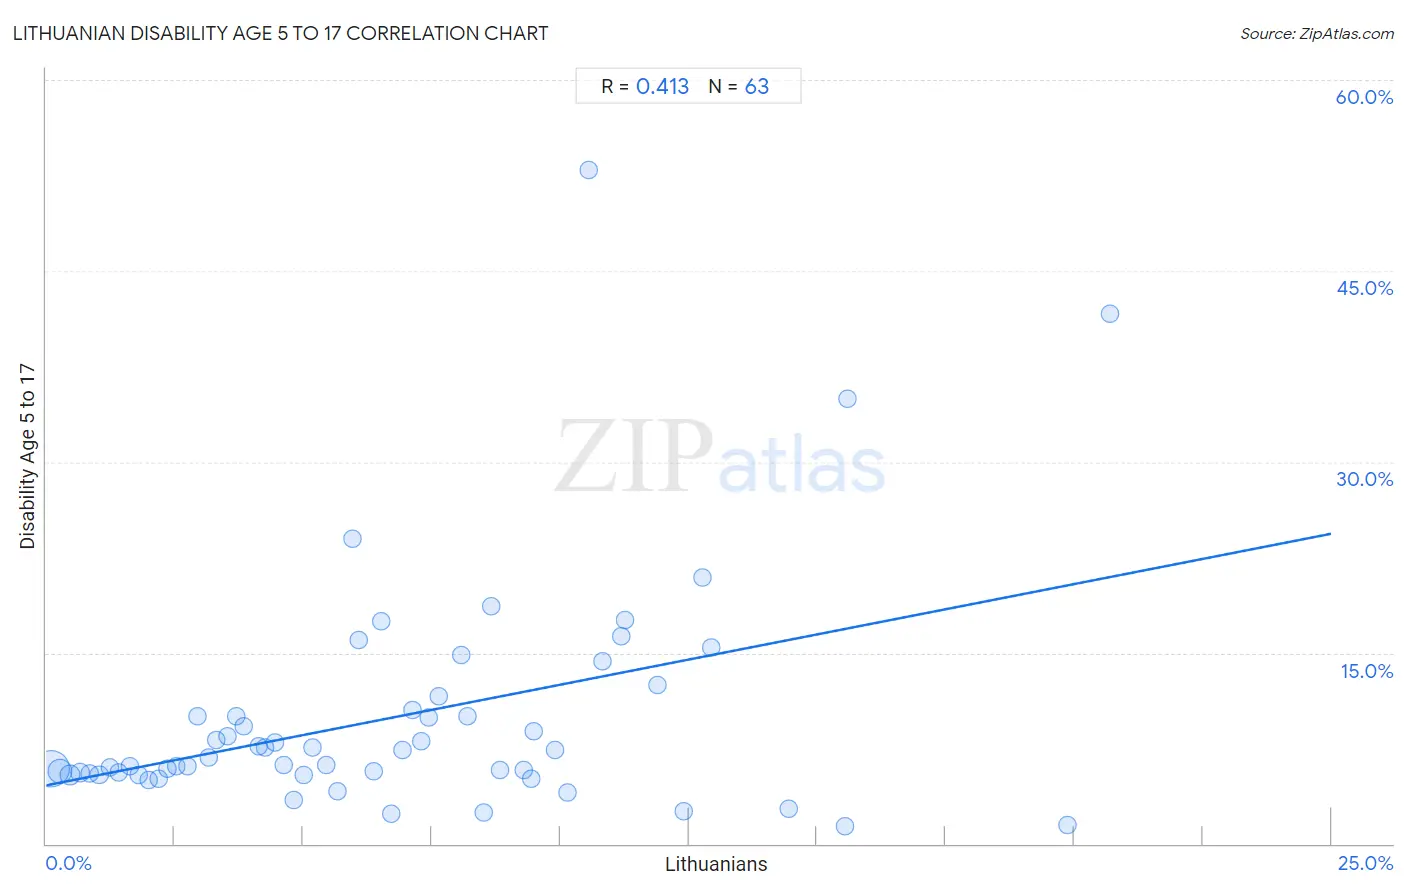
It is essential to understand that the correlation between the percentage of Lithuanians and percentage of population with a disability between the ages 5 and 17 does not imply a direct cause-and-effect relationship. It remains uncertain whether the presence of Lithuanians influences an upward or downward trend in the level of percentage of population with a disability between the ages 5 and 17 within an area, or if Lithuanians simply ended up residing in those areas with higher or lower levels of percentage of population with a disability between the ages 5 and 17 due to other factors.
Demographics Similar to Lithuanians by Disability Age 5 to 17
In terms of disability age 5 to 17, the demographic groups most similar to Lithuanians are Immigrants from Sudan (5.8%, a difference of 0.0%), Belgian (5.8%, a difference of 0.040%), Sierra Leonean (5.8%, a difference of 0.050%), Immigrants from Sierra Leone (5.8%, a difference of 0.070%), and Czech (5.8%, a difference of 0.12%).
| Demographics | Rating | Rank | Disability Age 5 to 17 |
| Immigrants from Morocco | 8.3 /100 | #214 | Tragic 5.8% |
| Swedes | 8.1 /100 | #215 | Tragic 5.8% |
| Nigerians | 7.5 /100 | #216 | Tragic 5.8% |
| Czechs | 7.4 /100 | #217 | Tragic 5.8% |
| Immigrants from Sierra Leone | 7.1 /100 | #218 | Tragic 5.8% |
| Sierra Leoneans | 7.0 /100 | #219 | Tragic 5.8% |
| Belgians | 6.9 /100 | #220 | Tragic 5.8% |
| Lithuanians | 6.7 /100 | #221 | Tragic 5.8% |
| Immigrants from Sudan | 6.7 /100 | #222 | Tragic 5.8% |
| Alsatians | 6.0 /100 | #223 | Tragic 5.8% |
| Mexicans | 5.7 /100 | #224 | Tragic 5.8% |
| Guamanians/Chamorros | 5.6 /100 | #225 | Tragic 5.8% |
| British West Indians | 5.4 /100 | #226 | Tragic 5.8% |
| Swiss | 5.1 /100 | #227 | Tragic 5.8% |
| Haitians | 4.8 /100 | #228 | Tragic 5.8% |
Lithuanian Disability Age 5 to 17 Correlation Summary
| Measurement | Lithuanian Data | Disability Age 5 to 17 Data |
| Minimum | 0.087% | 1.4% |
| Maximum | 20.7% | 52.9% |
| Range | 20.6% | 51.6% |
| Mean | 6.7% | 9.9% |
| Median | 6.1% | 6.7% |
| Interquartile 25% (IQ1) | 2.9% | 5.4% |
| Interquartile 75% (IQ3) | 9.5% | 10.5% |
| Interquartile Range (IQR) | 6.6% | 5.0% |
| Standard Deviation (Sample) | 4.7% | 9.1% |
| Standard Deviation (Population) | 4.7% | 9.0% |
Correlation Details
| Lithuanian Percentile | Sample Size | Disability Age 5 to 17 |
[ 0.0% - 0.5% ] 0.087% | 258,035,483 | 5.9% |
[ 0.0% - 0.5% ] 0.27% | 87,502,406 | 5.7% |
[ 0.0% - 0.5% ] 0.46% | 34,511,742 | 5.4% |
[ 0.5% - 1.0% ] 0.65% | 14,182,254 | 5.6% |
[ 0.5% - 1.0% ] 0.84% | 7,981,855 | 5.5% |
[ 1.0% - 1.5% ] 1.03% | 5,090,886 | 5.4% |
[ 1.0% - 1.5% ] 1.23% | 2,480,232 | 6.0% |
[ 1.0% - 1.5% ] 1.41% | 1,716,526 | 5.6% |
[ 1.5% - 2.0% ] 1.62% | 1,112,551 | 6.1% |
[ 1.5% - 2.0% ] 1.79% | 1,002,075 | 5.4% |
[ 1.5% - 2.0% ] 1.99% | 678,079 | 5.0% |
[ 2.0% - 2.5% ] 2.19% | 642,728 | 5.2% |
[ 2.0% - 2.5% ] 2.36% | 514,068 | 5.9% |
[ 2.5% - 3.0% ] 2.53% | 276,417 | 6.1% |
[ 2.5% - 3.0% ] 2.76% | 249,621 | 6.1% |
[ 2.5% - 3.0% ] 2.93% | 83,680 | 10.0% |
[ 3.0% - 3.5% ] 3.16% | 76,335 | 6.7% |
[ 3.0% - 3.5% ] 3.32% | 74,041 | 8.1% |
[ 3.5% - 4.0% ] 3.52% | 131,791 | 8.5% |
[ 3.5% - 4.0% ] 3.70% | 51,495 | 10.1% |
[ 3.5% - 4.0% ] 3.84% | 10,426 | 9.3% |
[ 4.0% - 4.5% ] 4.13% | 74,051 | 7.6% |
[ 4.0% - 4.5% ] 4.27% | 70,278 | 7.6% |
[ 4.0% - 4.5% ] 4.45% | 36,570 | 7.9% |
[ 4.5% - 5.0% ] 4.63% | 45,896 | 6.2% |
[ 4.5% - 5.0% ] 4.83% | 10,838 | 3.4% |
[ 5.0% - 5.5% ] 5.01% | 63,830 | 5.4% |
[ 5.0% - 5.5% ] 5.18% | 7,336 | 7.5% |
[ 5.0% - 5.5% ] 5.45% | 6,884 | 6.2% |
[ 5.5% - 6.0% ] 5.66% | 5,478 | 4.1% |
[ 5.5% - 6.0% ] 5.96% | 15,732 | 24.0% |
[ 6.0% - 6.5% ] 6.09% | 5,502 | 16.0% |
[ 6.0% - 6.5% ] 6.38% | 10,203 | 5.7% |
[ 6.5% - 7.0% ] 6.51% | 9,308 | 17.4% |
[ 6.5% - 7.0% ] 6.72% | 1,488 | 2.3% |
[ 6.5% - 7.0% ] 6.94% | 1,513 | 7.3% |
[ 7.0% - 7.5% ] 7.13% | 5,386 | 10.5% |
[ 7.0% - 7.5% ] 7.29% | 5,998 | 8.0% |
[ 7.0% - 7.5% ] 7.45% | 2,712 | 9.9% |
[ 7.5% - 8.0% ] 7.65% | 1,478 | 11.6% |
[ 8.0% - 8.5% ] 8.07% | 1,438 | 14.8% |
[ 8.0% - 8.5% ] 8.20% | 244 | 10.0% |
[ 8.5% - 9.0% ] 8.50% | 3,470 | 2.4% |
[ 8.5% - 9.0% ] 8.67% | 150 | 18.6% |
[ 8.5% - 9.0% ] 8.82% | 11,605 | 5.8% |
[ 9.0% - 9.5% ] 9.28% | 3,146 | 5.8% |
[ 9.0% - 9.5% ] 9.43% | 732 | 5.1% |
[ 9.0% - 9.5% ] 9.49% | 24,670 | 8.9% |
[ 9.5% - 10.0% ] 9.90% | 21,663 | 7.4% |
[ 10.0% - 10.5% ] 10.14% | 345 | 4.0% |
[ 10.5% - 11.0% ] 10.56% | 161 | 52.9% |
[ 10.5% - 11.0% ] 10.82% | 3,411 | 14.3% |
[ 11.0% - 11.5% ] 11.19% | 447 | 16.3% |
[ 11.0% - 11.5% ] 11.26% | 2,940 | 17.6% |
[ 11.5% - 12.0% ] 11.89% | 143 | 12.5% |
[ 12.0% - 12.5% ] 12.40% | 1,572 | 2.6% |
[ 12.5% - 13.0% ] 12.78% | 1,409 | 20.9% |
[ 12.5% - 13.0% ] 12.94% | 85 | 15.4% |
[ 14.0% - 14.5% ] 14.44% | 1,260 | 2.8% |
[ 15.5% - 16.0% ] 15.54% | 1,454 | 1.4% |
[ 15.5% - 16.0% ] 15.60% | 327 | 35.0% |
[ 19.5% - 20.0% ] 19.87% | 1,052 | 1.5% |
[ 20.5% - 21.0% ] 20.69% | 145 | 41.7% |