Cree Disability Age 5 to 17

COMPARE

Cree
Race
Ancestry
AfghanAfricanAlaska NativeAlaskan AthabascanAlbanianAleutAlsatianAmericanApacheArabArapahoArgentineanArmenianAssyrian/Chaldean/SyriacAustralianAustrianBahamianBangladeshiBarbadianBasqueBelgianBelizeanBermudanBhutaneseBlackfeetBolivianBrazilianBritishBritish West IndianBulgarianBurmeseCajunCambodianCanadianCape VerdeanCarpatho RusynCelticCentral AmericanCentral American IndianCherokeeCheyenneChickasawChileanChineseChippewaChoctawColombianColvilleComancheCosta RicanCreeCreekCroatianCrowCubanCypriotCzechCzechoslovakianDanishDelawareDominicanDutchDutch West IndianEastern EuropeanEcuadorianEgyptianEnglishEstonianEthiopianEuropeanFijianFilipinoFinnishFrenchFrench American IndianFrench CanadianGermanGerman RussianGhanaianGreekGuamanian/ChamorroGuatemalanGuyaneseHaitianHmongHonduranHopiHoumaHungarianIcelanderIndian (Asian)IndonesianInupiatIranianIraqiIrishIroquoisIsraeliItalianJamaicanJapaneseJordanianKenyanKiowaKoreanLaotianLatvianLebaneseLiberianLithuanianLumbeeLuxembourgerMacedonianMalaysianMalteseMarshalleseMenomineeMexicanMexican American IndianMongolianMoroccanNative HawaiianNavajoNepaleseNew ZealanderNicaraguanNigerianNorthern EuropeanNorwegianOkinawanOsageOttawaPaiutePakistaniPalestinianPanamanianParaguayanPennsylvania GermanPeruvianPimaPolishPortuguesePotawatomiPuebloPuerto RicanPuget Sound SalishRomanianRussianSalvadoranSamoanScandinavianScotch-IrishScottishSeminoleSenegaleseSerbianShoshoneSierra LeoneanSiouxSlavicSlovakSloveneSomaliSouth AfricanSouth AmericanSouth American IndianSoviet UnionSpaniardSpanishSpanish AmericanSpanish American IndianSri LankanSubsaharan AfricanSudaneseSwedishSwissSyrianTaiwaneseThaiTlingit-HaidaTohono O'OdhamTonganTrinidadian and TobagonianTsimshianTurkishU.S. Virgin IslanderUgandanUkrainianUruguayanUteVenezuelanVietnameseWelshWest IndianYakamaYaquiYugoslavianYumanYup'ikZimbabwean
Immigration
NonimmigrantsImmigrantsAfghanistanAfricaAlbaniaArgentinaArmeniaAsiaAustraliaAustriaBahamasBangladeshBarbadosBelarusBelgiumBelizeBoliviaBosnia and HerzegovinaBrazilBulgariaBurma/MyanmarCabo VerdeCambodiaCameroonCanadaCaribbeanCentral AmericaChileChinaColombiaCongoCosta RicaCroatiaCubaCzechoslovakiaDenmarkDominicaDominican RepublicEastern AfricaEastern AsiaEastern EuropeEcuadorEgyptEl SalvadorEnglandEritreaEthiopiaEuropeFijiFranceGermanyGhanaGreeceGrenadaGuatemalaGuyanaHaitiHondurasHong KongHungaryIndiaIndonesiaIranIraqIrelandIsraelItalyJamaicaJapanJordanKazakhstanKenyaKoreaKuwaitLaosLatin AmericaLatviaLebanonLiberiaLithuaniaMalaysiaMexicoMicronesiaMiddle AfricaMoldovaMoroccoNepalNetherlandsNicaraguaNigeriaNorth AmericaNorth MacedoniaNorthern AfricaNorthern EuropeNorwayOceaniaPakistanPanamaPeruPhilippinesPolandPortugalRomaniaRussiaSaudi ArabiaScotlandSenegalSerbiaSierra LeoneSingaporeSomaliaSouth AfricaSouth AmericaSouth Central AsiaSouth Eastern AsiaSouthern EuropeSpainSri LankaSt. Vincent and the GrenadinesSudanSwedenSwitzerlandSyriaTaiwanThailandTrinidad and TobagoTurkeyUgandaUkraineUruguayUzbekistanVenezuelaVietnamWest IndiesWestern AfricaWestern AsiaWestern EuropeYemenZaireZimbabweAzores
Select to Compare
Race
Ancestry
AfghanAfricanAlaska NativeAlaskan AthabascanAlbanianAleutAlsatianAmericanApacheArabArapahoArgentineanArmenianAssyrian/Chaldean/SyriacAustralianAustrianBahamianBangladeshiBarbadianBasqueBelgianBelizeanBermudanBhutaneseBlackfeetBolivianBrazilianBritishBritish West IndianBulgarianBurmeseCajunCambodianCanadianCape VerdeanCarpatho RusynCelticCentral AmericanCentral American IndianCherokeeCheyenneChickasawChileanChineseChippewaChoctawColombianColvilleComancheCosta RicanCreekCroatianCrowCubanCypriotCzechCzechoslovakianDanishDelawareDominicanDutchDutch West IndianEastern EuropeanEcuadorianEgyptianEnglishEstonianEthiopianEuropeanFijianFilipinoFinnishFrenchFrench American IndianFrench CanadianGermanGerman RussianGhanaianGreekGuamanian/ChamorroGuatemalanGuyaneseHaitianHmongHonduranHopiHoumaHungarianIcelanderIndian (Asian)IndonesianInupiatIranianIraqiIrishIroquoisIsraeliItalianJamaicanJapaneseJordanianKenyanKiowaKoreanLaotianLatvianLebaneseLiberianLithuanianLumbeeLuxembourgerMacedonianMalaysianMalteseMarshalleseMenomineeMexicanMexican American IndianMongolianMoroccanNative HawaiianNavajoNepaleseNew ZealanderNicaraguanNigerianNorthern EuropeanNorwegianOkinawanOsageOttawaPaiutePakistaniPalestinianPanamanianParaguayanPennsylvania GermanPeruvianPimaPolishPortuguesePotawatomiPuebloPuerto RicanPuget Sound SalishRomanianRussianSalvadoranSamoanScandinavianScotch-IrishScottishSeminoleSenegaleseSerbianShoshoneSierra LeoneanSiouxSlavicSlovakSloveneSomaliSouth AfricanSouth AmericanSouth American IndianSoviet UnionSpaniardSpanishSpanish AmericanSpanish American IndianSri LankanSubsaharan AfricanSudaneseSwedishSwissSyrianTaiwaneseThaiTlingit-HaidaTohono O'OdhamTonganTrinidadian and TobagonianTsimshianTurkishU.S. Virgin IslanderUgandanUkrainianUruguayanUteVenezuelanVietnameseWelshWest IndianYakamaYaquiYugoslavianYumanYup'ikZimbabwean
Immigration
NonimmigrantsImmigrantsAfghanistanAfricaAlbaniaArgentinaArmeniaAsiaAustraliaAustriaBahamasBangladeshBarbadosBelarusBelgiumBelizeBoliviaBosnia and HerzegovinaBrazilBulgariaBurma/MyanmarCabo VerdeCambodiaCameroonCanadaCaribbeanCentral AmericaChileChinaColombiaCongoCosta RicaCroatiaCubaCzechoslovakiaDenmarkDominicaDominican RepublicEastern AfricaEastern AsiaEastern EuropeEcuadorEgyptEl SalvadorEnglandEritreaEthiopiaEuropeFijiFranceGermanyGhanaGreeceGrenadaGuatemalaGuyanaHaitiHondurasHong KongHungaryIndiaIndonesiaIranIraqIrelandIsraelItalyJamaicaJapanJordanKazakhstanKenyaKoreaKuwaitLaosLatin AmericaLatviaLebanonLiberiaLithuaniaMalaysiaMexicoMicronesiaMiddle AfricaMoldovaMoroccoNepalNetherlandsNicaraguaNigeriaNorth AmericaNorth MacedoniaNorthern AfricaNorthern EuropeNorwayOceaniaPakistanPanamaPeruPhilippinesPolandPortugalRomaniaRussiaSaudi ArabiaScotlandSenegalSerbiaSierra LeoneSingaporeSomaliaSouth AfricaSouth AmericaSouth Central AsiaSouth Eastern AsiaSouthern EuropeSpainSri LankaSt. Vincent and the GrenadinesSudanSwedenSwitzerlandSyriaTaiwanThailandTrinidad and TobagoTurkeyUgandaUkraineUruguayUzbekistanVenezuelaVietnamWest IndiesWestern AfricaWestern AsiaWestern EuropeYemenZaireZimbabweAzores
Disability Age 5 to 17
Income
Poverty
Unemployment
Labor Participation
Family Structure
Vehicle Availability
Education Level
Disability

Cree Disability Age 5 to 17
Tragic

6.2%
DISABILITY | AGE 5 TO 17
0.0/ 100
METRIC RATING
295th/ 347
METRIC RANK

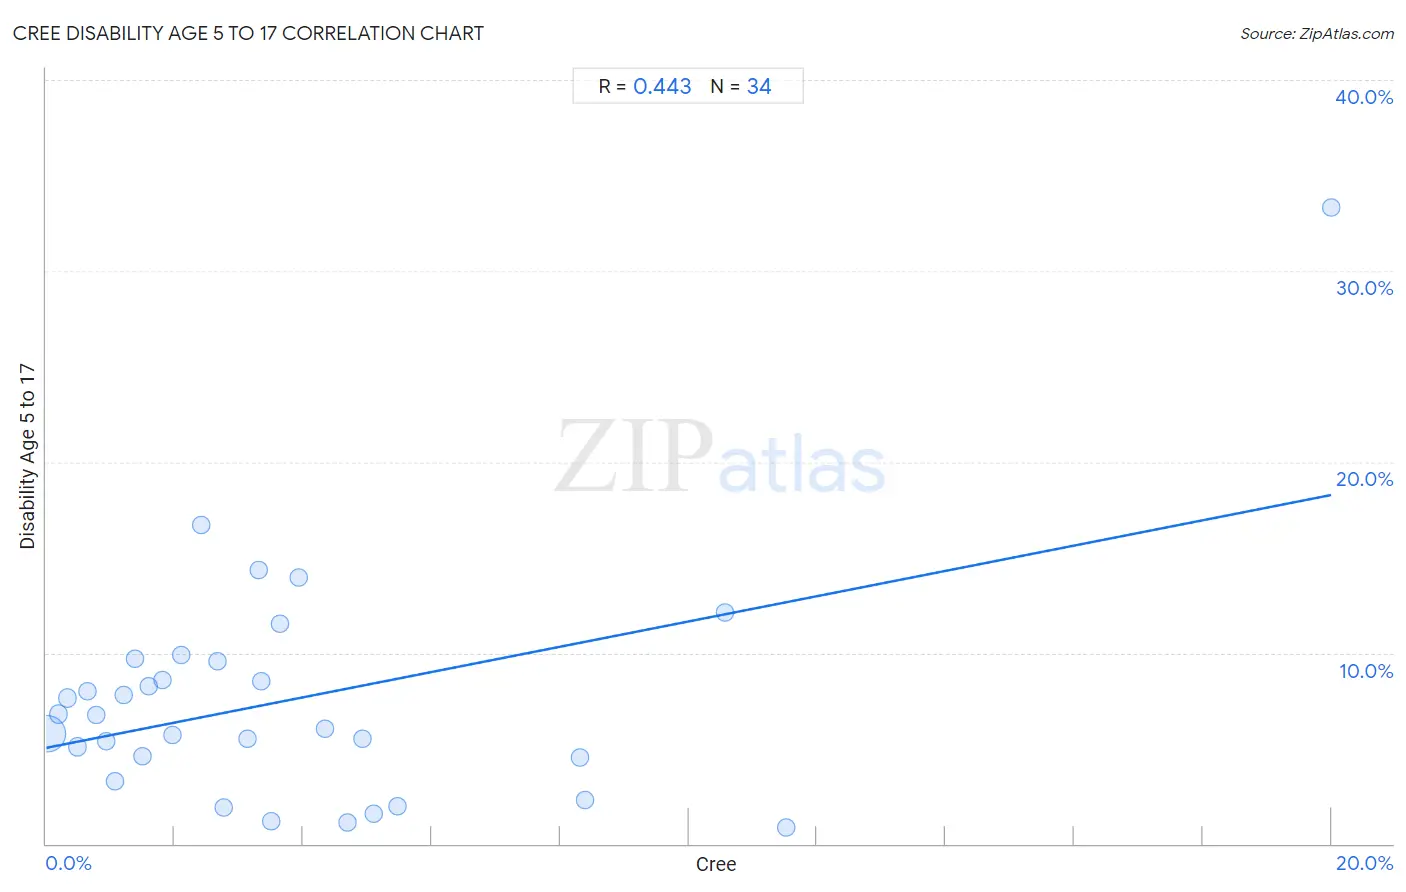
Cree Disability Age 5 to 17 Correlation Chart

The statistical analysis conducted on geographies consisting of 76,040,130 people shows a moderate positive correlation between the proportion of Cree and percentage of population with a disability between the ages 5 and 17 in the United States with a correlation coefficient (R) of 0.443 and weighted average of 6.2%. On average, for every 1% (one percent) increase in Cree within a typical geography, there is an increase of 0.66% in percentage of population with a disability between the ages 5 and 17.
Cree Disability Age 5 to 17
It is essential to understand that the correlation between the percentage of Cree and percentage of population with a disability between the ages 5 and 17 does not imply a direct cause-and-effect relationship. It remains uncertain whether the presence of Cree influences an upward or downward trend in the level of percentage of population with a disability between the ages 5 and 17 within an area, or if Cree simply ended up residing in those areas with higher or lower levels of percentage of population with a disability between the ages 5 and 17 due to other factors.

Demographics Similar to Cree by Disability Age 5 to 17

In terms of disability age 5 to 17, the demographic groups most similar to Cree are Spanish American (6.2%, a difference of 0.020%), Immigrants from Bahamas (6.2%, a difference of 0.15%), Lumbee (6.2%, a difference of 0.22%), Irish (6.2%, a difference of 0.27%), and Central American Indian (6.2%, a difference of 0.28%).
DemographicsRating | RankDisability Age 5 to 17
Jamaicans
0.0
/100
|
#288
Tragic
6.2%
Yaqui
0.0
/100
|
#289
Tragic
6.2%
Immigrants from Congo
0.0
/100
|
#290
Tragic
6.2%
Whites/Caucasians
0.0
/100
|
#291
Tragic
6.2%
Immigrants from Senegal
0.0
/100
|
#292
Tragic
6.2%
Central American Indians
0.0
/100
|
#293
Tragic
6.2%
Irish
0.0
/100
|
#294
Tragic
6.2%
Cree
0.0
/100
|
#295
Tragic
6.2%
Spanish Americans
0.0
/100
|
#296
Tragic
6.2%
Immigrants from Bahamas
0.0
/100
|
#297
Tragic
6.2%
Lumbee
0.0
/100
|
#298
Tragic
6.2%
Welsh
0.0
/100
|
#299
Tragic
6.3%
Carpatho Rusyns
0.0
/100
|
#300
Tragic
6.3%
U.S. Virgin Islanders
0.0
/100
|
#301
Tragic
6.3%
Celtics
0.0
/100
|
#302
Tragic
6.3%

Cree Disability Age 5 to 17 Correlation Summary

MeasurementCree DataDisability Age 5 to 17 Data
Minimum0.016%0.85%
Maximum20.0%33.3%
Range20.0%32.5%
Mean3.8%7.5%
Median2.7%6.4%
Interquartile 25% (IQ1)1.2%4.5%
Interquartile 75% (IQ3)4.7%9.6%
Interquartile Range (IQR)3.5%5.0%
Standard Deviation (Sample)4.0%6.0%
Standard Deviation (Population)4.0%6.0%

Correlation Details

Cree PercentileSample SizeDisability Age 5 to 17
[
0.0%
-
0.5%
]
0.016%
72,633,0025.7%
[
0.0%
-
0.5%
]
0.19%
2,176,5996.8%
[
0.0%
-
0.5%
]
0.33%
600,3787.6%
[
0.0%
-
0.5%
]
0.49%
310,5625.1%
[
0.5%
-
1.0%
]
0.65%
73,9848.0%
[
0.5%
-
1.0%
]
0.77%
89,9836.8%
[
0.5%
-
1.0%
]
0.93%
34,8545.4%
[
1.0%
-
1.5%
]
1.06%
2,5433.3%
[
1.0%
-
1.5%
]
1.21%
14,5677.8%
[
1.0%
-
1.5%
]
1.38%
16,1569.7%
[
1.0%
-
1.5%
]
1.49%
13,4674.6%
[
1.5%
-
2.0%
]
1.60%
33,2928.2%
[
1.5%
-
2.0%
]
1.81%
3868.6%
[
1.5%
-
2.0%
]
1.96%
7,7085.7%
[
2.0%
-
2.5%
]
2.10%
1,1899.9%
[
2.0%
-
2.5%
]
2.42%
3,22516.7%
[
2.5%
-
3.0%
]
2.67%
6,1469.6%
[
2.5%
-
3.0%
]
2.76%
8711.9%
[
3.0%
-
3.5%
]
3.14%
3,5085.5%
[
3.0%
-
3.5%
]
3.30%
1,84714.3%
[
3.0%
-
3.5%
]
3.34%
5998.5%
[
3.0%
-
3.5%
]
3.50%
1,6301.1%
[
3.5%
-
4.0%
]
3.64%
1,40311.5%
[
3.5%
-
4.0%
]
3.93%
78913.9%
[
4.0%
-
4.5%
]
4.33%
5546.0%
[
4.5%
-
5.0%
]
4.69%
4691.1%
[
4.5%
-
5.0%
]
4.93%
6905.5%
[
5.0%
-
5.5%
]
5.10%
2,6291.6%
[
5.0%
-
5.5%
]
5.46%
3,6622.0%
[
8.0%
-
8.5%
]
8.30%
2654.5%
[
8.0%
-
8.5%
]
8.38%
1,5992.3%
[
10.5%
-
11.0%
]
10.57%
57712.1%
[
11.5%
-
12.0%
]
11.53%
9370.85%
[
20.0%
-
20.5%
]
20.00%
6033.3%