Central American Indian Disability Age 5 to 17
COMPARE
Central American Indian
Select to Compare
Disability Age 5 to 17
Central American Indian Disability Age 5 to 17
6.2%
DISABILITY | AGE 5 TO 17
0.0/ 100
METRIC RATING
293rd/ 347
METRIC RANK
Central American Indian Disability Age 5 to 17 Correlation Chart
The statistical analysis conducted on geographies consisting of 324,856,277 people shows a slight positive correlation between the proportion of Central American Indians and percentage of population with a disability between the ages 5 and 17 in the United States with a correlation coefficient (R) of 0.097 and weighted average of 6.2%. On average, for every 1% (one percent) increase in Central American Indians within a typical geography, there is an increase of 0.054% in percentage of population with a disability between the ages 5 and 17.
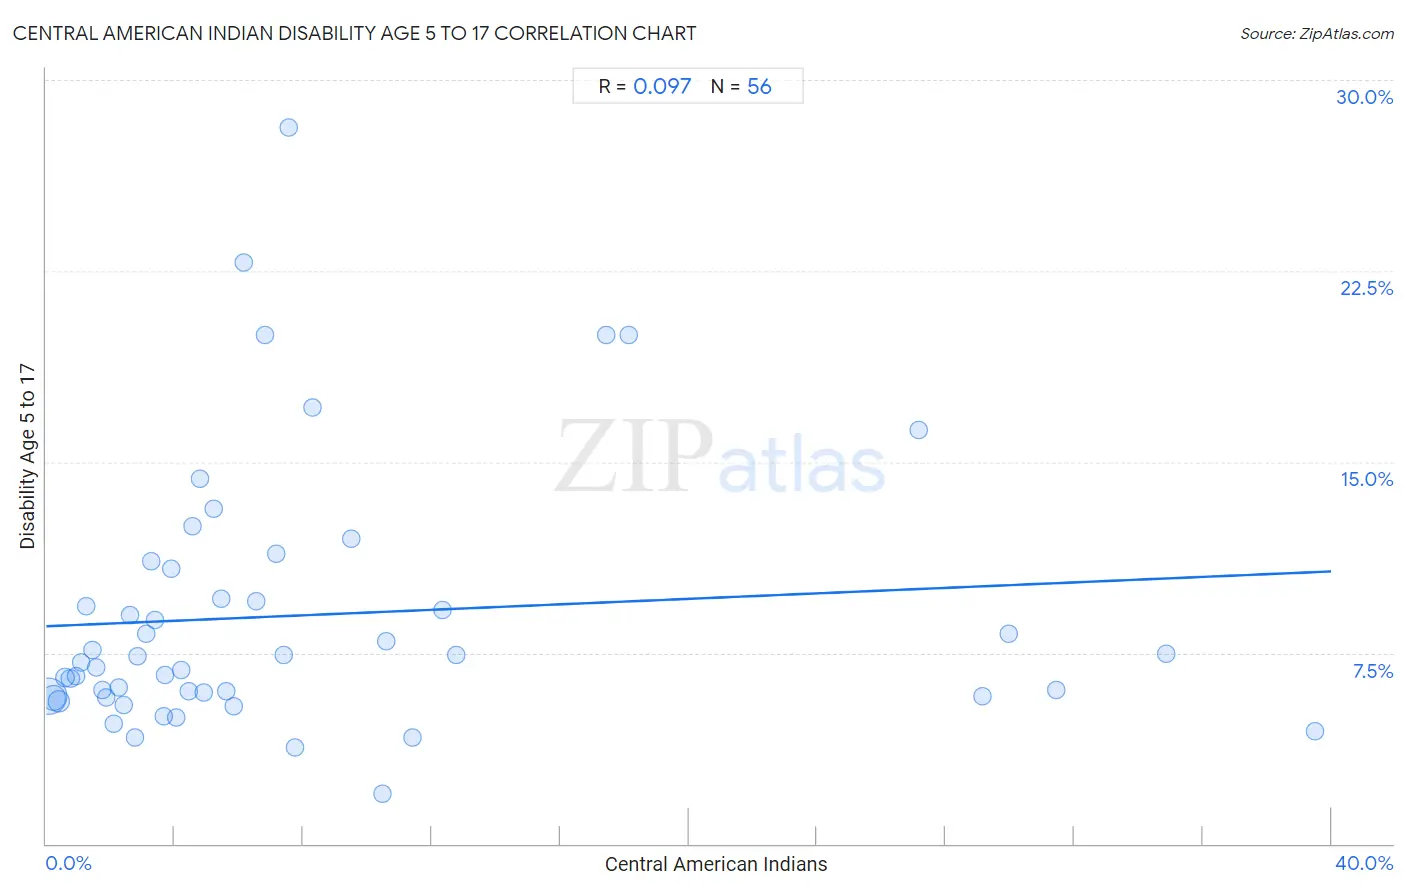
It is essential to understand that the correlation between the percentage of Central American Indians and percentage of population with a disability between the ages 5 and 17 does not imply a direct cause-and-effect relationship. It remains uncertain whether the presence of Central American Indians influences an upward or downward trend in the level of percentage of population with a disability between the ages 5 and 17 within an area, or if Central American Indians simply ended up residing in those areas with higher or lower levels of percentage of population with a disability between the ages 5 and 17 due to other factors.
Demographics Similar to Central American Indians by Disability Age 5 to 17
In terms of disability age 5 to 17, the demographic groups most similar to Central American Indians are Irish (6.2%, a difference of 0.0%), Immigrants from Senegal (6.2%, a difference of 0.020%), White/Caucasian (6.2%, a difference of 0.26%), Cree (6.2%, a difference of 0.28%), and Spanish American (6.2%, a difference of 0.30%).
| Demographics | Rating | Rank | Disability Age 5 to 17 |
| Colville | 0.0 /100 | #286 | Tragic 6.2% |
| Pima | 0.0 /100 | #287 | Tragic 6.2% |
| Jamaicans | 0.0 /100 | #288 | Tragic 6.2% |
| Yaqui | 0.0 /100 | #289 | Tragic 6.2% |
| Immigrants from Congo | 0.0 /100 | #290 | Tragic 6.2% |
| Whites/Caucasians | 0.0 /100 | #291 | Tragic 6.2% |
| Immigrants from Senegal | 0.0 /100 | #292 | Tragic 6.2% |
| Central American Indians | 0.0 /100 | #293 | Tragic 6.2% |
| Irish | 0.0 /100 | #294 | Tragic 6.2% |
| Cree | 0.0 /100 | #295 | Tragic 6.2% |
| Spanish Americans | 0.0 /100 | #296 | Tragic 6.2% |
| Immigrants from Bahamas | 0.0 /100 | #297 | Tragic 6.2% |
| Lumbee | 0.0 /100 | #298 | Tragic 6.2% |
| Welsh | 0.0 /100 | #299 | Tragic 6.3% |
| Carpatho Rusyns | 0.0 /100 | #300 | Tragic 6.3% |
Central American Indian Disability Age 5 to 17 Correlation Summary
| Measurement | Central American Indian Data | Disability Age 5 to 17 Data |
| Minimum | 0.074% | 2.0% |
| Maximum | 39.5% | 28.1% |
| Range | 39.4% | 26.2% |
| Mean | 8.0% | 9.0% |
| Median | 4.7% | 7.2% |
| Interquartile 25% (IQ1) | 2.3% | 5.8% |
| Interquartile 75% (IQ3) | 8.9% | 10.2% |
| Interquartile Range (IQR) | 6.6% | 4.4% |
| Standard Deviation (Sample) | 9.4% | 5.2% |
| Standard Deviation (Population) | 9.3% | 5.2% |
Correlation Details
| Central American Indian Percentile | Sample Size | Disability Age 5 to 17 |
[ 0.0% - 0.5% ] 0.074% | 190,415,685 | 5.8% |
[ 0.0% - 0.5% ] 0.23% | 68,412,564 | 5.7% |
[ 0.0% - 0.5% ] 0.39% | 36,845,911 | 5.6% |
[ 0.5% - 1.0% ] 0.57% | 12,449,771 | 6.6% |
[ 0.5% - 1.0% ] 0.75% | 5,691,618 | 6.5% |
[ 0.5% - 1.0% ] 0.92% | 3,739,816 | 6.6% |
[ 1.0% - 1.5% ] 1.08% | 2,132,519 | 7.1% |
[ 1.0% - 1.5% ] 1.26% | 1,067,799 | 9.3% |
[ 1.0% - 1.5% ] 1.43% | 822,504 | 7.6% |
[ 1.5% - 2.0% ] 1.57% | 956,378 | 6.9% |
[ 1.5% - 2.0% ] 1.74% | 625,623 | 6.1% |
[ 1.5% - 2.0% ] 1.88% | 266,089 | 5.8% |
[ 2.0% - 2.5% ] 2.10% | 268,753 | 4.7% |
[ 2.0% - 2.5% ] 2.26% | 129,367 | 6.1% |
[ 2.0% - 2.5% ] 2.42% | 160,901 | 5.5% |
[ 2.5% - 3.0% ] 2.62% | 86,703 | 9.0% |
[ 2.5% - 3.0% ] 2.75% | 74,828 | 4.2% |
[ 2.5% - 3.0% ] 2.86% | 59,659 | 7.4% |
[ 3.0% - 3.5% ] 3.10% | 105,543 | 8.2% |
[ 3.0% - 3.5% ] 3.29% | 71,139 | 11.1% |
[ 3.0% - 3.5% ] 3.39% | 65,315 | 8.8% |
[ 3.5% - 4.0% ] 3.66% | 28,937 | 5.0% |
[ 3.5% - 4.0% ] 3.70% | 43,517 | 6.7% |
[ 3.5% - 4.0% ] 3.90% | 11,175 | 10.8% |
[ 4.0% - 4.5% ] 4.06% | 4,806 | 4.9% |
[ 4.0% - 4.5% ] 4.20% | 36,509 | 6.8% |
[ 4.0% - 4.5% ] 4.43% | 11,055 | 6.0% |
[ 4.5% - 5.0% ] 4.57% | 36,405 | 12.4% |
[ 4.5% - 5.0% ] 4.79% | 9,497 | 14.3% |
[ 4.5% - 5.0% ] 4.90% | 7,444 | 5.9% |
[ 5.0% - 5.5% ] 5.21% | 12,200 | 13.1% |
[ 5.0% - 5.5% ] 5.47% | 3,860 | 9.6% |
[ 5.5% - 6.0% ] 5.60% | 13,822 | 6.0% |
[ 5.5% - 6.0% ] 5.82% | 20,869 | 5.4% |
[ 6.0% - 6.5% ] 6.15% | 7,577 | 22.8% |
[ 6.5% - 7.0% ] 6.53% | 39,406 | 9.5% |
[ 6.5% - 7.0% ] 6.79% | 2,223 | 20.0% |
[ 7.0% - 7.5% ] 7.17% | 1,366 | 11.4% |
[ 7.0% - 7.5% ] 7.38% | 149 | 7.4% |
[ 7.5% - 8.0% ] 7.57% | 185 | 28.1% |
[ 7.5% - 8.0% ] 7.74% | 5,722 | 3.8% |
[ 8.0% - 8.5% ] 8.30% | 795 | 17.1% |
[ 9.0% - 9.5% ] 9.48% | 485 | 12.0% |
[ 10.0% - 10.5% ] 10.46% | 736 | 2.0% |
[ 10.5% - 11.0% ] 10.58% | 10,137 | 8.0% |
[ 11.0% - 11.5% ] 11.39% | 4,162 | 4.2% |
[ 12.0% - 12.5% ] 12.32% | 2,386 | 9.2% |
[ 12.5% - 13.0% ] 12.77% | 141 | 7.4% |
[ 17.0% - 17.5% ] 17.44% | 1,674 | 20.0% |
[ 18.0% - 18.5% ] 18.13% | 1,611 | 20.0% |
[ 27.0% - 27.5% ] 27.16% | 3,233 | 16.2% |
[ 29.0% - 29.5% ] 29.16% | 2,658 | 5.8% |
[ 29.5% - 30.0% ] 29.95% | 25,542 | 8.2% |
[ 31.0% - 31.5% ] 31.46% | 4,562 | 6.0% |
[ 34.5% - 35.0% ] 34.88% | 37,642 | 7.5% |
[ 39.0% - 39.5% ] 39.48% | 15,304 | 4.4% |