Bolivian Disability Age 5 to 17
COMPARE
Bolivian
Select to Compare
Disability Age 5 to 17
Bolivian Disability Age 5 to 17
5.0%
DISABILITY | AGE 5 TO 17
100.0/ 100
METRIC RATING
35th/ 347
METRIC RANK
Bolivian Disability Age 5 to 17 Correlation Chart
The statistical analysis conducted on geographies consisting of 184,162,509 people shows a slight positive correlation between the proportion of Bolivians and percentage of population with a disability between the ages 5 and 17 in the United States with a correlation coefficient (R) of 0.088 and weighted average of 5.0%. On average, for every 1% (one percent) increase in Bolivians within a typical geography, there is an increase of 0.090% in percentage of population with a disability between the ages 5 and 17.
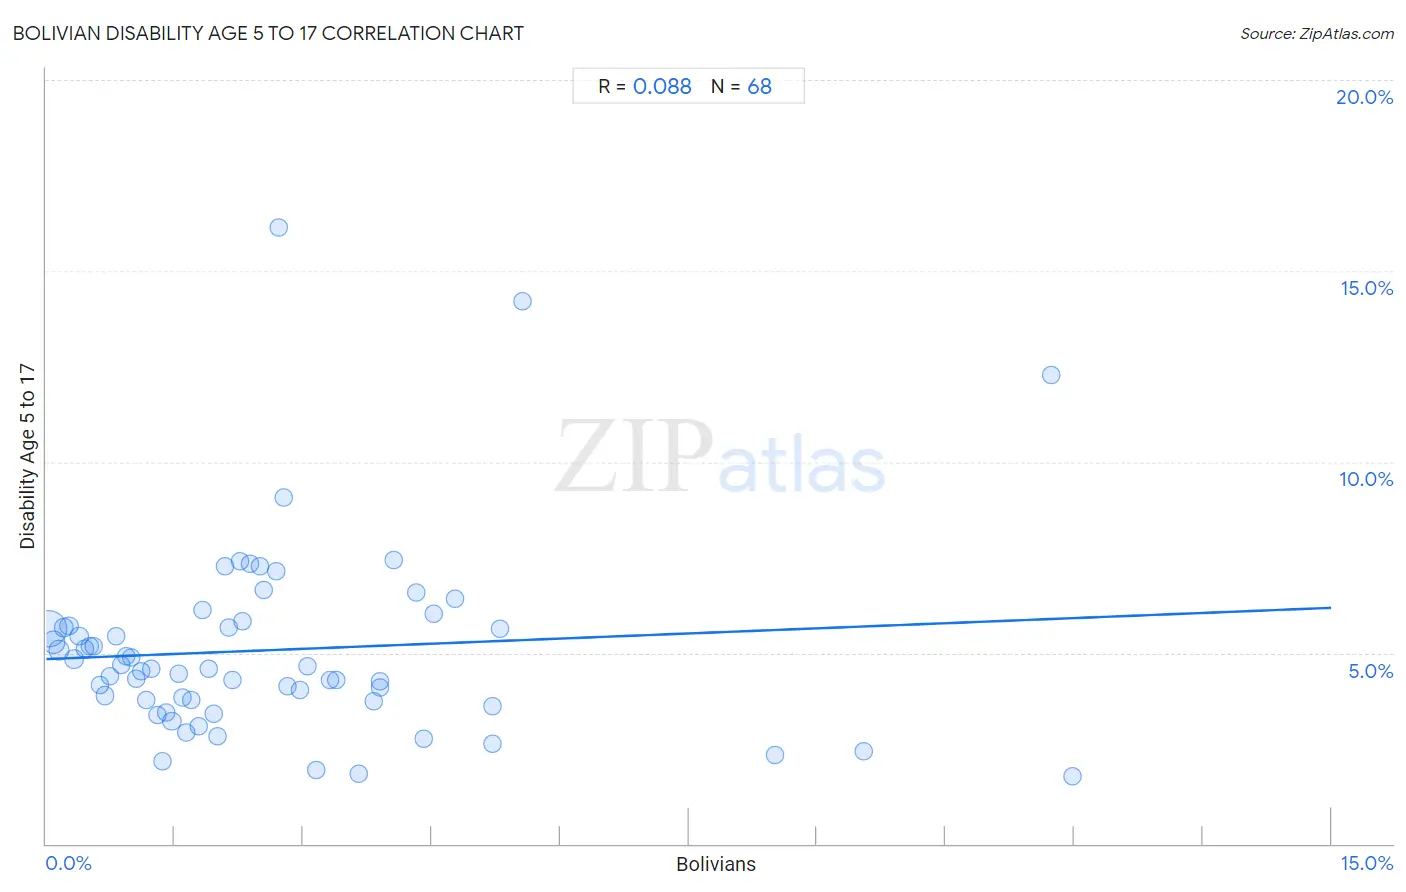
It is essential to understand that the correlation between the percentage of Bolivians and percentage of population with a disability between the ages 5 and 17 does not imply a direct cause-and-effect relationship. It remains uncertain whether the presence of Bolivians influences an upward or downward trend in the level of percentage of population with a disability between the ages 5 and 17 within an area, or if Bolivians simply ended up residing in those areas with higher or lower levels of percentage of population with a disability between the ages 5 and 17 due to other factors.
Demographics Similar to Bolivians by Disability Age 5 to 17
In terms of disability age 5 to 17, the demographic groups most similar to Bolivians are Immigrants from Egypt (5.0%, a difference of 0.050%), Immigrants from Belarus (5.0%, a difference of 0.070%), Immigrants from Philippines (5.0%, a difference of 0.11%), Immigrants from Argentina (5.0%, a difference of 0.12%), and Israeli (5.0%, a difference of 0.19%).
| Demographics | Rating | Rank | Disability Age 5 to 17 |
| Immigrants from Japan | 100.0 /100 | #28 | Exceptional 4.9% |
| Immigrants from Serbia | 100.0 /100 | #29 | Exceptional 4.9% |
| Immigrants from Malaysia | 100.0 /100 | #30 | Exceptional 5.0% |
| Immigrants from Pakistan | 100.0 /100 | #31 | Exceptional 5.0% |
| Soviet Union | 100.0 /100 | #32 | Exceptional 5.0% |
| Immigrants from Indonesia | 100.0 /100 | #33 | Exceptional 5.0% |
| Israelis | 100.0 /100 | #34 | Exceptional 5.0% |
| Bolivians | 100.0 /100 | #35 | Exceptional 5.0% |
| Immigrants from Egypt | 100.0 /100 | #36 | Exceptional 5.0% |
| Immigrants from Belarus | 100.0 /100 | #37 | Exceptional 5.0% |
| Immigrants from Philippines | 100.0 /100 | #38 | Exceptional 5.0% |
| Immigrants from Argentina | 100.0 /100 | #39 | Exceptional 5.0% |
| Okinawans | 100.0 /100 | #40 | Exceptional 5.0% |
| Immigrants from Australia | 100.0 /100 | #41 | Exceptional 5.0% |
| Immigrants from Sri Lanka | 100.0 /100 | #42 | Exceptional 5.0% |
Bolivian Disability Age 5 to 17 Correlation Summary
| Measurement | Bolivian Data | Disability Age 5 to 17 Data |
| Minimum | 0.028% | 1.8% |
| Maximum | 12.0% | 16.1% |
| Range | 12.0% | 14.4% |
| Mean | 2.6% | 5.1% |
| Median | 2.0% | 4.6% |
| Interquartile 25% (IQ1) | 1.0% | 3.7% |
| Interquartile 75% (IQ3) | 3.5% | 5.7% |
| Interquartile Range (IQR) | 2.5% | 1.9% |
| Standard Deviation (Sample) | 2.5% | 2.5% |
| Standard Deviation (Population) | 2.4% | 2.5% |
Correlation Details
| Bolivian Percentile | Sample Size | Disability Age 5 to 17 |
[ 0.0% - 0.5% ] 0.028% | 111,860,283 | 5.6% |
[ 0.0% - 0.5% ] 0.083% | 32,838,107 | 5.3% |
[ 0.0% - 0.5% ] 0.15% | 12,461,019 | 5.1% |
[ 0.0% - 0.5% ] 0.21% | 6,301,393 | 5.7% |
[ 0.0% - 0.5% ] 0.27% | 4,752,399 | 5.7% |
[ 0.0% - 0.5% ] 0.33% | 3,311,288 | 4.8% |
[ 0.0% - 0.5% ] 0.38% | 2,047,654 | 5.4% |
[ 0.0% - 0.5% ] 0.45% | 1,482,775 | 5.1% |
[ 0.5% - 1.0% ] 0.50% | 1,506,747 | 5.2% |
[ 0.5% - 1.0% ] 0.56% | 902,673 | 5.2% |
[ 0.5% - 1.0% ] 0.63% | 679,459 | 4.1% |
[ 0.5% - 1.0% ] 0.69% | 607,195 | 3.9% |
[ 0.5% - 1.0% ] 0.74% | 398,214 | 4.4% |
[ 0.5% - 1.0% ] 0.81% | 665,390 | 5.4% |
[ 0.5% - 1.0% ] 0.88% | 320,782 | 4.7% |
[ 0.5% - 1.0% ] 0.93% | 359,048 | 4.9% |
[ 0.5% - 1.0% ] 0.99% | 265,504 | 4.9% |
[ 1.0% - 1.5% ] 1.05% | 216,486 | 4.3% |
[ 1.0% - 1.5% ] 1.11% | 240,043 | 4.5% |
[ 1.0% - 1.5% ] 1.16% | 280,990 | 3.8% |
[ 1.0% - 1.5% ] 1.22% | 41,899 | 4.6% |
[ 1.0% - 1.5% ] 1.29% | 87,035 | 3.4% |
[ 1.0% - 1.5% ] 1.36% | 60,493 | 2.1% |
[ 1.0% - 1.5% ] 1.41% | 164,398 | 3.4% |
[ 1.0% - 1.5% ] 1.47% | 342,328 | 3.2% |
[ 1.5% - 2.0% ] 1.54% | 175,867 | 4.5% |
[ 1.5% - 2.0% ] 1.59% | 68,499 | 3.8% |
[ 1.5% - 2.0% ] 1.63% | 59,518 | 2.9% |
[ 1.5% - 2.0% ] 1.69% | 120,732 | 3.8% |
[ 1.5% - 2.0% ] 1.79% | 89,520 | 3.1% |
[ 1.5% - 2.0% ] 1.83% | 186,097 | 6.1% |
[ 1.5% - 2.0% ] 1.90% | 110,573 | 4.6% |
[ 1.5% - 2.0% ] 1.96% | 109,823 | 3.4% |
[ 2.0% - 2.5% ] 2.00% | 29,528 | 2.8% |
[ 2.0% - 2.5% ] 2.08% | 14,729 | 7.3% |
[ 2.0% - 2.5% ] 2.13% | 32,264 | 5.7% |
[ 2.0% - 2.5% ] 2.17% | 91,354 | 4.3% |
[ 2.0% - 2.5% ] 2.26% | 81,812 | 7.4% |
[ 2.0% - 2.5% ] 2.29% | 22,263 | 5.8% |
[ 2.0% - 2.5% ] 2.37% | 23,929 | 7.3% |
[ 2.0% - 2.5% ] 2.49% | 20,887 | 7.3% |
[ 2.5% - 3.0% ] 2.54% | 25,877 | 6.7% |
[ 2.5% - 3.0% ] 2.68% | 98,830 | 7.1% |
[ 2.5% - 3.0% ] 2.71% | 12,337 | 16.1% |
[ 2.5% - 3.0% ] 2.77% | 17,788 | 9.1% |
[ 2.5% - 3.0% ] 2.82% | 26,573 | 4.1% |
[ 2.5% - 3.0% ] 2.96% | 44,228 | 4.0% |
[ 3.0% - 3.5% ] 3.05% | 24,785 | 4.7% |
[ 3.0% - 3.5% ] 3.16% | 6,238 | 1.9% |
[ 3.0% - 3.5% ] 3.31% | 46,749 | 4.3% |
[ 3.0% - 3.5% ] 3.38% | 139,797 | 4.3% |
[ 3.5% - 4.0% ] 3.65% | 8,024 | 1.8% |
[ 3.5% - 4.0% ] 3.82% | 1,572 | 3.7% |
[ 3.5% - 4.0% ] 3.89% | 6,916 | 4.1% |
[ 3.5% - 4.0% ] 3.90% | 52,359 | 4.2% |
[ 4.0% - 4.5% ] 4.06% | 33,110 | 7.4% |
[ 4.0% - 4.5% ] 4.33% | 42,310 | 6.6% |
[ 4.0% - 4.5% ] 4.41% | 42,330 | 2.7% |
[ 4.5% - 5.0% ] 4.52% | 12,818 | 6.0% |
[ 4.5% - 5.0% ] 4.77% | 2,641 | 6.4% |
[ 5.0% - 5.5% ] 5.21% | 6,510 | 2.6% |
[ 5.0% - 5.5% ] 5.22% | 6,500 | 3.6% |
[ 5.0% - 5.5% ] 5.30% | 736 | 5.6% |
[ 5.5% - 6.0% ] 5.56% | 1,277 | 14.2% |
[ 8.5% - 9.0% ] 8.51% | 34,860 | 2.3% |
[ 9.5% - 10.0% ] 9.54% | 31,121 | 2.4% |
[ 11.5% - 12.0% ] 11.73% | 1,202 | 12.3% |
[ 11.5% - 12.0% ] 11.98% | 4,024 | 1.8% |