British West Indian Disability Age 5 to 17
COMPARE
British West Indian
Select to Compare
Disability Age 5 to 17
British West Indian Disability Age 5 to 17
5.8%
DISABILITY | AGE 5 TO 17
5.4/ 100
METRIC RATING
226th/ 347
METRIC RANK
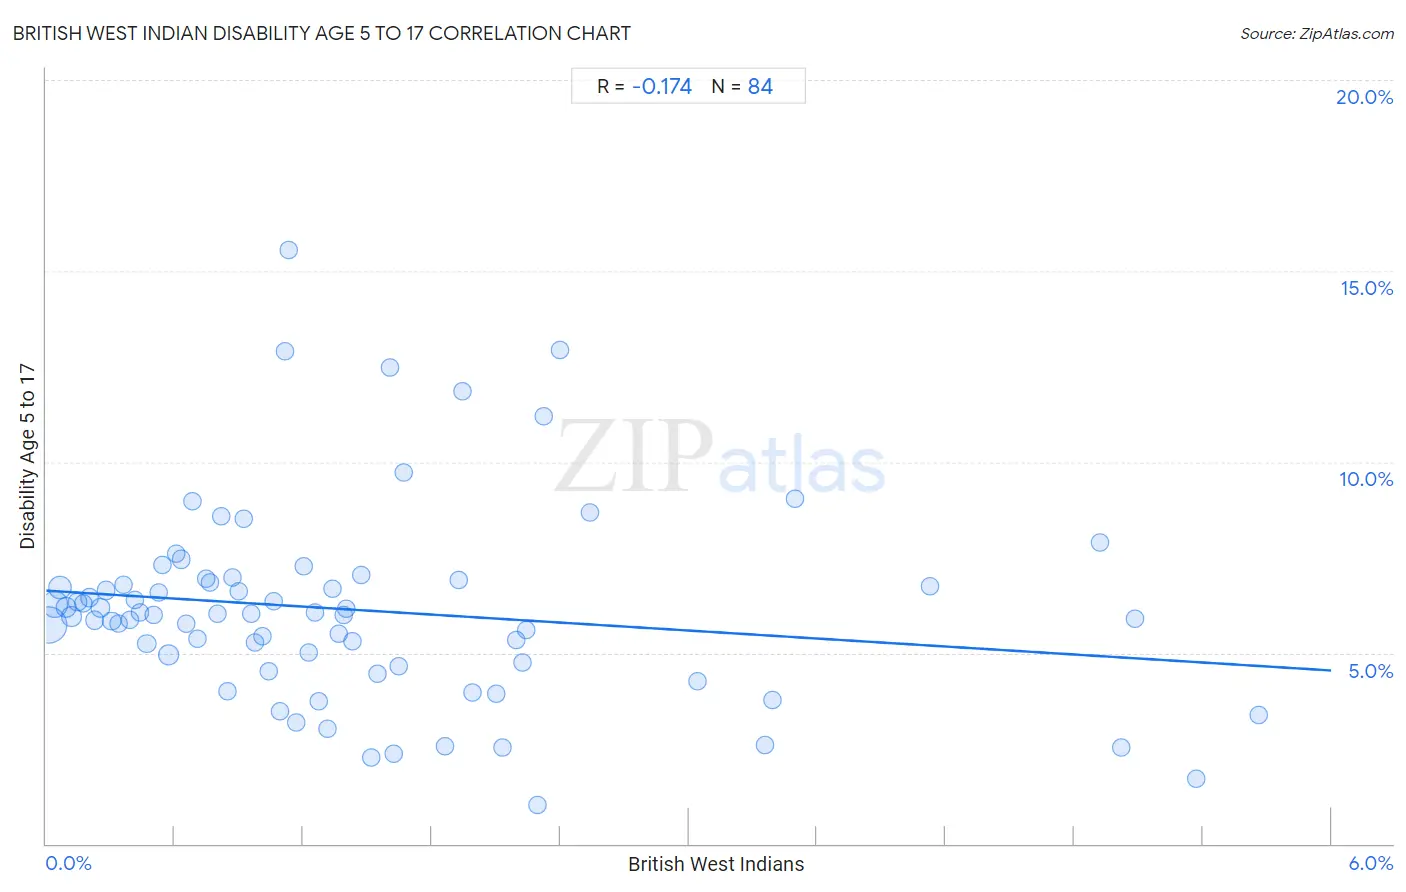
British West Indian Disability Age 5 to 17 Correlation Chart
The statistical analysis conducted on geographies consisting of 152,257,483 people shows a poor negative correlation between the proportion of British West Indians and percentage of population with a disability between the ages 5 and 17 in the United States with a correlation coefficient (R) of -0.174 and weighted average of 5.8%. On average, for every 1% (one percent) increase in British West Indians within a typical geography, there is a decrease of 0.35% in percentage of population with a disability between the ages 5 and 17.
It is essential to understand that the correlation between the percentage of British West Indians and percentage of population with a disability between the ages 5 and 17 does not imply a direct cause-and-effect relationship. It remains uncertain whether the presence of British West Indians influences an upward or downward trend in the level of percentage of population with a disability between the ages 5 and 17 within an area, or if British West Indians simply ended up residing in those areas with higher or lower levels of percentage of population with a disability between the ages 5 and 17 due to other factors.
Demographics Similar to British West Indians by Disability Age 5 to 17
In terms of disability age 5 to 17, the demographic groups most similar to British West Indians are Guamanian/Chamorro (5.8%, a difference of 0.040%), Mexican (5.8%, a difference of 0.060%), Swiss (5.8%, a difference of 0.080%), Alsatian (5.8%, a difference of 0.12%), and Haitian (5.8%, a difference of 0.16%).
| Demographics | Rating | Rank | Disability Age 5 to 17 |
| Sierra Leoneans | 7.0 /100 | #219 | Tragic 5.8% |
| Belgians | 6.9 /100 | #220 | Tragic 5.8% |
| Lithuanians | 6.7 /100 | #221 | Tragic 5.8% |
| Immigrants from Sudan | 6.7 /100 | #222 | Tragic 5.8% |
| Alsatians | 6.0 /100 | #223 | Tragic 5.8% |
| Mexicans | 5.7 /100 | #224 | Tragic 5.8% |
| Guamanians/Chamorros | 5.6 /100 | #225 | Tragic 5.8% |
| British West Indians | 5.4 /100 | #226 | Tragic 5.8% |
| Swiss | 5.1 /100 | #227 | Tragic 5.8% |
| Haitians | 4.8 /100 | #228 | Tragic 5.8% |
| Bangladeshis | 4.8 /100 | #229 | Tragic 5.8% |
| Ghanaians | 4.7 /100 | #230 | Tragic 5.8% |
| Europeans | 4.5 /100 | #231 | Tragic 5.8% |
| Immigrants from Laos | 3.8 /100 | #232 | Tragic 5.8% |
| Immigrants from West Indies | 3.5 /100 | #233 | Tragic 5.8% |
British West Indian Disability Age 5 to 17 Correlation Summary
| Measurement | British West Indian Data | Disability Age 5 to 17 Data |
| Minimum | 0.011% | 1.0% |
| Maximum | 5.7% | 15.5% |
| Range | 5.6% | 14.5% |
| Mean | 1.5% | 6.1% |
| Median | 1.1% | 6.0% |
| Interquartile 25% (IQ1) | 0.56% | 4.7% |
| Interquartile 75% (IQ3) | 1.9% | 6.9% |
| Interquartile Range (IQR) | 1.4% | 2.2% |
| Standard Deviation (Sample) | 1.3% | 2.6% |
| Standard Deviation (Population) | 1.3% | 2.6% |
Correlation Details
| British West Indian Percentile | Sample Size | Disability Age 5 to 17 |
[ 0.0% - 0.5% ] 0.011% | 60,127,408 | 5.7% |
[ 0.0% - 0.5% ] 0.039% | 24,579,479 | 6.3% |
[ 0.0% - 0.5% ] 0.065% | 15,809,408 | 6.7% |
[ 0.0% - 0.5% ] 0.093% | 8,695,332 | 6.2% |
[ 0.0% - 0.5% ] 0.12% | 6,190,945 | 5.9% |
[ 0.0% - 0.5% ] 0.15% | 3,595,746 | 6.3% |
[ 0.0% - 0.5% ] 0.17% | 2,706,310 | 6.3% |
[ 0.0% - 0.5% ] 0.20% | 3,227,701 | 6.5% |
[ 0.0% - 0.5% ] 0.23% | 2,436,718 | 5.8% |
[ 0.0% - 0.5% ] 0.25% | 1,711,600 | 6.2% |
[ 0.0% - 0.5% ] 0.28% | 1,156,592 | 6.6% |
[ 0.0% - 0.5% ] 0.31% | 1,555,466 | 5.8% |
[ 0.0% - 0.5% ] 0.34% | 1,154,634 | 5.8% |
[ 0.0% - 0.5% ] 0.36% | 1,403,830 | 6.8% |
[ 0.0% - 0.5% ] 0.39% | 804,946 | 5.9% |
[ 0.0% - 0.5% ] 0.42% | 741,221 | 6.4% |
[ 0.0% - 0.5% ] 0.44% | 397,109 | 6.1% |
[ 0.0% - 0.5% ] 0.47% | 573,261 | 5.2% |
[ 0.5% - 1.0% ] 0.50% | 476,700 | 6.0% |
[ 0.5% - 1.0% ] 0.52% | 341,465 | 6.6% |
[ 0.5% - 1.0% ] 0.54% | 318,485 | 7.3% |
[ 0.5% - 1.0% ] 0.57% | 8,842,643 | 5.0% |
[ 0.5% - 1.0% ] 0.61% | 455,332 | 7.6% |
[ 0.5% - 1.0% ] 0.63% | 251,733 | 7.4% |
[ 0.5% - 1.0% ] 0.65% | 250,722 | 5.7% |
[ 0.5% - 1.0% ] 0.68% | 234,078 | 9.0% |
[ 0.5% - 1.0% ] 0.71% | 171,871 | 5.4% |
[ 0.5% - 1.0% ] 0.74% | 387,503 | 6.9% |
[ 0.5% - 1.0% ] 0.77% | 238,911 | 6.8% |
[ 0.5% - 1.0% ] 0.80% | 168,947 | 6.0% |
[ 0.5% - 1.0% ] 0.82% | 149,233 | 8.6% |
[ 0.5% - 1.0% ] 0.85% | 46,861 | 4.0% |
[ 0.5% - 1.0% ] 0.87% | 137,333 | 7.0% |
[ 0.5% - 1.0% ] 0.90% | 72,026 | 6.6% |
[ 0.5% - 1.0% ] 0.92% | 60,034 | 8.5% |
[ 0.5% - 1.0% ] 0.96% | 155,934 | 6.0% |
[ 0.5% - 1.0% ] 0.98% | 86,863 | 5.3% |
[ 1.0% - 1.5% ] 1.01% | 154,385 | 5.4% |
[ 1.0% - 1.5% ] 1.04% | 145,363 | 4.5% |
[ 1.0% - 1.5% ] 1.06% | 184,841 | 6.4% |
[ 1.0% - 1.5% ] 1.09% | 40,870 | 3.5% |
[ 1.0% - 1.5% ] 1.11% | 987 | 12.9% |
[ 1.0% - 1.5% ] 1.13% | 13,586 | 15.5% |
[ 1.0% - 1.5% ] 1.17% | 79,656 | 3.2% |
[ 1.0% - 1.5% ] 1.20% | 49,688 | 7.3% |
[ 1.0% - 1.5% ] 1.23% | 92,388 | 5.0% |
[ 1.0% - 1.5% ] 1.26% | 148,054 | 6.0% |
[ 1.0% - 1.5% ] 1.27% | 37,866 | 3.7% |
[ 1.0% - 1.5% ] 1.31% | 19,384 | 3.0% |
[ 1.0% - 1.5% ] 1.34% | 11,452 | 6.7% |
[ 1.0% - 1.5% ] 1.37% | 12,234 | 5.5% |
[ 1.0% - 1.5% ] 1.39% | 36,471 | 6.0% |
[ 1.0% - 1.5% ] 1.40% | 84,111 | 6.1% |
[ 1.0% - 1.5% ] 1.43% | 73,987 | 5.3% |
[ 1.0% - 1.5% ] 1.47% | 83,165 | 7.0% |
[ 1.5% - 2.0% ] 1.52% | 44,267 | 2.2% |
[ 1.5% - 2.0% ] 1.55% | 43,148 | 4.4% |
[ 1.5% - 2.0% ] 1.60% | 9,972 | 12.5% |
[ 1.5% - 2.0% ] 1.62% | 96,164 | 2.4% |
[ 1.5% - 2.0% ] 1.65% | 19,959 | 4.6% |
[ 1.5% - 2.0% ] 1.67% | 12,978 | 9.7% |
[ 1.5% - 2.0% ] 1.86% | 98,977 | 2.6% |
[ 1.5% - 2.0% ] 1.93% | 9,285 | 6.9% |
[ 1.5% - 2.0% ] 1.94% | 4,734 | 11.9% |
[ 1.5% - 2.0% ] 1.99% | 62,373 | 4.0% |
[ 2.0% - 2.5% ] 2.10% | 58,476 | 3.9% |
[ 2.0% - 2.5% ] 2.13% | 1,594 | 2.5% |
[ 2.0% - 2.5% ] 2.20% | 7,424 | 5.3% |
[ 2.0% - 2.5% ] 2.22% | 15,390 | 4.8% |
[ 2.0% - 2.5% ] 2.24% | 1,025 | 5.6% |
[ 2.0% - 2.5% ] 2.29% | 2,703 | 1.0% |
[ 2.0% - 2.5% ] 2.32% | 55,336 | 11.2% |
[ 2.0% - 2.5% ] 2.40% | 24,994 | 12.9% |
[ 2.5% - 3.0% ] 2.54% | 203,405 | 8.7% |
[ 3.0% - 3.5% ] 3.04% | 49,104 | 4.2% |
[ 3.0% - 3.5% ] 3.36% | 1,459 | 2.6% |
[ 3.0% - 3.5% ] 3.39% | 101,053 | 3.8% |
[ 3.0% - 3.5% ] 3.50% | 6,408 | 9.0% |
[ 4.0% - 4.5% ] 4.13% | 4,336 | 6.8% |
[ 4.5% - 5.0% ] 4.92% | 84,006 | 7.9% |
[ 5.0% - 5.5% ] 5.02% | 100,082 | 2.5% |
[ 5.0% - 5.5% ] 5.08% | 69,131 | 5.9% |
[ 5.0% - 5.5% ] 5.37% | 8,326 | 1.7% |
[ 5.5% - 6.0% ] 5.66% | 78,506 | 3.4% |