Eastern European Disability Age 5 to 17
COMPARE
Eastern European
Select to Compare
Disability Age 5 to 17
Eastern European Disability Age 5 to 17
5.2%
DISABILITY | AGE 5 TO 17
99.4/ 100
METRIC RATING
87th/ 347
METRIC RANK
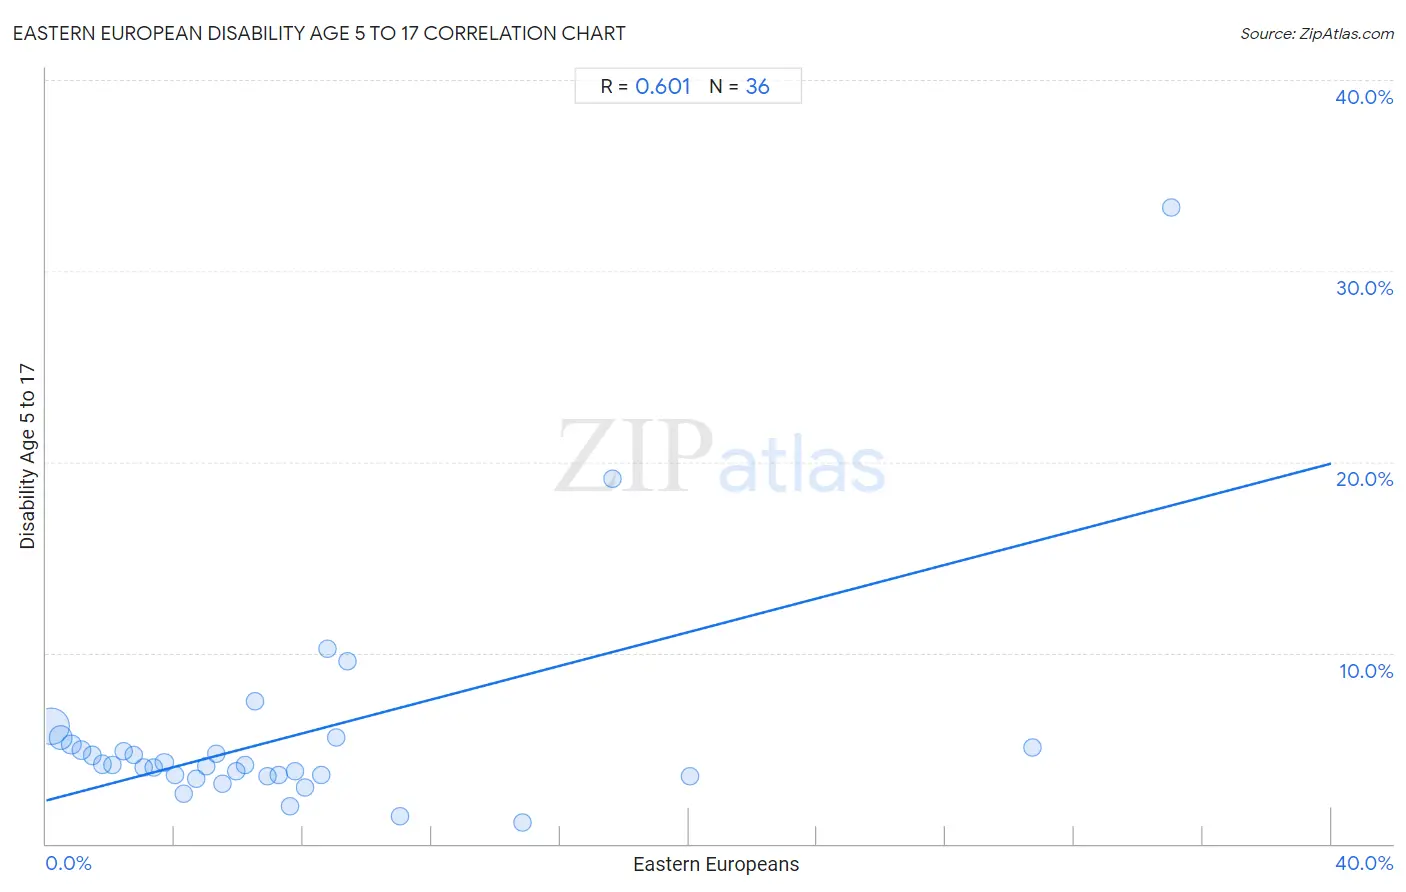
Eastern European Disability Age 5 to 17 Correlation Chart
The statistical analysis conducted on geographies consisting of 455,060,458 people shows a significant positive correlation between the proportion of Eastern Europeans and percentage of population with a disability between the ages 5 and 17 in the United States with a correlation coefficient (R) of 0.601 and weighted average of 5.2%. On average, for every 1% (one percent) increase in Eastern Europeans within a typical geography, there is an increase of 0.44% in percentage of population with a disability between the ages 5 and 17.
It is essential to understand that the correlation between the percentage of Eastern Europeans and percentage of population with a disability between the ages 5 and 17 does not imply a direct cause-and-effect relationship. It remains uncertain whether the presence of Eastern Europeans influences an upward or downward trend in the level of percentage of population with a disability between the ages 5 and 17 within an area, or if Eastern Europeans simply ended up residing in those areas with higher or lower levels of percentage of population with a disability between the ages 5 and 17 due to other factors.
Demographics Similar to Eastern Europeans by Disability Age 5 to 17
In terms of disability age 5 to 17, the demographic groups most similar to Eastern Europeans are Immigrants from Croatia (5.2%, a difference of 0.030%), Immigrants from Spain (5.2%, a difference of 0.030%), Immigrants from St. Vincent and the Grenadines (5.2%, a difference of 0.040%), Bulgarian (5.2%, a difference of 0.080%), and Immigrants from Kuwait (5.3%, a difference of 0.080%).
| Demographics | Rating | Rank | Disability Age 5 to 17 |
| Sri Lankans | 99.6 /100 | #80 | Exceptional 5.2% |
| Native Hawaiians | 99.6 /100 | #81 | Exceptional 5.2% |
| Immigrants from Sweden | 99.5 /100 | #82 | Exceptional 5.2% |
| Immigrants from France | 99.5 /100 | #83 | Exceptional 5.2% |
| Immigrants from Nicaragua | 99.5 /100 | #84 | Exceptional 5.2% |
| Bulgarians | 99.4 /100 | #85 | Exceptional 5.2% |
| Immigrants from St. Vincent and the Grenadines | 99.4 /100 | #86 | Exceptional 5.2% |
| Eastern Europeans | 99.4 /100 | #87 | Exceptional 5.2% |
| Immigrants from Croatia | 99.4 /100 | #88 | Exceptional 5.2% |
| Immigrants from Spain | 99.4 /100 | #89 | Exceptional 5.2% |
| Immigrants from Kuwait | 99.4 /100 | #90 | Exceptional 5.3% |
| Mongolians | 99.2 /100 | #91 | Exceptional 5.3% |
| Luxembourgers | 99.2 /100 | #92 | Exceptional 5.3% |
| Immigrants from Peru | 99.1 /100 | #93 | Exceptional 5.3% |
| Immigrants from Jordan | 99.1 /100 | #94 | Exceptional 5.3% |
Eastern European Disability Age 5 to 17 Correlation Summary
| Measurement | Eastern European Data | Disability Age 5 to 17 Data |
| Minimum | 0.14% | 1.1% |
| Maximum | 35.0% | 33.3% |
| Range | 34.9% | 32.2% |
| Mean | 7.6% | 5.6% |
| Median | 5.7% | 4.1% |
| Interquartile 25% (IQ1) | 2.9% | 3.6% |
| Interquartile 75% (IQ3) | 8.7% | 5.1% |
| Interquartile Range (IQR) | 5.8% | 1.6% |
| Standard Deviation (Sample) | 7.7% | 5.6% |
| Standard Deviation (Population) | 7.6% | 5.6% |
Correlation Details
| Eastern European Percentile | Sample Size | Disability Age 5 to 17 |
[ 0.0% - 0.5% ] 0.14% | 290,534,156 | 6.2% |
[ 0.0% - 0.5% ] 0.45% | 94,285,611 | 5.6% |
[ 0.5% - 1.0% ] 0.79% | 36,754,907 | 5.2% |
[ 1.0% - 1.5% ] 1.09% | 14,368,074 | 4.9% |
[ 1.0% - 1.5% ] 1.43% | 6,506,285 | 4.6% |
[ 1.5% - 2.0% ] 1.75% | 3,716,543 | 4.2% |
[ 2.0% - 2.5% ] 2.07% | 2,243,645 | 4.1% |
[ 2.0% - 2.5% ] 2.40% | 1,799,633 | 4.9% |
[ 2.5% - 3.0% ] 2.72% | 1,074,021 | 4.6% |
[ 3.0% - 3.5% ] 3.03% | 886,043 | 4.0% |
[ 3.0% - 3.5% ] 3.34% | 449,043 | 4.0% |
[ 3.5% - 4.0% ] 3.68% | 599,475 | 4.3% |
[ 4.0% - 4.5% ] 4.00% | 255,120 | 3.6% |
[ 4.0% - 4.5% ] 4.30% | 495,032 | 2.6% |
[ 4.5% - 5.0% ] 4.67% | 231,794 | 3.4% |
[ 4.5% - 5.0% ] 4.98% | 143,488 | 4.0% |
[ 5.0% - 5.5% ] 5.31% | 207,227 | 4.7% |
[ 5.5% - 6.0% ] 5.50% | 197,551 | 3.1% |
[ 5.5% - 6.0% ] 5.92% | 121,050 | 3.8% |
[ 6.0% - 6.5% ] 6.18% | 24,669 | 4.1% |
[ 6.0% - 6.5% ] 6.49% | 1,448 | 7.5% |
[ 6.5% - 7.0% ] 6.89% | 28,589 | 3.5% |
[ 7.0% - 7.5% ] 7.25% | 23,777 | 3.6% |
[ 7.5% - 8.0% ] 7.60% | 10,340 | 2.0% |
[ 7.5% - 8.0% ] 7.73% | 32,133 | 3.8% |
[ 8.0% - 8.5% ] 8.06% | 24,456 | 3.0% |
[ 8.5% - 9.0% ] 8.57% | 26,620 | 3.6% |
[ 8.5% - 9.0% ] 8.77% | 2,873 | 10.2% |
[ 9.0% - 9.5% ] 9.02% | 2,484 | 5.6% |
[ 9.0% - 9.5% ] 9.37% | 8,913 | 9.5% |
[ 11.0% - 11.5% ] 11.00% | 2,936 | 1.5% |
[ 14.5% - 15.0% ] 14.81% | 1,350 | 1.1% |
[ 17.5% - 18.0% ] 17.61% | 352 | 19.1% |
[ 20.0% - 20.5% ] 20.04% | 484 | 3.6% |
[ 30.5% - 31.0% ] 30.70% | 316 | 5.0% |
[ 35.0% - 35.5% ] 35.00% | 20 | 33.3% |