Tlingit-Haida No Schooling Completed
COMPARE
Tlingit-Haida
Select to Compare
No Schooling Completed
Tlingit-Haida No Schooling Completed
1.5%
NO SCHOOLING
100.0/ 100
METRIC RATING
15th/ 347
METRIC RANK
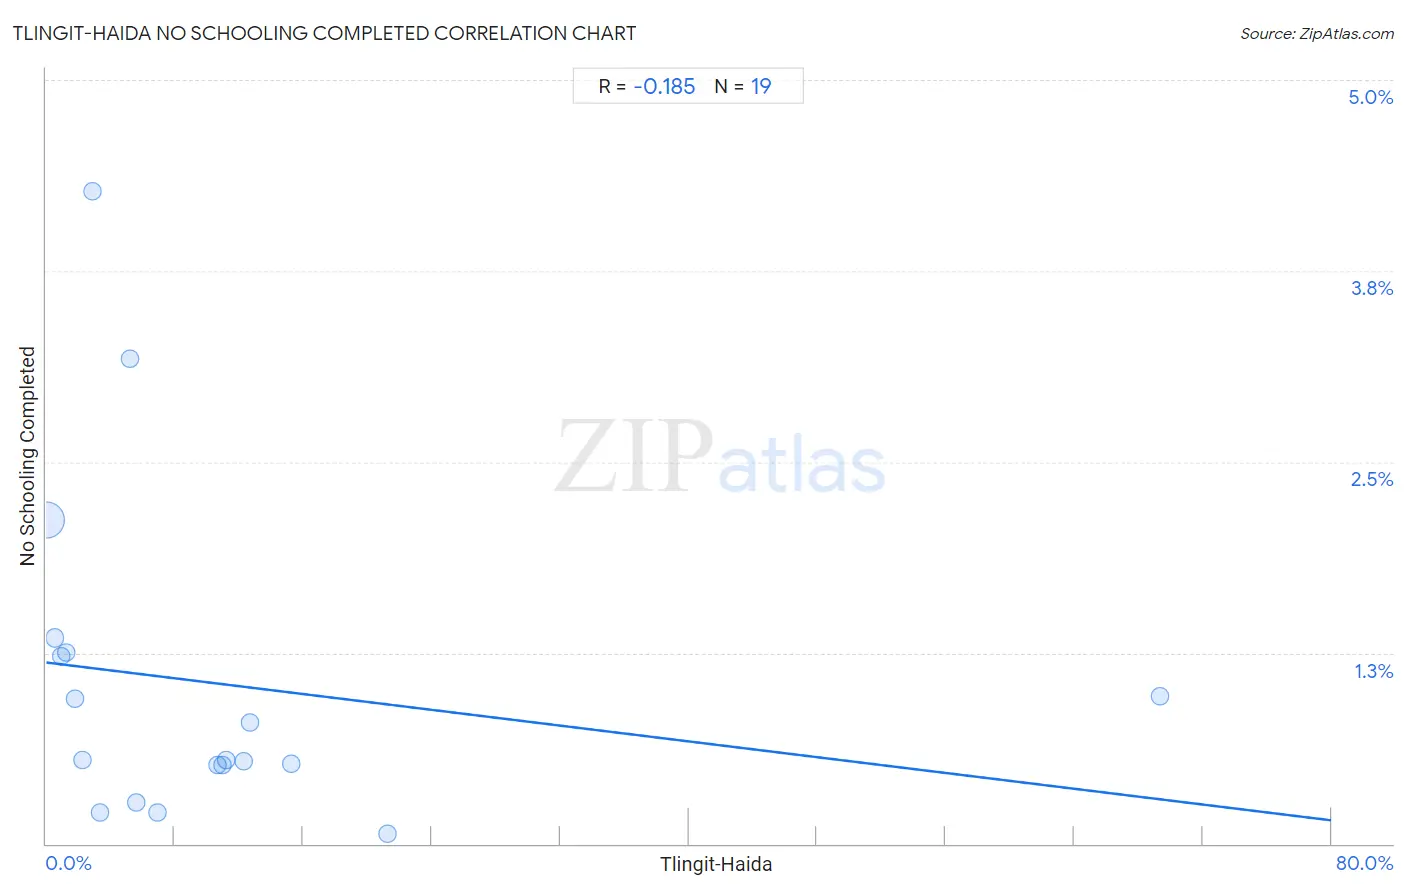
Tlingit-Haida No Schooling Completed Correlation Chart
The statistical analysis conducted on geographies consisting of 60,521,885 people shows a poor negative correlation between the proportion of Tlingit-Haida and percentage of population with no schooling in the United States with a correlation coefficient (R) of -0.185 and weighted average of 1.5%. On average, for every 1% (one percent) increase in Tlingit-Haida within a typical geography, there is a decrease of 0.013% in percentage of population with no schooling.
It is essential to understand that the correlation between the percentage of Tlingit-Haida and percentage of population with no schooling does not imply a direct cause-and-effect relationship. It remains uncertain whether the presence of Tlingit-Haida influences an upward or downward trend in the level of percentage of population with no schooling within an area, or if Tlingit-Haida simply ended up residing in those areas with higher or lower levels of percentage of population with no schooling due to other factors.
Demographics Similar to Tlingit-Haida by No Schooling Completed
In terms of no schooling completed, the demographic groups most similar to Tlingit-Haida are Scotch-Irish (1.5%, a difference of 0.060%), Finnish (1.5%, a difference of 0.52%), Croatian (1.5%, a difference of 0.53%), Danish (1.5%, a difference of 0.84%), and Alaskan Athabascan (1.5%, a difference of 0.94%).
| Demographics | Rating | Rank | No Schooling Completed |
| Swedes | 100.0 /100 | #8 | Exceptional 1.4% |
| Scottish | 100.0 /100 | #9 | Exceptional 1.4% |
| Dutch | 100.0 /100 | #10 | Exceptional 1.4% |
| Lithuanians | 100.0 /100 | #11 | Exceptional 1.4% |
| Irish | 100.0 /100 | #12 | Exceptional 1.4% |
| Poles | 100.0 /100 | #13 | Exceptional 1.4% |
| Scotch-Irish | 100.0 /100 | #14 | Exceptional 1.5% |
| Tlingit-Haida | 100.0 /100 | #15 | Exceptional 1.5% |
| Finns | 100.0 /100 | #16 | Exceptional 1.5% |
| Croatians | 100.0 /100 | #17 | Exceptional 1.5% |
| Danes | 100.0 /100 | #18 | Exceptional 1.5% |
| Alaskan Athabascans | 100.0 /100 | #19 | Exceptional 1.5% |
| Welsh | 100.0 /100 | #20 | Exceptional 1.5% |
| Chinese | 100.0 /100 | #21 | Exceptional 1.5% |
| Alaska Natives | 100.0 /100 | #22 | Exceptional 1.5% |
Tlingit-Haida No Schooling Completed Correlation Summary
| Measurement | Tlingit-Haida Data | No Schooling Completed Data |
| Minimum | 0.036% | 0.064% |
| Maximum | 69.3% | 4.3% |
| Range | 69.3% | 4.2% |
| Mean | 10.2% | 1.1% |
| Median | 5.6% | 0.55% |
| Interquartile 25% (IQ1) | 1.8% | 0.51% |
| Interquartile 75% (IQ3) | 12.3% | 1.2% |
| Interquartile Range (IQR) | 10.5% | 0.74% |
| Standard Deviation (Sample) | 15.5% | 1.1% |
| Standard Deviation (Population) | 15.1% | 1.0% |
Correlation Details
| Tlingit-Haida Percentile | Sample Size | No Schooling Completed |
[ 0.0% - 0.5% ] 0.036% | 58,846,250 | 2.1% |
[ 0.5% - 1.0% ] 0.55% | 1,247,338 | 1.3% |
[ 0.5% - 1.0% ] 0.91% | 222,468 | 1.2% |
[ 1.0% - 1.5% ] 1.21% | 64,155 | 1.2% |
[ 1.5% - 2.0% ] 1.75% | 12,157 | 0.95% |
[ 2.0% - 2.5% ] 2.29% | 8,298 | 0.55% |
[ 2.5% - 3.0% ] 2.87% | 2,505 | 4.3% |
[ 3.0% - 3.5% ] 3.36% | 5,484 | 0.20% |
[ 5.0% - 5.5% ] 5.24% | 420 | 3.2% |
[ 5.5% - 6.0% ] 5.62% | 1,762 | 0.27% |
[ 6.5% - 7.0% ] 6.94% | 2,146 | 0.20% |
[ 10.5% - 11.0% ] 10.70% | 29,933 | 0.51% |
[ 11.0% - 11.5% ] 11.00% | 32,108 | 0.51% |
[ 11.0% - 11.5% ] 11.18% | 13,913 | 0.55% |
[ 12.0% - 12.5% ] 12.27% | 16,919 | 0.54% |
[ 12.5% - 13.0% ] 12.66% | 8,647 | 0.79% |
[ 15.0% - 15.5% ] 15.26% | 2,169 | 0.52% |
[ 21.0% - 21.5% ] 21.23% | 4,267 | 0.064% |
[ 69.0% - 69.5% ] 69.34% | 946 | 0.97% |